Activation of PTHrP-cAMP-CREB1 signaling following p53 loss is essential for osteosarcoma initiation and maintenance
- St. Vincent's Institute of Medical Research, Australia
- University of Melbourne, Australia
- University of Adelaide, Australia
- South Australian Health and Medical Research Institute, Australia
- ACRF Rational Drug Discovery Centre, St. Vincent’s Institute of Medical Research, Australia
Figures
Figure 1 with 2 supplements
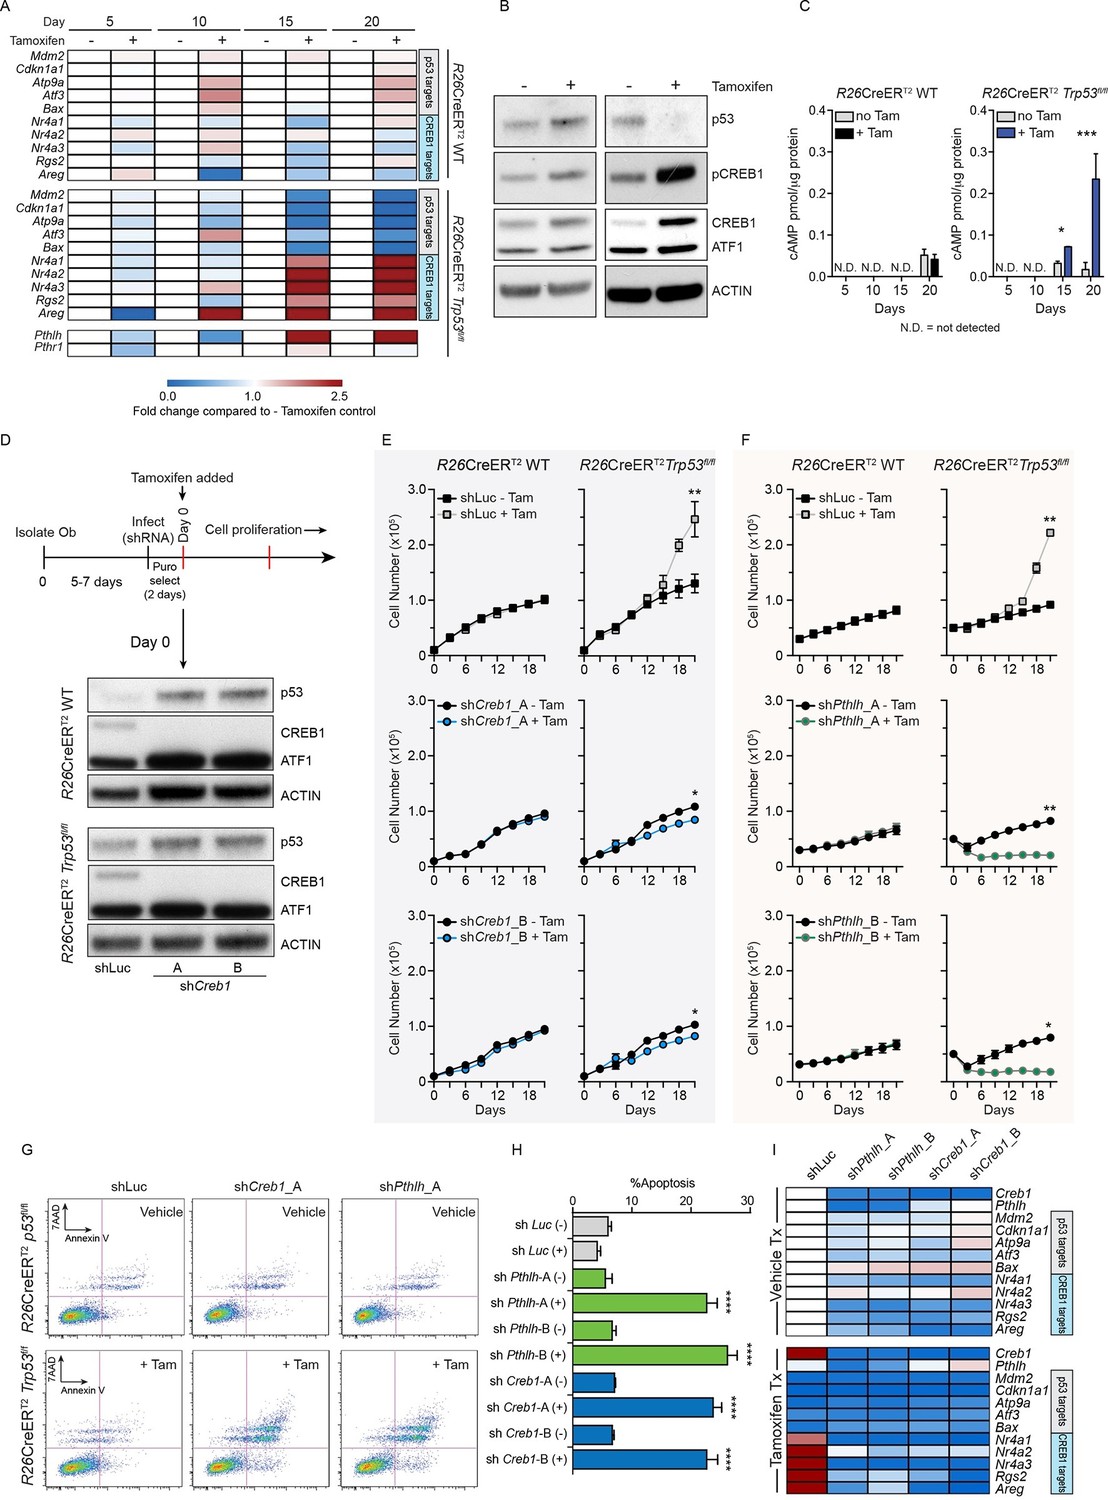
Intact PTHrP and CREB1 are necessary for hyperproliferation of p53-deficient primary osteoblasts.
(A) Heat map of qPCR data. Expression of the PTHrP/CREB1 and p53 target genes between indicated cell types. Data from >3 independent cell lines for each, expressed as fold change relative to non-tamoxifen treated isogenic culture. (B) Western blot of p53, pCREB1 and CREB1, β-ACTIN used as a loading control. Data representative of 2–3 independent cell lines from each. (C) Quantification of cAMP levels (+IBMX) in the R26-CreERT2p53+/+ (vehicle and tamoxifen treated) and R26-CreERT2p53fl/fl vehicle and tamoxifen treated (p53△/△) primary osteoblasts, and day 5, 10, 15 and 20 days post tamoxifen. Data from 2 R26-CreERT2p53+/+ and 4 R26-CreERT2p53fl/fl independent cultures; mean ± SEM. (D) Experimental outline for proliferation assay; Western blot of p53, pCREB1 and CREB1 in indicated cell types, β-ACTIN used as a loading control at Day 0 of culture. Proliferation assays performed in the indicated genotype post CREB1 (E) and PTHrP (F) knockdown with tamoxifen treatment commencing at day 0; shLuc = control shRNA; Data from 4 independent R26-CreERT2p53fl/fl and 2 R26-CreERT2p53+/+ cultures; mean ± SEM and statistics = area under the curve across the time course. (G) AnnexinV/7-AAD profiles of R26-CreERT2p53fl/fl +/- tamoxifen treatment infected with control (shLuc), shCreb1_A or shPthlh_A. (H) Percent apoptotic cells in each culture +/- tamoxifen. (I) Heat map of qPCR data. Expression of the p53 and PTHrP/CREB1 target genes between cell types; 3 independent cell cultures for each condition. Data expressed as mean ± SEM (n=3). For all panels: *p<0.05, **p<0.01, ***p<0.001. See Figure 1—figure supplement 1 and Figure 1—figure supplement 2.
Figure 1—figure supplement 1
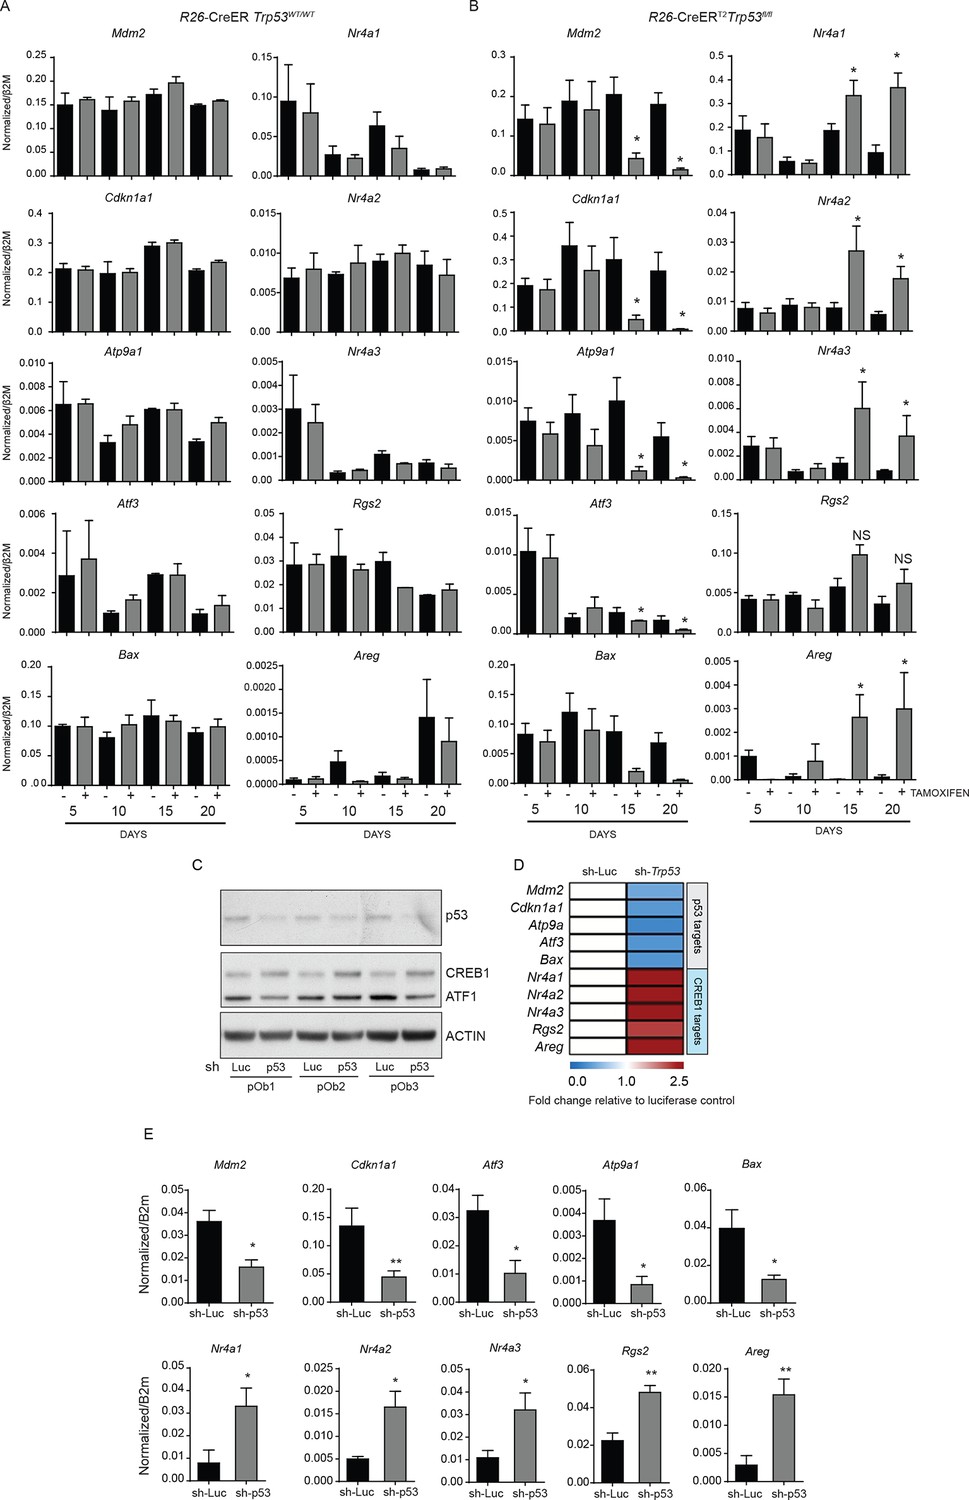
Expression of p53 and PTHrP/CREB1 target genes in R26-CreER p53+/+ and R26-CreER p53fl/fl cultures +/- tamoxifen.
(A) Expression of p53 (Mdm2, Cdkn1a1, Atp9a1, Atf3, Bax) and PTHrP/CREB1 (Nr4a1, Nr4a2, Nr4a3, Rgs2, Areg) target genes at the indicated time points +/- tamoxifen in WT (R26-CreER p53+/+) primary osteoblast cultures (n=2 independent cultures). (B) Expression of p53 (Mdm2, Cdkn1a1, Atp9a1, Atf3, Bax) and PTHrP/CREB1 (Nr4a1, Nr4a2, Nr4a3, Rgs2, Areg) target genes at the indicated time points +/- tamoxifen in p53 deficient (R26-CreER p53fl/fl) primary osteoblast cultures (n=4 independent cultures). QPCR data normalized to β2m, for all the experiments above Students t-test was used, *p<0.05. (C) Expression of p53, CREB1, ATF1 and ACTIN after infection with a control (sh-Luc) or p53 targeting shRNA in primary long bone osteoblasts. (D) Expression of p53 (Mdm2, Cdkn1a1, Atp9a1, Atf3, Bax) and PTHrP/CREB1 (Nr4a1, Nr4a2, Nr4a3, Rgs2, Areg) target genes at the indicated time points 48 hr after selection of cells infected with control (sh-Luc) or p53 targeting shRNA (n=3 independent cultures). qPCR data normalized to β2m. (E) Raw data normalized to β2m, for data in panel D; Students t-test was used, *p<0.05..
Figure 1—figure supplement 2

Effects of shRNA against Pthrp and Creb1 in R26-CreER p53+/+ and R26-CreER p53fl/fl cultures +/- tamoxifen.
(A) Expression of Pthlh, Creb1 and p53 in WT (R26-CreER p53+/+) primary osteoblast cultures (n=2 independent cultures) at Day 0. (B) Expression of Pthlh, Creb1 and p53 in p53 deficient (R26-CreER p53fl/fl) primary osteoblast cultures (n=4 independent cultures) at Day 0 of tamoxifen addition. (C) Expression of CREB1 and p53 at Day 15 and 21 in WT (R26-CreER p53+/+) primary osteoblast cultures (n=2 independent cultures). (D) Genomic PCR for p53 locus at Day 15 and 21 in WT (R26-CreER p53+/+) primary osteoblast cultures (n=2 independent cultures). (E) Expression of CREB1 and pCREB1 at Day 15 and 21 in p53 deficient (R26-CreER p53fl/fl) primary osteoblast cultures (n=4 independent cultures). (F) Genomic PCR for p53 locus at Day 15 and 21 in p53 deficient (R26-CreER p53fl/fl) primary osteoblast cultures (n=4 independent cultures). (G) Expression of p53 target genes and (H) PTHrP/CREB1 target genes 72 hrs after infection of isogenic p53 deficient (R26-CreER p53fl/fl) +/- tamoxifen primary osteoblast cultures at day 21 post tamoxifen/vehicle addition (n=3 independent cultures). Data expressed as fold change relative to shLuc vehicle control cultures. qPCR data normalized to β2m, for all the experiments above Students t-test was used, *p<0.05, **p<0.001, ***p<0.0001.
Figure 2 with 2 supplements

Cell autonomous stimulation of cAMP by PTHrP in OS.
(A) Cartoon of PTHrP-PTHR1-cAMP-CREB1 axis. (B) qPCR expression of Pthlh normalized to β2m; mean ± SEM (n=3). (C) cAMP levels after anti-PTHrP antibody treatment for fibroblastic OS (light grey) and osteoblastic OS (dark grey). Expressed as normalized mean cAMP ± SEM ((n=3/subtype). (D) Knockdown of Pthlh transcript using 2 independent shRNA (A and B) in indicated OS subtypes. Data normalized to β2m, expressed as mean ± SEM (n=3/subtype). (E) Fold reduction of cAMP levels in sh-Pthlh infected OS subtype cells. IBMX in all treatments, data displayed as normalized mean cAMP ± SEM (n=3/subtype). The data is the mean of 3 independent cell cultures for each subtype. (F) pCREB1/CREB1 protein levels following knockdown of PTHrP. Pan-ACTIN/ATF-1 used as a loading control. Data are representative of 2 independent cell cultures from each OS subtype. (G) Expression of indicated CREB1 target gene transcripts following Pthlh knockdown. Means ± SEM (n=3/subtype). (H) AnnexinV/7-AAD staining of indicated cells following infection with two independent sh-Pthlh (A and B) or sh-Luc control. (I) Quantitation of dead cells in indicated cell type. The data represents 3 independent cell cultures for each type, mean ± SEM (n=3). *p<0.05, **p<0.001, ***p<0.0001. (J) In vivo bilateral grafts of independent fibrobastic OS lines OS80 and 494H with control (sh-Luc) on one flank and sh-Pthlh_A on the other flank. Data expressed as mean weight ± SEM (n=3 tumours per shRNA per cell line; performed once); P value as indicated. See Figure 2—figure supplement 1 and Figure 2—figure supplement 2.
Figure 2—figure supplement 1
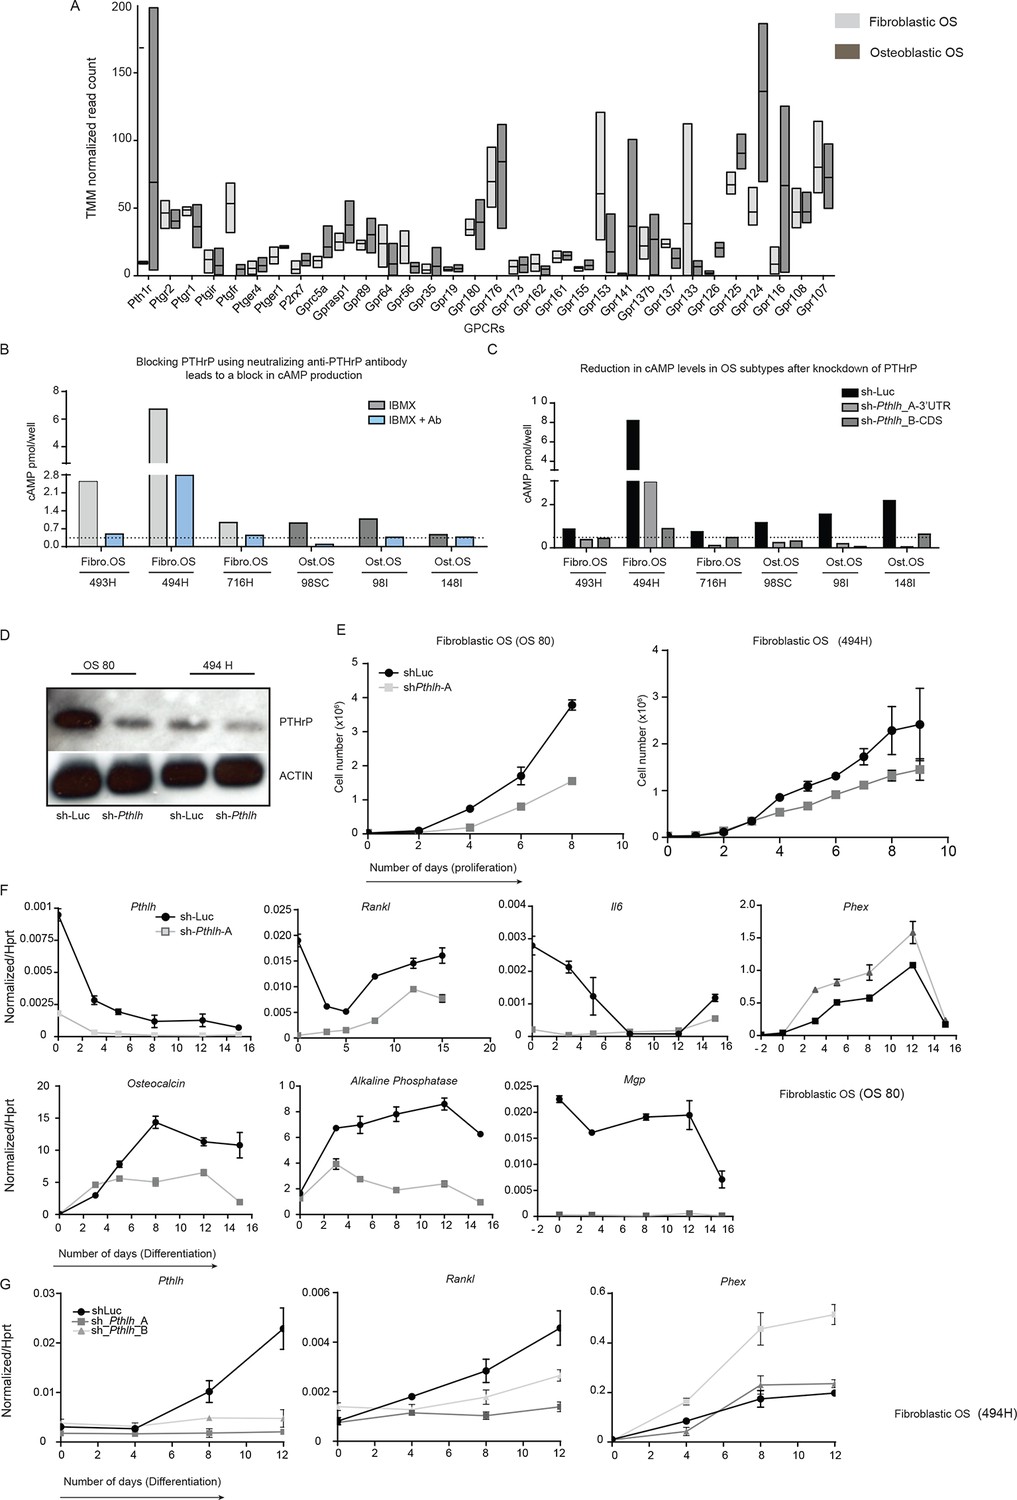
PTHrP, an endogenous ligand for cAMP signaling in OS.
(A) Average number of reads (TMM normalised, RNA-seq) representing the GPCRs expressed in fibroblastic and osteoblastic OS. (B) cAMP assays in 3 independent cell cultures within 2 OS subtypes depicting the effect of PTHrP blockade using anti-PTHrP antibody. (C) cAMP assays in 3 independent cell cultures within 2 OS subtypes post Pthlh knockdown. (D) Western blot showing the loss of PTHrP protein upon knockdown as compared to control cells (E) Cell proliferation post knockdown of Pthlh in two fibroblastic OS cultures. (F, G) Expression of genes in fibroblastic OS cultures (OS80 and 494H) by qPCR and normalized to Hprt. Data expressed as relative expression.
Figure 2—figure supplement 2

PTHrP overexpression alone does not initiate OS.
(A) Quantification of PTHrP levels in the media of primary osteoblasts infected with control retrovirus (MSCV_Control; empty vector) or PTHrP expressing retrovirus (MSCV_PTHrP). Media from infected cells was applied to UMR106.01 cells and cAMP levels measured by radioimmunoassay. (B) Representative AnnexinV/7-AAD staining profiles of primary osteoblasts following infection with control or PTHrP overexpressing retrovirus. (C) Quantitation of cell death from AnnexinV/7-AAD staining following infection with control or PTHrP overexpressing retrovirus. Data expressed as mean ± SEM, Students t-test was used, *p<0.05, **p<0.001, ***p<0.0001.
Figure 3 with 2 supplements
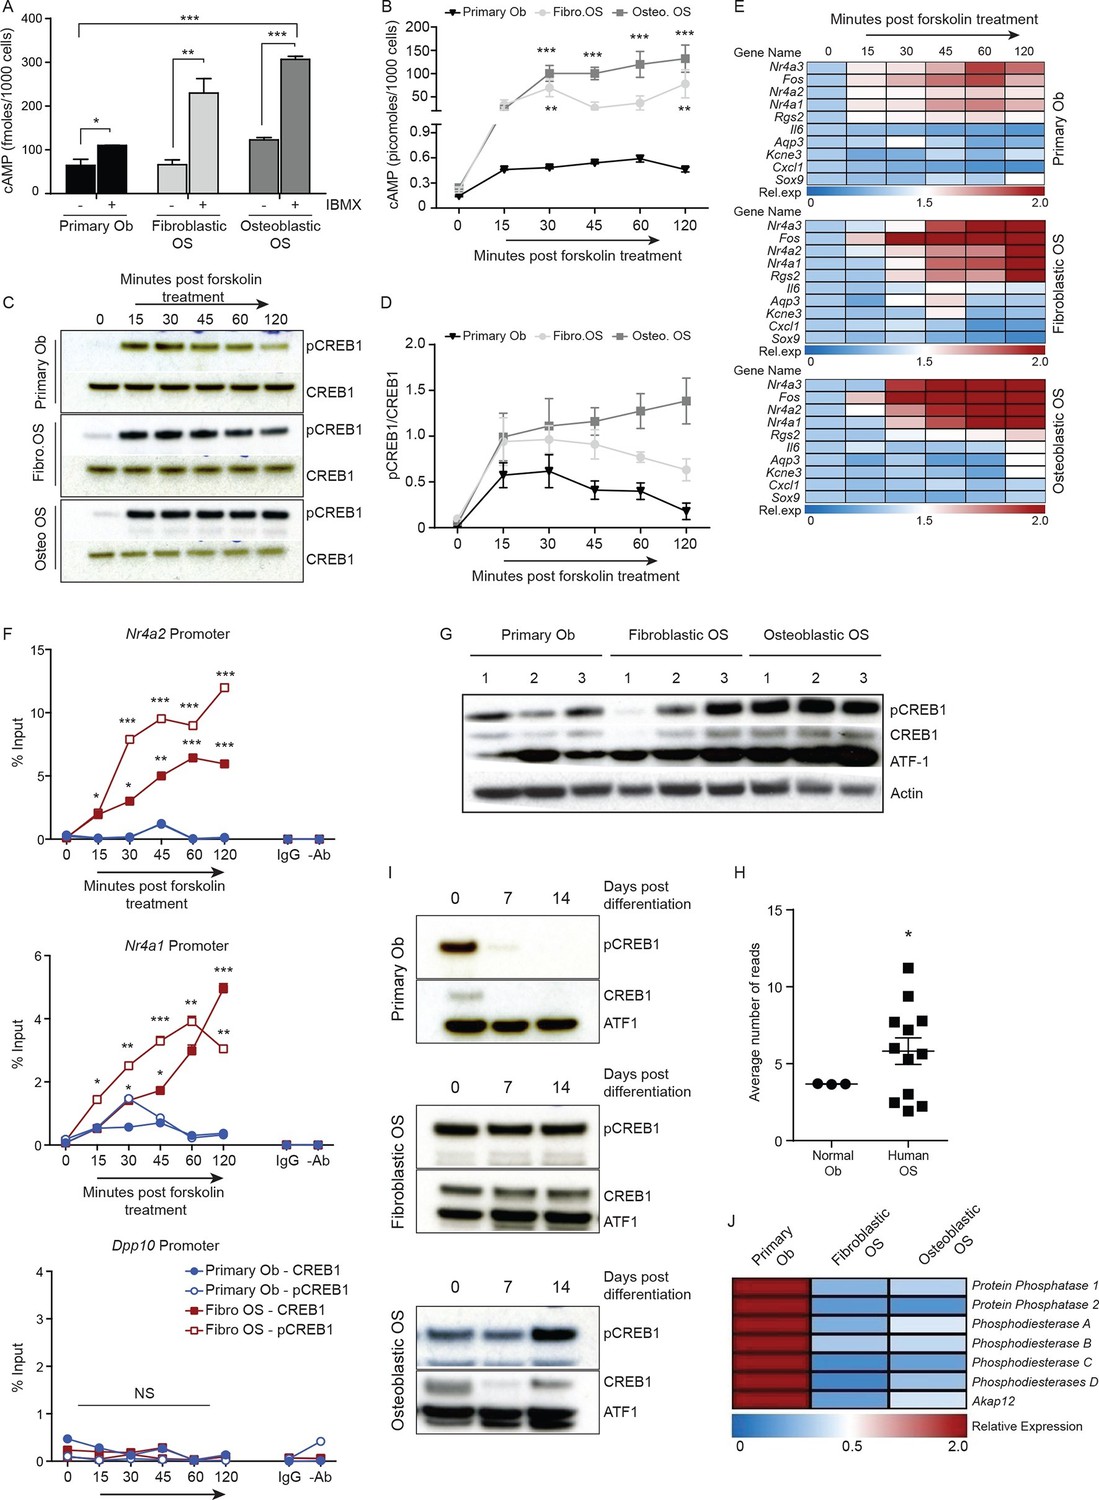
Persistent, elevated cAMP production in OS compared to primary osteoblasts.
(A) cAMP levels in indicated cells (1000 cells per well) with and without IBMX treatment. Data from 3 independent cultures per type, mean ± SEM. (B) Intracellular cAMP levels in indicated cell type following treatment with forskolin; mean ± SEM (n=3 per cell type; 1000 cells per well); statistical significance for OS vs normal Ob; all points of fibroblastic vs osteoblastic OS not significantly different. (C) Western blot and (D) quantification of CREB1/pCREB1 during a time course of cAMP activation by forskolin. Data representative of 2 independent cultures each. (E) Heat map of qPCR data. CREB1 target gene expression in indicated cells; data expressed as relative expression. (F) ChIP analysis of CREB1/pCREB1 on the promoters of indicated genes over a 2 hr time course following stimulation with forskolin. Data is represented as percentage of input. The data from 2 independent cell lines for each subtypes mean occupancy ± SEM (n=2–3 assays per line). (G) Western blot of CREB1/pCREB1 expression in proliferating non stimulated cultures, β-ACTIN used as a loading control. Data representative of 3–4 independent cell lines from each type. (H) CREB1 transcript expression in human osteoblasts and osteosarcoma (data taken from PMID: 25961939). (I) Western CREB1/pCREB1 expression in indicated cell types under differentiative conditions, ATF-1 used as a loading control. (J) Relative expression of negative regulators of cAMP in OS subtypes compared to primary osteoblasts by qPCR and normalized to β2m represented as a heat map (n=3/cell type). *p<0.05, **p<0.001, ***p<0.0001. See Figure 3—figure supplement 1 and Figure 3—figure supplement 2.
Figure 3—figure supplement 1
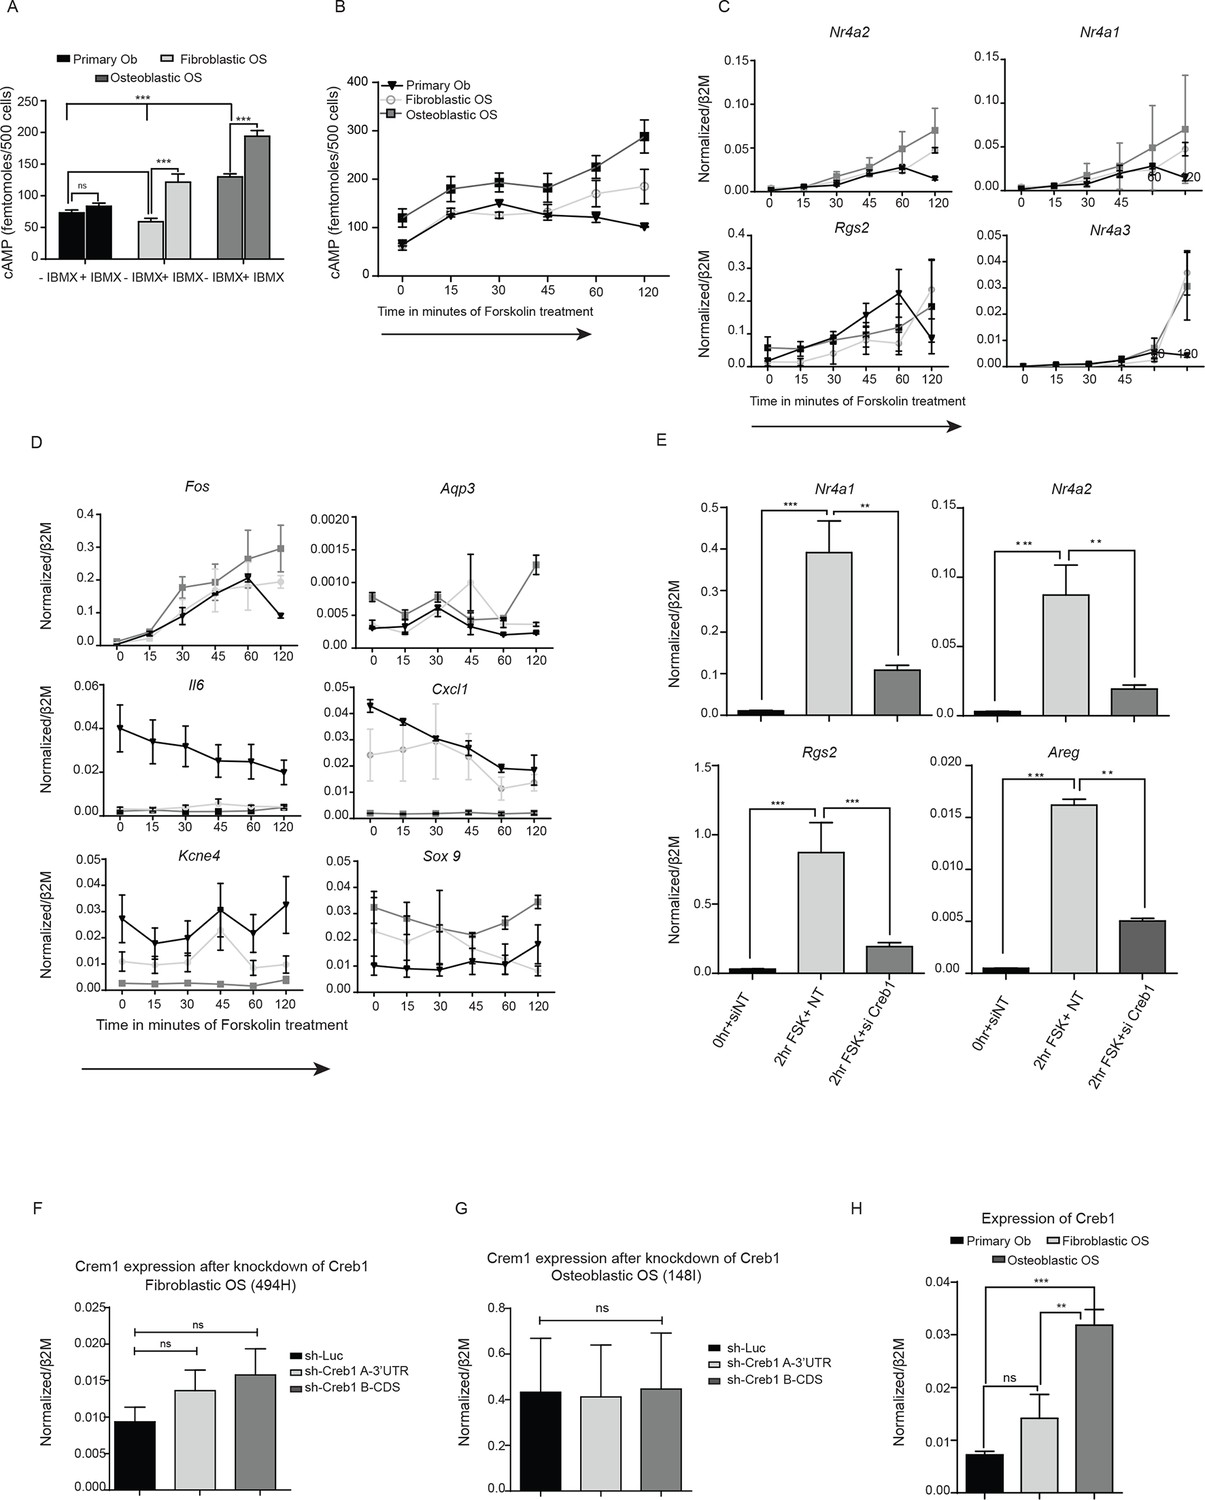
cAMP is constitutive in mouse OS leading to continuous phosphorylation of CREB1.
(A) Quantification of cAMP in primary osteoblasts, and OS with and without IBMX treatment (500 cells/well). Data represents 3 independent cell cultures for each type, mean ± SEM. (B) Kinetics of cAMP accumulation in OS subtypes as compared to primary osteoblasts in the absence of IBMX treated with 10 μM forskolin (using 500 cells/well). (C-D) qPCR validation of CREB1 target gene expression following 10 μM forskolin treatment over a time course of 2 hr. The data represents 3 independent cell cultures for each subtype ± SEM (n=3). (E) Expression of CREB1 target genes post knockdown of Creb1 using siRNA by qPCR and normalized to β2m. Means ± SEM (n=3). The data represents 3 independent cell lines for each subtype ± SEM (n=3). Effect of Creb1 knockdown on Crem1 expression in fibroblastic OS (F) and osteoblastic OS (G), respectively. Expression of Crem1 by qPCR and normalized to β2m. Means ± SEM (n=3). (H) Expression of Creb1 in primary osteoblasts compared to each OS subtype by qPCR and normalized to β2m. Means± SEM (n=3). For all the experiments above Students t-test was used to assess statistical significance, *p<0.05, **p<0.001, ***p<0.0001
Figure 3—figure supplement 2
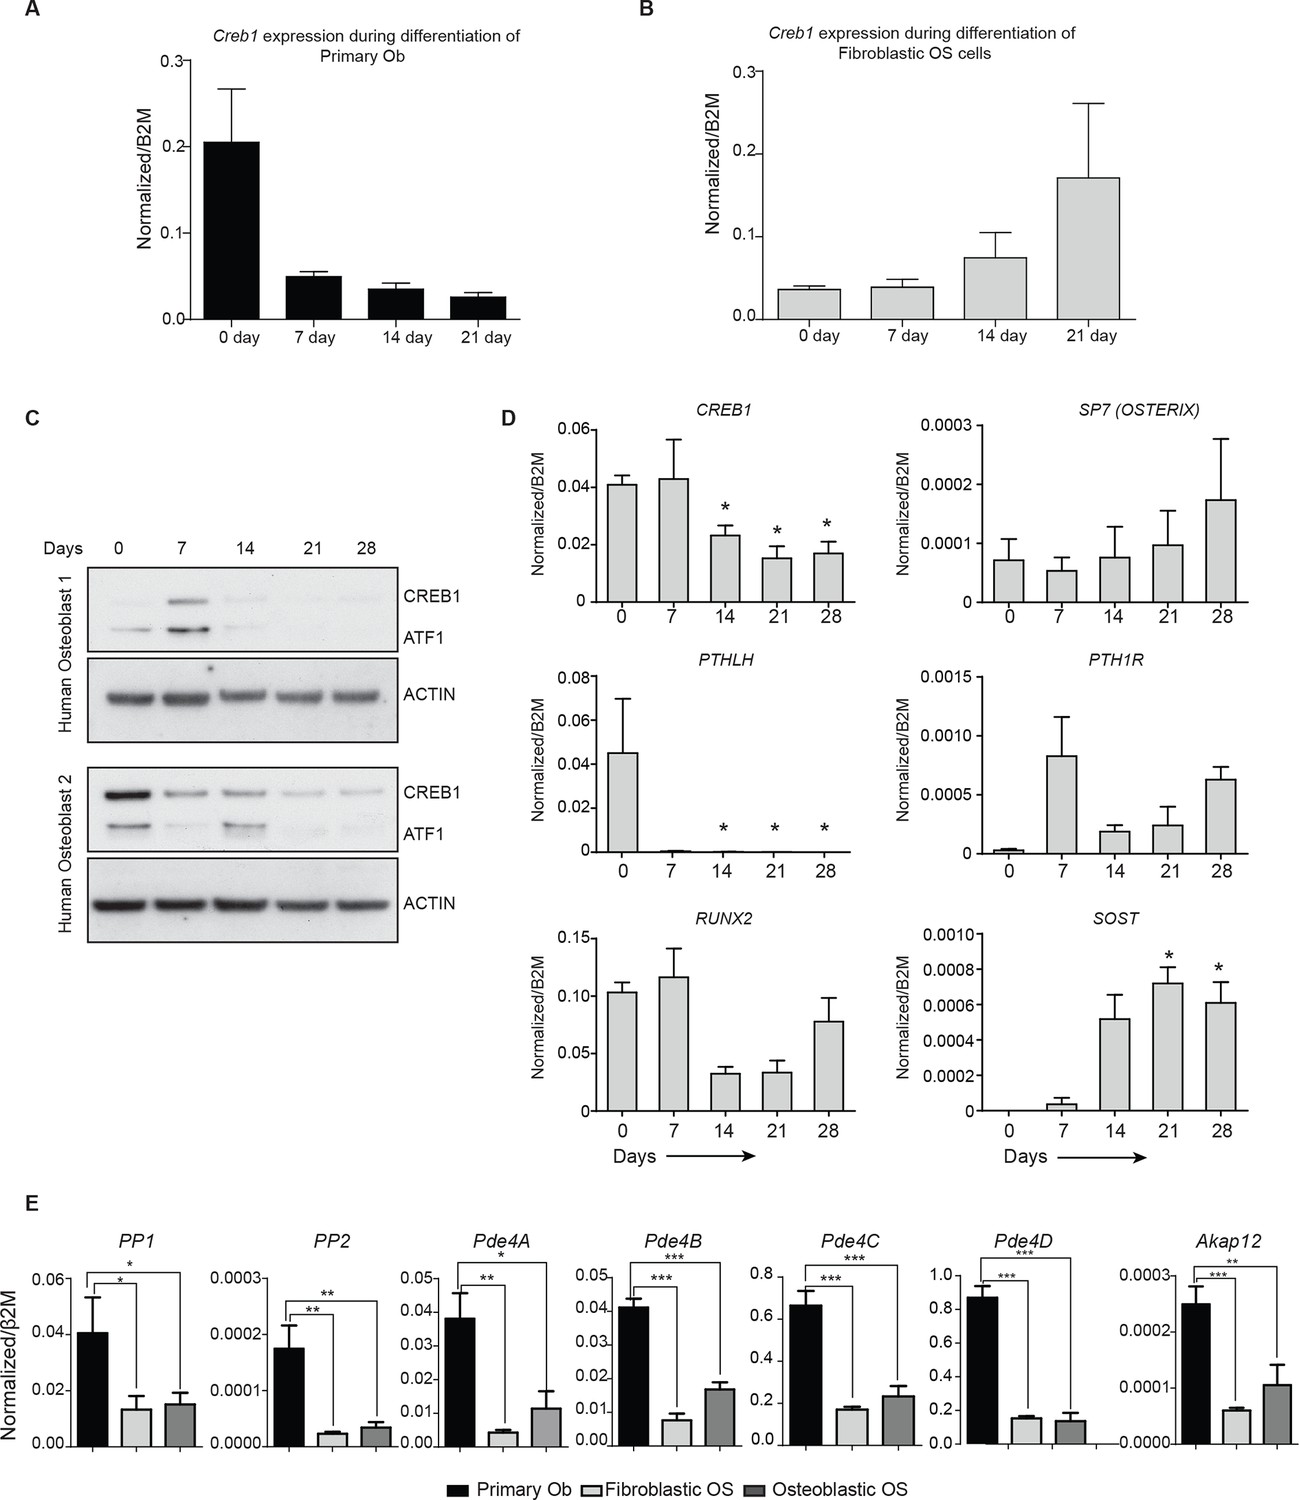
Altered Creb1 dynamics in osteoblasts and OS.
(A) Expression of Creb1 during in vitro differentiation of primary osteoblasts, data expressed as mean ± SEM (n=3). (B) Expression of Creb1 during in vitro differentiation of fibroblastic OS, data expressed as mean ± SEM (n=3). (C) Expression of CREB1 protein during in vitro differentiation of primary human osteoblasts isolated from normal healthy donors (17–35 year old). (D) Expression of CREB1 transcript during in vitro differentiation of primary human osteoblasts and markers of osteoblast differentiation state as indicated, data expressed as normalized gene expression compared to β2microglobulin expression; graphed as mean ± SEM (n=5 independent donor samples). (E) Expression of negative regulators of cAMP in OS subtypes compared to primary osteoblasts by qPCR and normalized to β2m (n=3/cell type). *p<0.05, **p<0.001, ***p<0.0001.
Figure 4 with 2 supplements
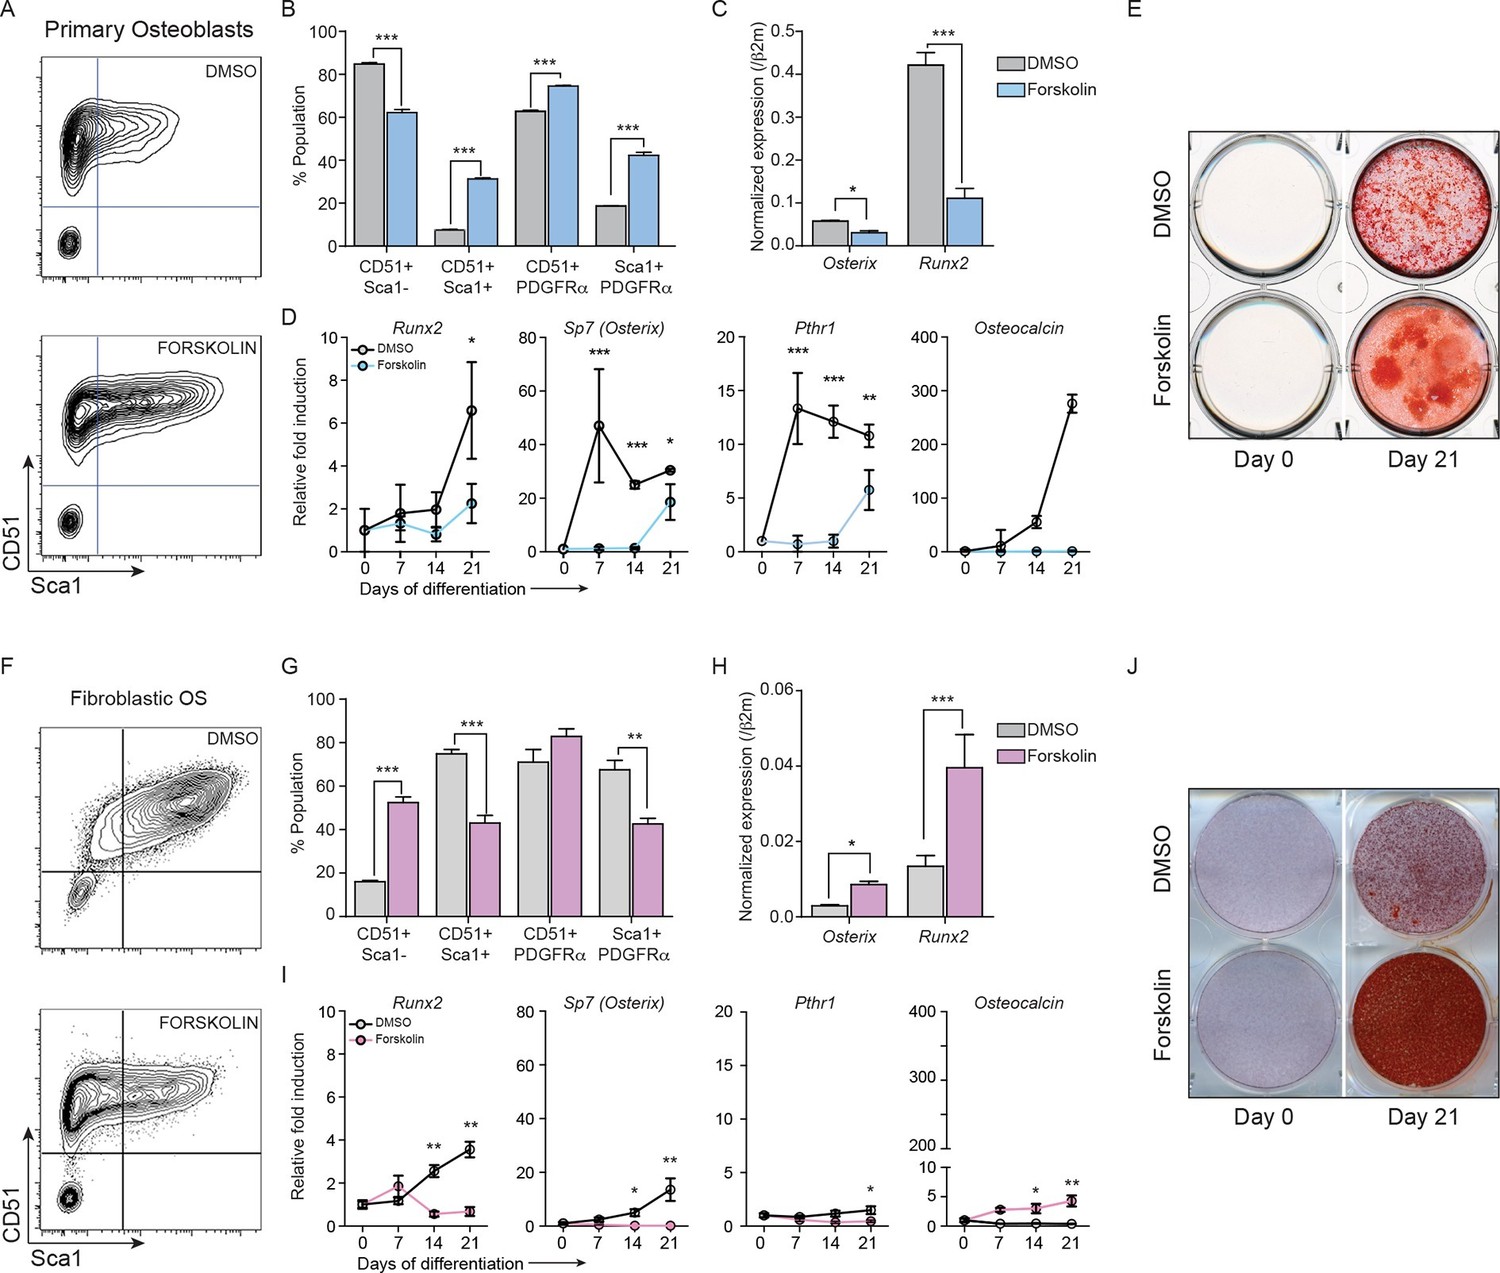
Constitutively elevated cAMP differentially affects primary osteoblasts and osteosarcoma cells.
(A) Primary osteoblasts treated with DMSO or forskolin for 72 hr and assessed for expression of Sca-1, CD51, PDGFRα , representative results shown, n=3 independent experiments. (B) Quantitation of cell surface markers from each treatment (n=3 independent cultures) (C) Expression of Sp7 (Osterix) and Runx2 by qPCR after 72 hr of forskolin treatment. Expression levels normalized to β2m; mean ± SEM (n=3). (D) Expression level of indicated genes over 21 days of treatment with DMSO or forskolin. Expression normalized to β2m; mean ± SEM (n=3). (E) Mineralisation analysis of primary osteoblasts at day 21 after treatment. Images are representative of 3 independent experiments. (F) Fibroblastic OS cells were treated with DMSO or forskolin for 72 hr and assessed for expression of Sca-1, CD51, PDGFRα, representative results shown. (G) Quantitation of cell surface markers from (n=3 independent cultures of fibroblastic OS) from each treatment. (H) Expression of Sp7 (Osterix) and Runx2 in fibroblastic OS by qPCR following 72 hr treatment. Expression levels normalized to β2m; mean ± SEM (n=3). (I) Expression of indicated genes in fibroblastic OS over 21 days from each treatment. Expression normalized to β2m; mean ± SEM (n=3). (J) Representative images of alizarin red stained fibroblastic OS cells treated with DMSO or forskolin for 21 day; n=3 independent OS cultures; *p<0.05, **p<0.001, ***p<0.0001. See Figure 4—figure supplement 1 and Figure 4—figure supplement 2.
Figure 4—figure supplement 1
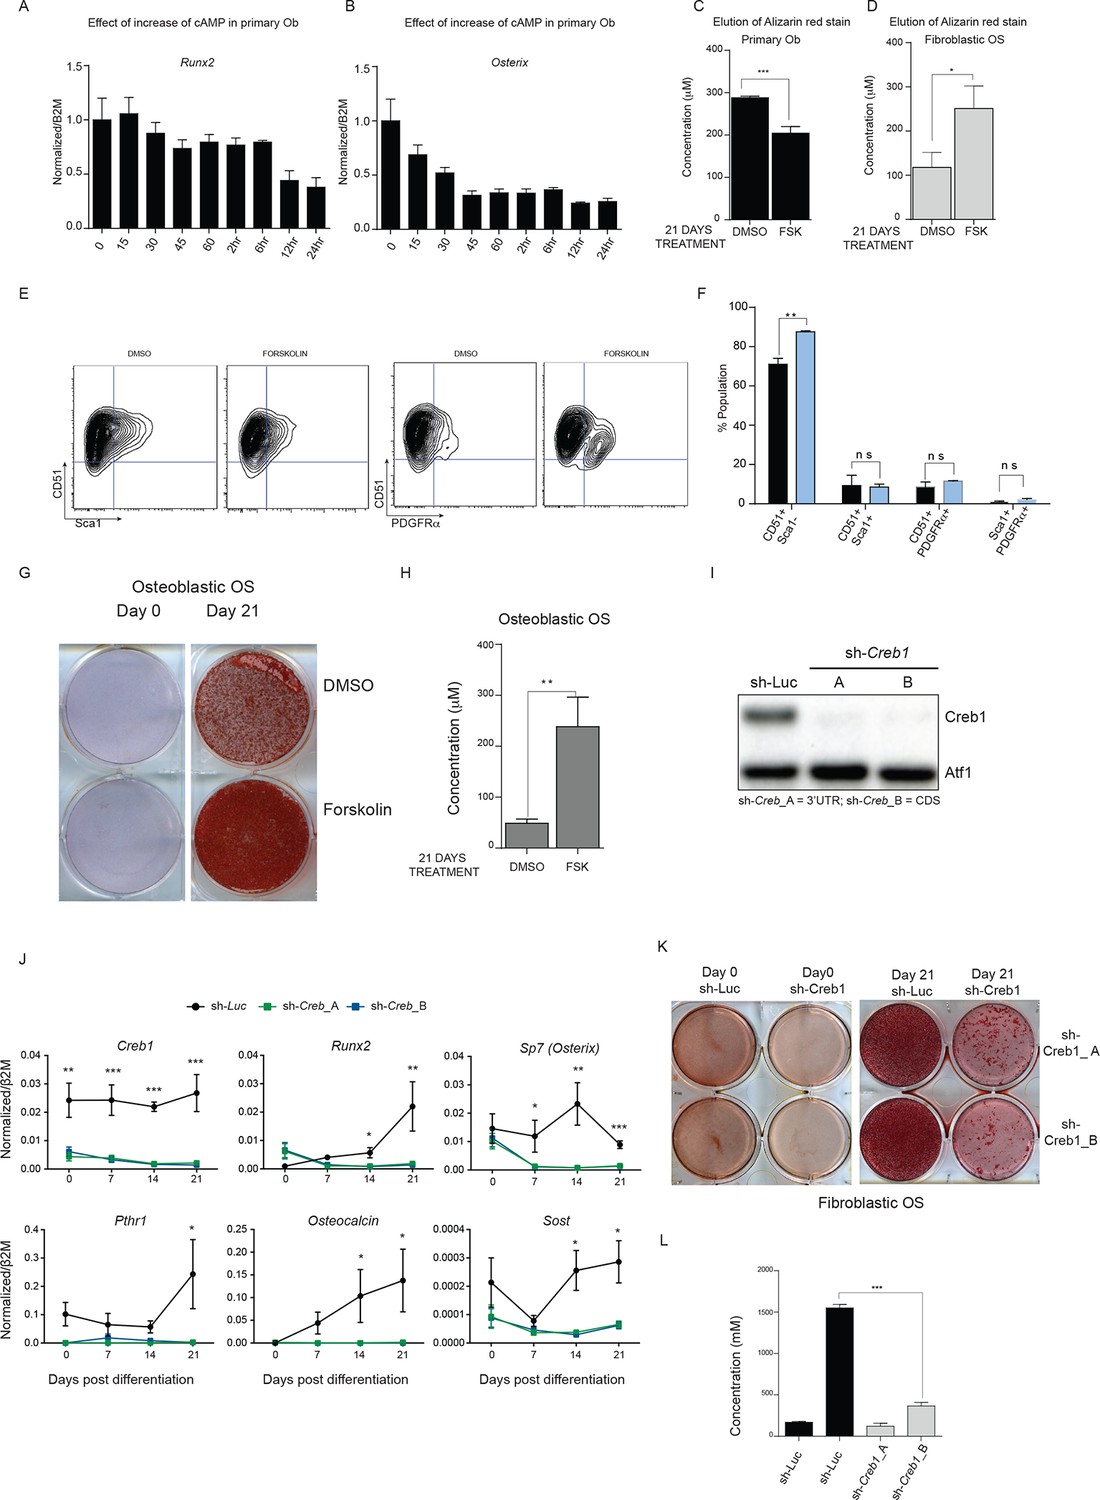
cAMP has different effects in OS and primary osteoblasts.
(A, B) Expression of Runx2 and Osterix by qPCR and normalized to β2m; means ± SEM (n=3). (C, D) Quantitation of elution of Alizarin red stain from primary osteoblasts and fibroblastic OS cells treated with DMSO or 10 μM forskolin for 21 days. The data is representative of 3 independent experiments with each. (E) Cell surface profiling for Sca-1 and CD51 (αV Integrin), PDGFRα on osteoblastic OS cells (F) Quantitation of Sca-1/CD51, Sca-1/PDGFRα and CD51/PDGFRα populations in osteoblastic OS (n>3) with (blue bars) and without (black bars) forskolin treatment. (G) Mineralisation assay showing alizarin red staining of osteoblastic OS cells. (H) Quantitation of elution of Alizarin red staining of osteoblastic OS cells treated with DMSO or 10 μM forskolin for 21 days. The data is representation of 3 independent experiments. (I) Representative western blot for CREB1 following infection with 2 independent shRNA or control shRNA (shLuc). (J) Gene expression analysis of fibroblastic OS infected with the indicated shRNA and placed in differentiating conditions for the indicated periods of time. qPCR data normalized to β2m (n=3/cell type). (K-L) Representative alizarin stained wells and quantitation of alizarin elution from day 21 cultures in differentiating conditions with fibroblastic OS. For all the experiments above Students t-test was used, *p<0.05, **p<0.001, ***p<0.0001.
Figure 4—figure supplement 2

Level of cAMP in primary osteoblasts and osteosarcoma cells +/- forskolin.
(A) Intracellular cAMP levels in primary osteoblasts and fibroblastic OS cells at day 0 and day 21 of culture in differentiation inductive conditions with no exogenous agonist added (IBMX treated only); data expressed as cAMP level (pmol) per μg protein; graphed as mean ± SEM (n=3). (B) Intracellular cAMP levels in primary osteoblasts and fibroblastic OS cells at day 21 of culture in differentiation inductive conditions with forskolin (continuously present in the culture); data expressed as cAMP level (pmol) per μg protein; graphed as mean ± SEM (n=3). (C) Intracellular cAMP levels in primary osteoblasts and fibroblastic OS cells at day 21 of culture in differentiation inductive conditions with acute forskolin treatment at day 21 (20 min exposure to forskolin only); data expressed as cAMP level (pmol) per μg protein; graphed as mean ± SEM (n=3).
Figure 5

CREB1 is differentially required for proliferation and survival by OS subtypes.
(A) CREB1 in primary osteoblasts 72 hr after infection with indicated shRNA construct. ATF1 was used as a loading control; representative blot from 3 independent cultures; proliferation plotted as mean ± SEM (n=3). (B) Western blot of CREB1 and proliferation kinetics of shCreb1 knockdown and sh-Luc fibroblastic OS; representative blot from 3 independent OS lines; proliferation as mean ± SEM (n=3). (C) Western of CREB1 in osteoblastic OS cells 72 hr after infection; ATF1 = loading control. Viability (annexinV/7AAD) of indicated OS subtype following infection with each shRNA. Data are representative of 3 independent cell lines/type; quantitation of dead cells. Data from 3 independent cell lines/subtypes; mean ± SEM. *p<0.05, **p<0.001, ***p<0.0001
Figure 6 with 1 supplement
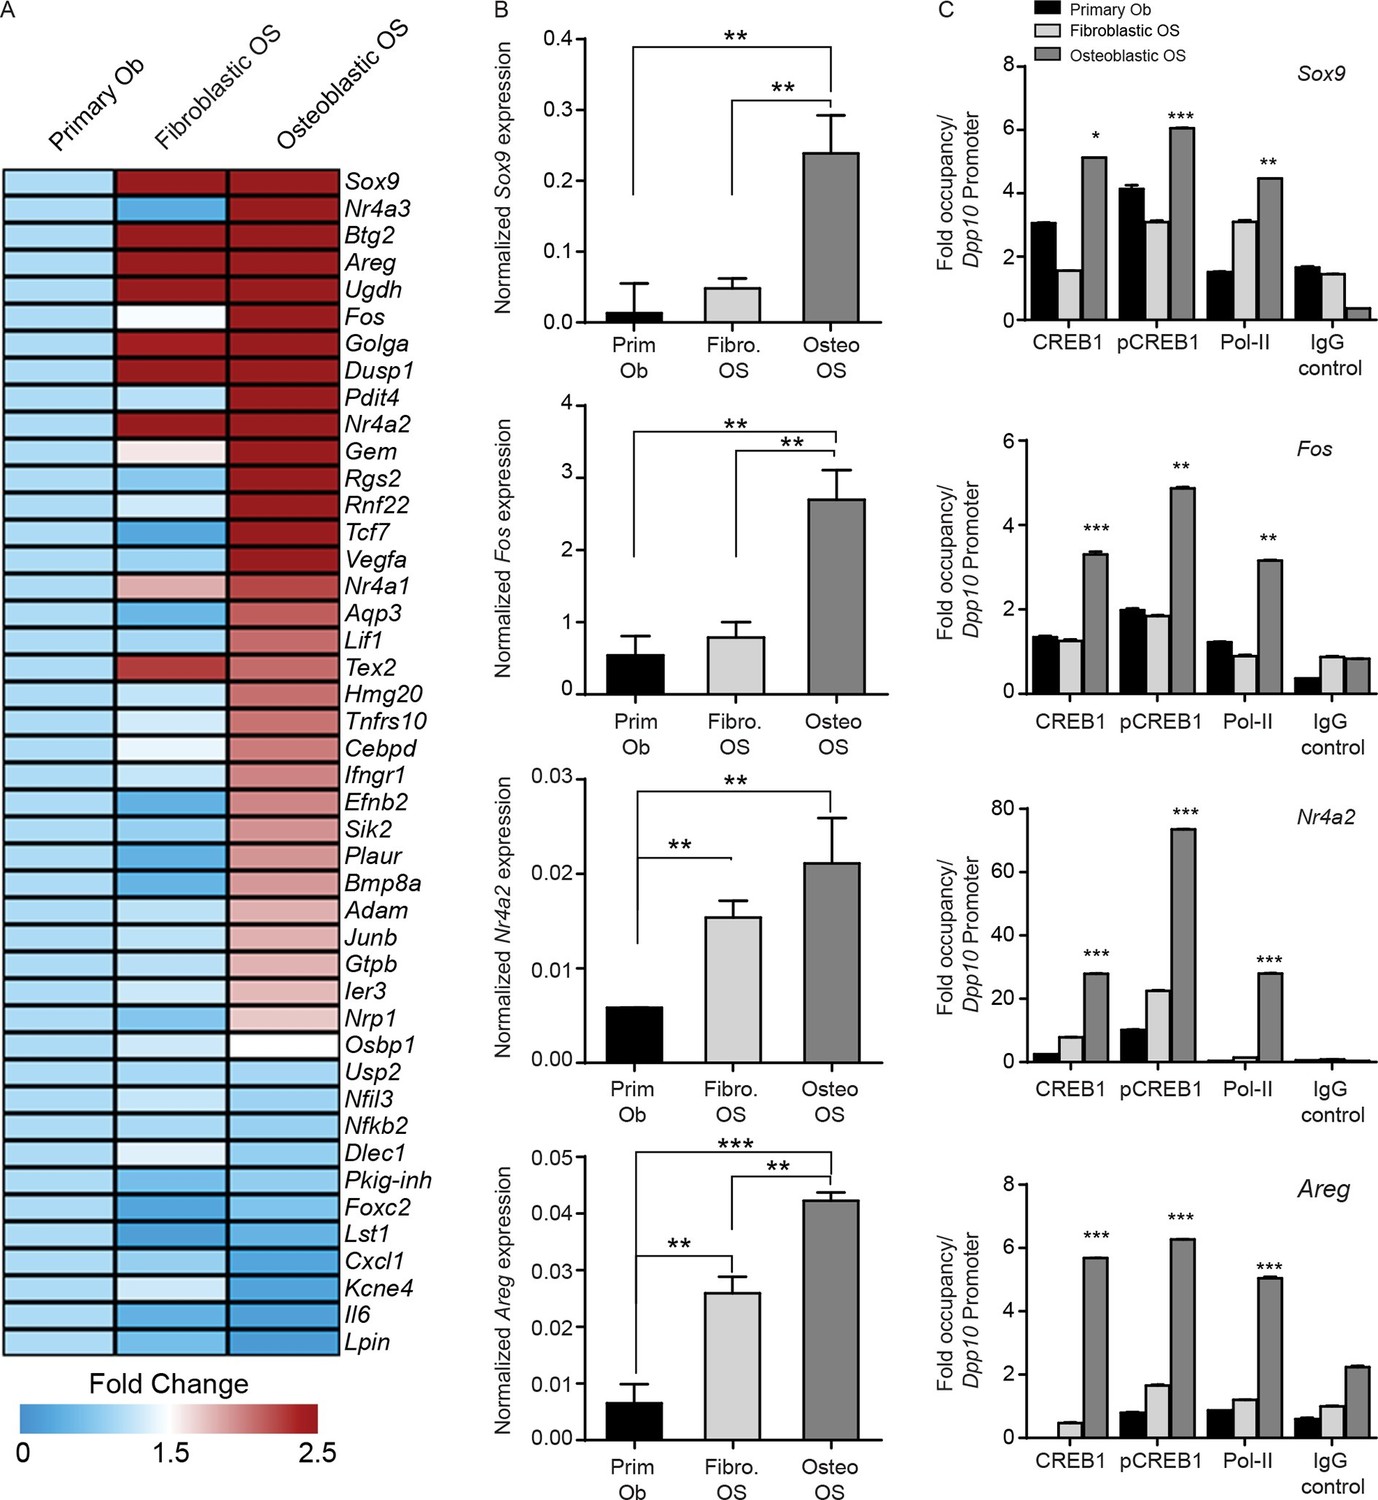
CREB1 signatures discriminate OS subtypes.
(A) Heat map of qPCR data. Expression of the PTHrP/CREB1 gene set between indicated cell types. Data from 3 independent cultures for each, expressed as fold change relative to primary osteoblasts. (B) Examples of CREB1 target gene expression between the indicated cell types. Expression levels normalized to β2m and depicted as relative expression ± SEM (n=3). (C) ChIP-qPCR for the indicated target genes from proliferating cells (no exogenous ligand/stimulus of cAMP applied) with CREB1, pCREB1 and pPolII. Data represented as fold occupancy relative to Dpp10 promoter, expressed as mean ± SEM. *p<0.05, **p<0.001, ***p<0.0001. See also Figure 6—figure supplement 1.
Figure 6—figure supplement 1

CREB1 defines OS subtypes by driving specific gene signatures.
(A, B, C) Expression of Creb1 signatures (upregulated, downregulated and unchanged) were assessed in mouse OS subtypes compared to primary osteoblast cells by qPCR. Expression normalized to β2m respectively. Data represents average relative expression ± SEM (n≥3). (D) ChIP experiments depicting the binding of CREB1, pCREB1 and Pol II on CREB1 target genes. Enriched DNA by ChIP was amplified using primers against the promoters of mentioned targets. Data is represented as fold occupancy calculated with respect to binding over a cold promoter DPP10.
Figure 7 with 1 supplement
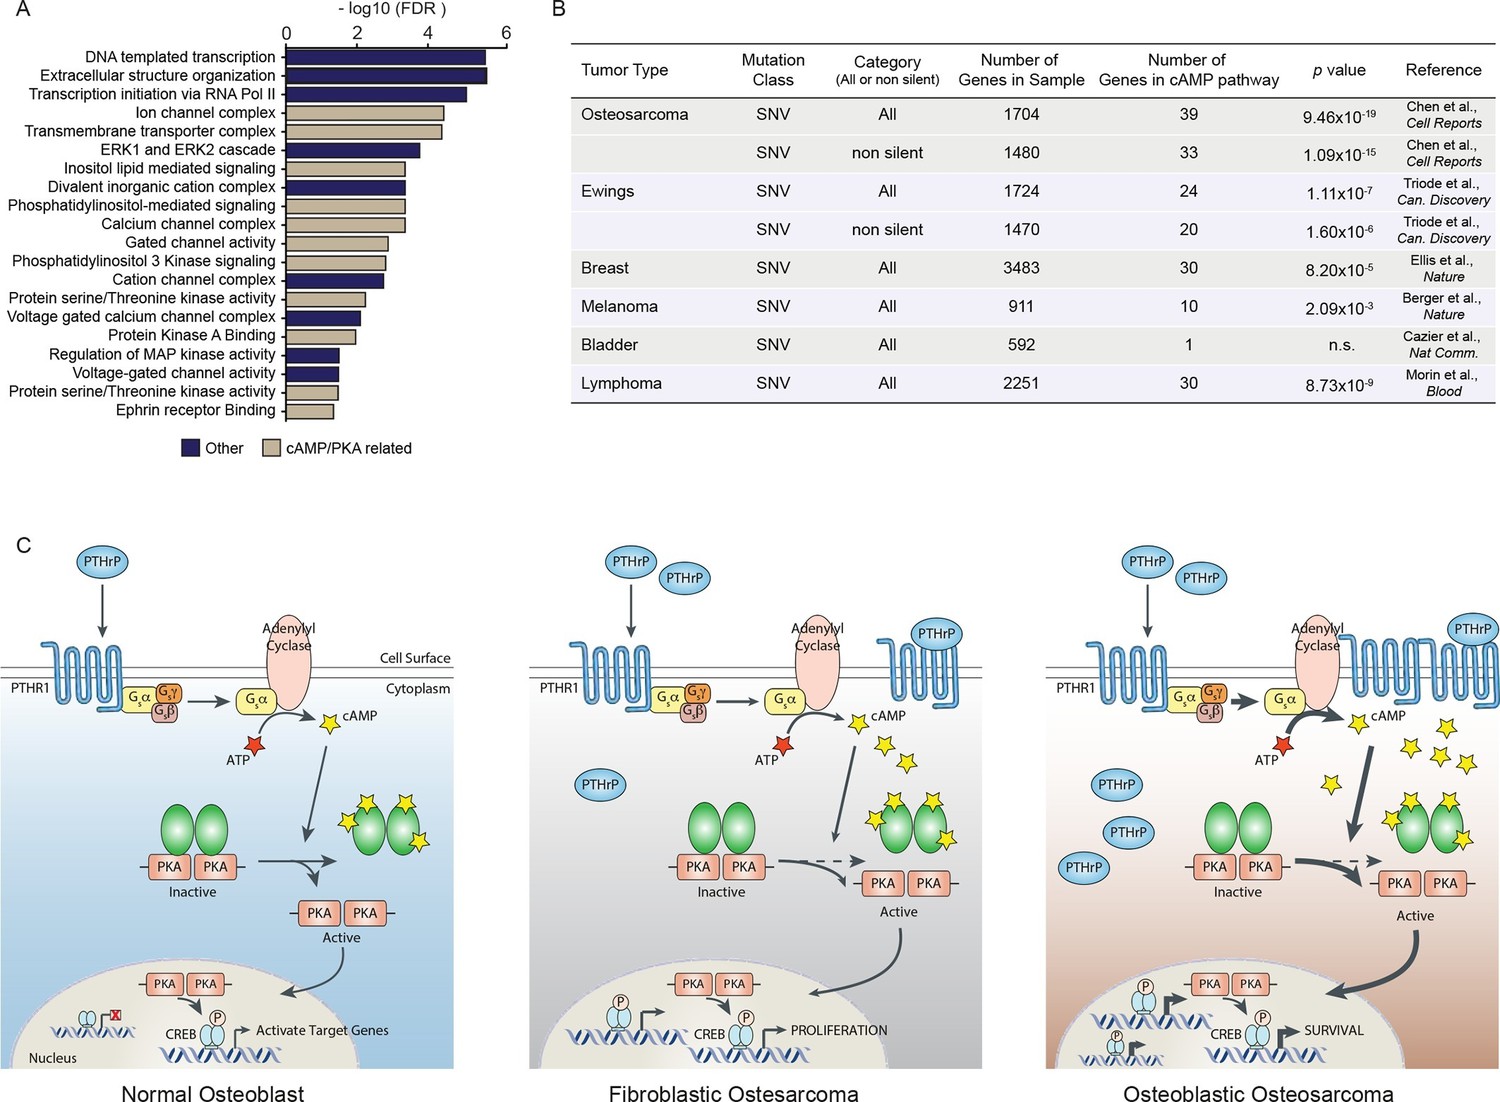
A high proportion of the cAMP interactome are somatic SNV mutations in human osteosarcoma.
(A) Analysis of functional pathways within the somatic SNV mutations of human OS using Cytoscape. Brown color indicates a cAMP related pathway, blue color indicates non cAMP related pathways. (B) Analysis of the enrichment for somatic SNV mutations within the cAMP interactome in each of the indicated tumor types. Based on somatic SNV mutations identified by whole genome sequencing. P value defined using hypergeometric distribution test. (C) Graphical summary of the differences between primary osteoblasts and OS subtypes regarding cAMP and CREB1 function. See also Figure 7—figure supplement 1.
Figure 7—figure supplement 1
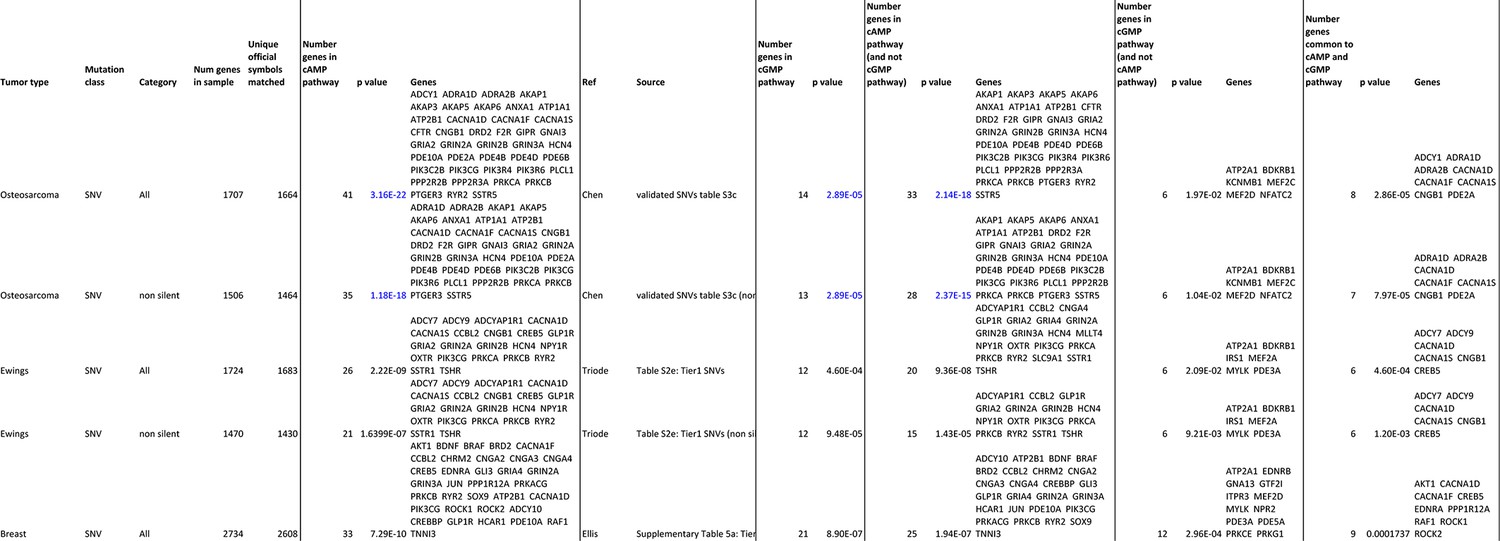
Analysis of cAMP and cGMP pathway enrichment of somatic SNV tumor mutations.
Table comparing the enrichment of somatic SNV tumor mutations within OS, Ewings and Breast cancer in the cAMP pathway, cGMP pathway and those unique to the cAMP and cGMP pathway respectively.
Tables
Table 1
Genes within the cAMP interactome that overlap with SNV mutations within human OS.
| cAMP int. | cAMP int. | cAMP int. | cAMP int. | Overlap(SNVs) |
|---|---|---|---|---|
| ABCC4 | CREB5 | MAP2K1 | ROCK1 | ADCY1 |
| ACOX1 | CREBBP | MAP2K2 | ROCK2 | ADRA1A |
| ACOX3 | DRD1 | MAPK1 | RRAS | ADRA2B |
| ADCY10 | DRD5 | MC2R | RRAS2 | AKAP1 |
| ADCY2 | EDNRA | MEK1 | SLC9A1 | AKAP3 |
| ADCY3 | EP300 | MEK2 | SOX9 | AKAP5 |
| ADCY4 | EPAC2 | MYL9 | SSTR1 | AKAP6 |
| ADCY5 | FFAR2 | NFAT2 | SSTR2 | ANXA1 |
| ADCY6 | FOS | NFATC | SUCNR1 | ATP1A1 |
| ADCY7 | FSH | NFATC1 | TIAM1 | ATP2B1 |
| ADCY8 | FSHR | NFKB1 | TNNI3 | CACNA1D |
| ADCY9 | FXYD1 | NFKBIA | TSHR | CACNA1F |
| ADCYAP1R1 | FXYD2 | NPY | VAV | CACNA1S |
| ADORA1 | GABBR | NPY1R | CFTR | |
| ADORA2A | GHRL | NR1C1 | DRD2 | |
| AF6 | GHSR | ORAI1 | F2R | |
| AKAP2 | GLI1 | OXTR | GIPR | |
| AKT | GLI3 | PACAPRI | GNAI3 | |
| AMH | GLP1R | PAK1 | GRIA2 | |
| ANPRA | GNAS | PKA | GRIN2A | |
| ARAP3 | GPR109 | PLCE | GRIN2B | |
| BAD | GPR119 | PLD1 | GRIN3A | |
| BDNF | GPR81 | PLN | HCN4 | |
| BRAF | GRIA1 | PPP1C | PDE10A | |
| CACNA1C | GRIA3 | PPP1R12A | PDE2A | |
| CALM | GRIA4 | PPP1R1B | PDE4B | |
| CAMK2 | GRIN1 | PTCH1 | PDE4D | |
| CAMK4 | GRIN2C | PTGER2 | PDE6B | |
| CHRM1 | GRIN2D | RAC1 | PIK3C2B | |
| CHRM2 | GRIN3B | RAC2 | PIK3CG | |
| c-Jun | HCN2 | RAC3 | PIK3R4 | |
| CNGA1 | HHIP | RAF1 | PIK3R6 | |
| CNGA2 | HTR1 | RAP1A | PPP2R2B | |
| CNGA3 | HTR4 | RAP1B | PPP2R3A | |
| CNGA4 | HTR6 | RAPGEF3 | PRKCA | |
| CNGB1 | JNK | RAPGEF4 | PRKCB | |
| CNGB3 | JUN | RELA | PTGER3 | |
| CREB1 | KAT3 | RHOA | RYR2 | |
| CREB3 | LIPE | VIPR2 | SSTR5 |
Table 2
Oligonucleotide sequences used in RT-PCR.
| Gene | Forward primer | Reverse primer |
|---|---|---|
| Kcne4 | GTTATGTCCTTCTATGGCGTTTTC | ATCATAGGTAGCGGCTTCATAGC |
| Il6 | AACAAGAAAGACAAAGCCAGAGTC | CTCCAGCTTATCTGTTAGGAGAGC |
| Cxcl1 | TCATAGCCACACTCAAGAATGGT | TTTGGACAATTTTCTGAACCAAG |
| Dusp1 | TCACGCTTCTCGGAAGGATA | TGATGTCTGCCTTGTGGTTG |
| Nfil3 | GAGAAGAAAGACGCCATGTATTG | AGCTCAGCTTTTAAAGTGGCATT |
| Usp2 | CTGAAGCGCTATACAGAATCGTC | AAACCAAGTTTTTCCTTCTCCAG |
| Gem | TGGGAGAAGATACATATGAGCGTA | GAGTAGACGATCAGATAGGCATCC |
| Foxc2 | GCCAGAGAAGAAGATCACTCTGA | CACTTTCACGAAGCACTCATTG |
| Efnb2 | GGGGTCTAGAATTTCAGAAGAACA | ATCTTGTCCAACTTTCATGAGGAT |
| Btg2 | GCTGTATCCGTATCAACCACAAG | GATGCGGTAAGACACTTCATAGG |
| Ddit4 | TTTCAGTTGACCCTGGTGCT | GATGACTCTGAAGCCGGTACTTAG |
| Lif | ACCTTGAGAAAATCTACCGAGAAGT | AAAAATTTCTCCATTTTTGGCATA |
| Plaur | ACAGAGCACTGTATTGAAGTGGTG | GAAAGGTCTGGTTGCTATGGAA |
| Nrp1 | TACCCTCATTCTTACCATCCAAGT | CCACGTAGTCATACTTGCAGTCTC |
| Nfkbiz | TAAACATCAAGAATGAGTGCAACC | GTTGGTATTTCTGAGGTGGAGAGA |
| Ifngr1 | GTGGGGAGATCCTACATACGAA | CTTGCCAGAAAGATGAGATTCC |
| Rnf122 | GTCTTCATGCTTAGCCTCATCTTC | CAGGTCCCATAGAGCTGTAACTTC |
| Ugdh | CCTTCCTATTTATGAGCCTGGATT | CCATATGTTTTTGTTGGTGTGTTC |
| Osbpl9 | GTGTTAGCTACCTTGGGACATCAT | AGAACTCTGGGACTGTATTTGGAG |
| Ier3 | AATTTTCACCTTCGACCCTCTC | TTGGCAATGTTGGGTTCC |
| Cebpd | TCCTGCCATGTACGACGAC | TGTGGTTGCTGTTGAAGAGGT |
| Vegfa | GAAACCATGAACTTTCTGCTCTCT | ACTTGATCACTTCATGGGACTTCT |
| Sox9 | AGAAGGAGAGCGAGGAAGATAAGT | CTTGACGTGTGGCTTGTTCTT |
| Fos | GCTATCTCCTGAAGAGGAAGAGAAA | AACGCAGACTTCTCATCTTCAAGT |
| Nr4a3 | GGTGCAGAAAAATGCAAAATATG | CTGTCTGTACGCACAACTTCCTTA |
| Dusp1 | TCACGCTTCTCGGAAGGATA | TGATGTCTGCCTTGTGGTTG |
| Sik2 | ACCTTGAGAAAATCTACCGAGAAGT | AAAAATTTCTCCATTTTTGGCATA |
| Junb | CATCAACATGGAAGACCAGGA | GTTCTCAGCCTTGAGTGTCTTCA |
| Gtpbp10 | CCAAGTGCTAGGAGAACTCAATAAA | GCTATGACTTTTAGGTCAAGGTGAA |
| Adamts1 | GACCAGGAAGCATAAGGAAGAAG | CGAGAACAGGGTTAGAAGGTAATG |
| Bmp8a | CTGAGTTCCGGATCTACAAAGAAC | AGCGTCTGAAGATCCAAAAAGA |
| Lst1 | ACAACCAATGATTTCCTGCTAAAT | AGATGAACAGGATGATGACAAGC |
| Dlec1 | TCTAGACAGCAAGTTAATGCGAAA | ACAGCTAAACGTCAGCTTTGAAC |
| Tnfrsf12a | GCTGGTTTCTAGTTTCCTGGTCT | GTCTCCTCTATGGGGGTAGTAAACTT |
| Golga3 | AAAAAGAACTCCAAATCAAGCAAG | CCTCAGACACAACTGAAGTGCTAC |
| Tcf7 | TTTCTCCACTCTACGAACATTTCA | CCTGAGGTCAGAGAATAAAATCCA |
| Aqp3 | ATCAACTTGGCTTTTGGCTTC | GCATAGATGGGCAGCTTGAT |
| Hmg20b | CTTTGTAGTGGCTGTCAAGCAG | CATTTGGGAGAATCTTCTTTCTTTT |
| Tex264 | GTCTACTATGACAACCCCCATACG | GAAGGAGAATATCTTGAAGCCAAA |
| Creb1 | CAAGTCCAAACAGTTCAGATTTCA | TGGTGCATCAGAAGATAAGTCATT |
| Id1 | GGTGAACGTCCTGCTCTACG | AGACTCCGAGTTCAGCTCCA |
| Dsip1 | GGTGAACGTCCTGCTCTACG | AGACTCCGAGTTCAGCTCCA |
| Rgs2 | GTCCTCAAAAGCAAGGAAAATCTA | CATCAAACTGTACACCCTCTTCTG |
| Nr4a1 | CTCCTCCACGTCTTCTTCCTC | CAGGGACTGCCATAGTACTCAGA |
| Areg | CACAGGGGACTACGACTACTCAG | TCTTCCTTTTGGGTTTTTCTGTAG |
| Nr4a2 | ACTGAAATTACTGCCACCACTTCT | TGTGCATCTGAATGTCTTCTACCT |
| Pepck | AGTGAGGAAGTTCGTGGAAGG | GCCAACAGTTGTCATATTTCTTCA |
| Bnip3l | GTCTCTAAGCATGAGGAAGAGTGG | AGAAGGTGTGCTCAGTCGTTTT |
Table 3
Primers for promoter regions for ChIP and antibody conditions.
| Gene promoter | Forward primer | Reverse primer | |
|---|---|---|---|
| Nr4a2 | CTGCCAACATGCACCTAAAGT | CTTAAAATCAGCCCCAGTCGT | |
| Nr4a1 | TTCTGTTTCTAGGGACAGTGCAT | ACCCTACTCCAAGAGCTATCCTTT | |
| Cga | CTCTTCATAAGCTGTCCTTGAGGT | GGTAAATTCTACCCAGTGATTGGA | |
| Areg | TGATAACTAAGGAAACTGAGGTCCA | TTTGGAGAGGGAAAAATAAAATCA | |
| Dpp10 | AAGATCAGGGACTGTGGTACTGA | GGAATAGTGCATGTTTCCTTCTG | |
| Cebpd | CACGGTTCACTAGTTCTGGTCTC | CTGGAGCGAAATGAAAATCTG | |
| Ifgnr1 | CTATGGTTTCCAGGAGCTTCAGT | AACTTCAGTTTGAACATGCACCT | |
| Rnf22 | CTATGGTTTCCAGGAGCTTCAGT | AACTTCAGTTTGAACATGCACCT | |
| Gem | AAGCCCTTTTTGTACAAGTGTGA | GAGTGGGACAGTTTCTGTTTGAG | |
| Foxc2 | TTATCCATCACTGCATTCAACAG | AGTAGGAAAGAGCCTGGAGATTTT | |
| Fos | GGTGCATACAGGAAGACATAAGC | GCAAAAGTCCTGAAACAAAACAA | |
| Jun | AGCAAAGATTAGCAAAGGGAAAG | CCAACTTTGAATCTGACAACTCC | |
| Sox9 | AGCAAAGATTAGCAAAGGGAAAG | CCAACTTTGAATCTGACAACTCC | |
| Vegfa 1 | GGGTGATGATAACAACAATTTGG | GAATATGGGCACAACAATTCAGT | |
| Vegfa 2 | ATTTGAGGGAGTGAAGAACCAAC | AGTCTGTGCTCTGGGATTTGATA | |
| Aqp3 | AGTCAAGGGTCATAGCTCCAGAT | TGGACCCAGAAGTGAGTTTCTAA | |
| Plaur | CCTCAAAGGCTTTCTGTAGGAAT | AGGGGAAAAACAAGTTGAAAGAG | |
| Tnfrs12a | GTTGTGTCTGCCCCTCAAGT | TTGCCCTATCTCTGGGTCTG | |
| Il6 | TCCTTTCCTGTCTGGAAGATACA | GGCAAAGAGATAAGGAAAAAGGA | |
| Ab directed against | Cell number per ChIP | Amount | Origin of Ab |
|---|---|---|---|
| Creb1 | 6x10⁶ | 2 μg | Abcam (ab31387) |
| Phospho-Creb1 | 6x10⁶ | 2 μg | Cell Signaling (#9198) |
| Pol II (phospho-S2) | 2x10⁶ | 2 μg | Abcam (ab103968) |
Download links
A two-part list of links to download the article, or parts of the article, in various formats.
Downloads (link to download the article as PDF)
Open citations (links to open the citations from this article in various online reference manager services)
Cite this article (links to download the citations from this article in formats compatible with various reference manager tools)
Activation of PTHrP-cAMP-CREB1 signaling following p53 loss is essential for osteosarcoma initiation and maintenance
eLife 5:e13446.
https://doi.org/10.7554/eLife.13446


