Proteotoxicity from aberrant ribosome biogenesis compromises cell fitness
- Harvard Medical School, United States
- Harvard University, United States
- Princeton University, United States
- Whitehead Institute for Biomedical Research, United States
- University of Chicago, United States
Figures
Figure 1 with 2 supplements
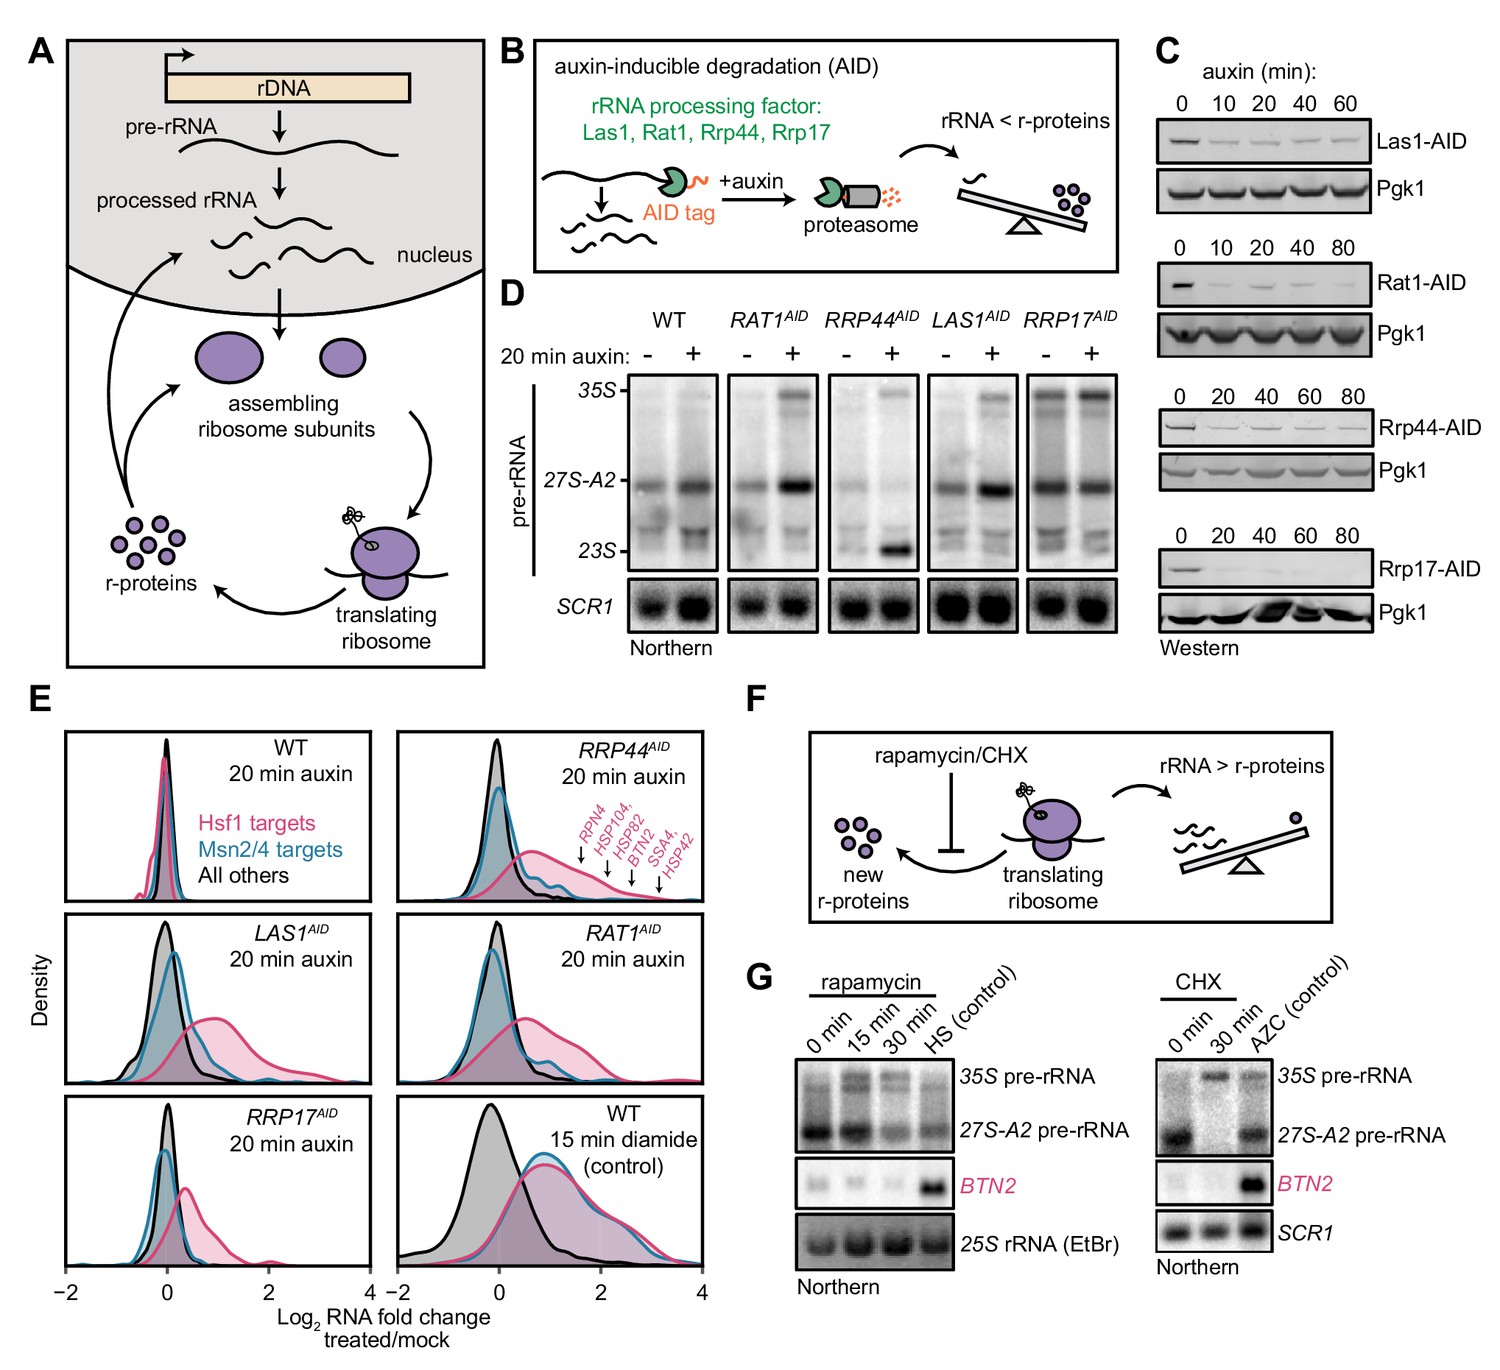
Imbalanced rRNA:r-protein synthesis elicits upregulation of proteostasis machinery via Heat-Shock Factor 1 (Hsf1).
(A) Brief schematic overview of ribosome biogenesis. (B) Auxin-inducible degradation (AID) of rRNA processing factors. The C-terminus of the protein is genetically tagged with the AID tag (IAA7-V5) in cells co-expressing the E3 ligase adapter OsTIR1. Addition of auxin allows recognition and degradation of AID-tagged proteins by the proteasome. (C) Depletion of AID-tagged rRNA processing factors following addition of auxin (100 μM) detected by anti-V5 immunoblot. (D) Pre-rRNA accumulation following rRNA processing factor depletions. RNA from mock and auxin (20 min) treated cells was analyzed by Northern blot with a probe (800, see Supplementary file 3) that recognizes full-length pre-rRNA (35S) and processing intermediates (27S-A2 and 23S) (Kos-Braun et al., 2017). (E) Upregulation of Hsf1 targets in rRNA processing factor-depleted cells. RNA-seq density plots of log2 fold change after 20 min auxin treatment (versus mock-treated control), determined from n = 2 biological replicates. Hsf1 targets, n = 42; Msn2/4 targets, n = 207; all others, n = 4912. The oxidative agent diamide (15 min, 1.5 mM) was used as a comparative control. The WT strain treated with auxin also expressed OsTIR1 but lacked any AID-tagged factor. (F) Schematic illustrating that rapamycin and CHX treatment acutely shutdown r-protein synthesis ahead of rRNA synthesis leading to an imbalance in ribosome components. (G) Northern blots of pre-rRNA and Hsf1-dependent BTN2 from WT cells treated with rapamycin (200 ng/ml) or cycloheximide (CHX, 200 μg/ml) for the indicated times. Heat shock (HS, 37°C, 15 min) and azetidine-2-carboxylic acid (AZC, 10 mM, 30 min) were used as positive controls for Hsf1 activation.
Figure 1—figure supplement 1

Kinetics of Hsf1 activation.
(A) Absorbance profiles of sucrose gradients (10–50%) of extracts from RAT1AID cells mock or auxin treated for 20 min. Shown are two biological replicates. (B) ChIP-qPCR data of Hsf1 at the indicated promoter region of cells untreated, auxin treated, or heat shocked (37°C) for 20 min. Bar height indicates the average and error bars the standard deviation of n = 3 biological replicates. (C) Rat1 anchor-away cells (see also Figure 1—figure supplement 2) were depleted of Rat1 by rapamycin treatment (1 μg/ml, 40 min) or heat shocked for 20 min. Deletion of RQC2 did not alter the activation of the Hsf1 targets HSP82 and BTN2. Shown are two biological replicates. (D) WT or the indicated AID-tagged strains were treated with auxin for the indicated times and accumulation of Hsf1 targets HSP82 and BTN2 and Msn2/4 target HSP12 was followed by Northern blot. As a control for Hsf1 and Msn2/4 activation, RNA from WT cells untreated (unt) or treated with diamide (dia, 1.5 mM, 20 min) was included on each blot. RNA was from the same cells used in Figure 1C to allow direct comparison. (E) RNA from (D) was probed for pre-5.8S rRNA species (probe 017 (El Hage et al., 2008)). Note that the BTN2 blot is the same as in (D) and is included for comparison of kinetics.
Figure 1—figure supplement 2

Specificity of Hsf1 activation by depletion of rRNA processing factors.
(A) RTT103AID and DXO1AID cells were treated with auxin for the indicated times and assayed for accumulation of Hsf1 targets by Northern. RNA from RAT1AID was included as a positive control. Western blots (below) show depletion of AID-tagged proteins. This experiment was not repeated. (B) XRN1AID cells were treated with auxin for the indicated time and the indicated RNAs detected by Northern. Consistent with the role of Xrn1 in RNA turnover, known target transcripts modestly accumulated during the time course of Xrn1 depletion. GAL10 and GAL10-lncRNA are established Xrn1 substrates (Cloutier et al., 2013) that accumulate with kinetics similar to those of Hsf1- (BTN2 and HSP82) and Msn2/4-dependent transcripts (TPS2 and HSP12). Thus, these RNAs accumulated in the absence of normal Xrn1-mediated decay. (C) Fluorescence micrographs of Rat1-FRB-GFP and Nrd1-FRB-GFP at indicated time points after rapamycin (1 µg/ml) addition. Nuclei were stained with DAPI. Cell co-express Rpl13a-2xFKBP12 as an anchor and harbor the tor1-1 mutation, rendering Tor1 insensitive to rapamycin. Addition of rapamycin induces dimerization of FRB-tagged protein to the anchor and rapid nuclear export during export of Rpl13a. (D) Schematic of Hsf1 activity reporter transgene HSE-GFP consisting of GFP driven by four repeats of the Hsf1-binding site (Heat Shock Element, HSE). (E) Northern blot for HSE-GFP after rapamycin treatment for the indicated time or heat shock (HS, 37°C, 20 min) as a control. (F) Northern blot for Hsf1-dependent gene HSP82 from wild-type or anchor-away strains untreated, treated for 45 min with rapamycin (1 µg/ml), or 45 min rapamycin followed by 20 min diamide (1.5 mM). Nrd1 is a nuclear non-coding RNA transcription termination factor.
Figure 2 with 3 supplements

Orphan r-proteins are sufficient to activate the Hsf1 regulon.
(A) Schematic describing that diazaborine (DZA) inhibits Drg1, preventing r-protein assembly into pre-60S subunits. (B) Kinetics of Hsf1 activation following DZA treatment. Northern blot of Hsf1-dependent BTN2 and HSP82 and Msn2/4-dependent HSP12 transcripts from cells treated with DZA (15 μg/ml) for the indicated time. Diamide (1.5 mM) was used as a positive control for Hsf1 and Msn2/4 activation. (C) Upregulation of Hsf1 targets in DZA-treated cells. RNA-seq density plots of log2 fold change after 15 or 45 min DZA treatment (versus DMSO-treated control), determined from n = 2 biological replicates. (D) Upregulation of proteasome subunits during RPAS. Swarm plot of log2 fold change after 15 or 45 min DZA or 15 min diamide treatment for transcripts encoding proteasome subunits (n = 27). (E) Schematic describing how escortins Tsr2, Yar1, and Sqt1 chaperone newly synthesized Rps26, Rps3, and Rpl10, respectively, to assembling ribosomes. (F) Western blots showing depletion of AID-tagged Tsr2, Yar1, and Sqt1 and Northern blots for Hsf1-dependent BTN2 and HSP82 and Msn2/4-dependent HSP12 transcripts at the indicated time after auxin addition. Unt, untreated; HS, heat shock.
Figure 2—figure supplement 1
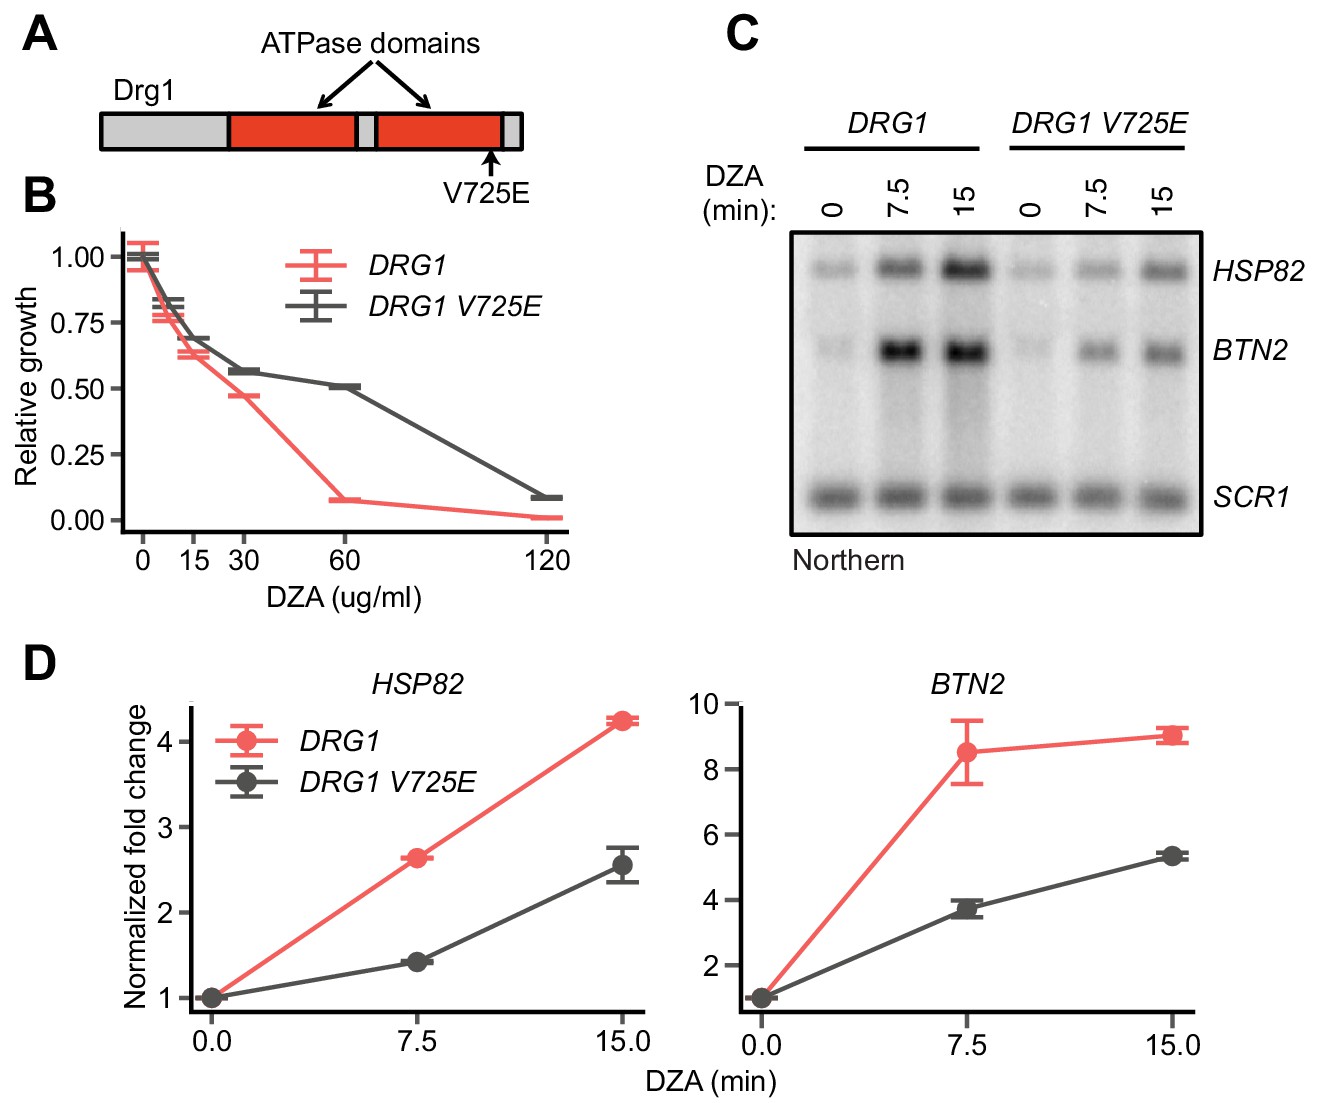
On-target inhibition of Drg1 by DZA.
(A) Schematic of the yeast Drg1 protein, with the two ATPase domains shown in red. The V725E mutation in the second ATPase domain confers DZA resistance (Loibl et al., 2014). (B) Growth of WT and DRG1 V725E strains after 24 hr in the indicated concentration of DZA relative to vehicle-only controls. Line indicates the average and error bars the range of n = 2 biological replicates. (C) Northern blot for Hsf1 target genes in WT and DRG1 V725E cells treated with DZA (15 µg/ml) for the indicated times. (D) Quantification of Northern blots for the indicated Hsf1 target transcripts, normalized against SCR1. Line indicates the average and error bars the range of n = 2 biological replicates.
Figure 2—figure supplement 2
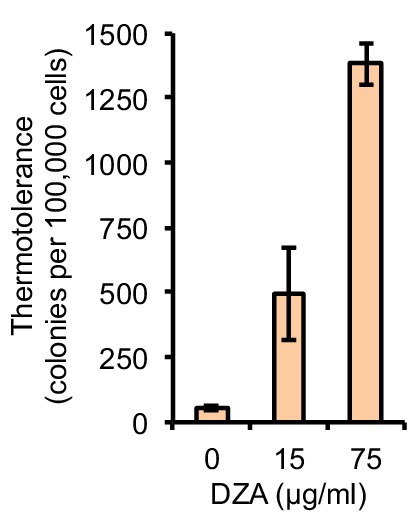
DZA treatment enhances thermotolerance.
WT cells treated with the indicated concentration of DZA for 45 min were exposed to 50°C HS for 15 min. Colony forming units were determined by plating approximately 100,000 cells. Bar height indicates the average and error bars the standard deviation of n = 3 biological replicates.
Figure 2—figure supplement 3
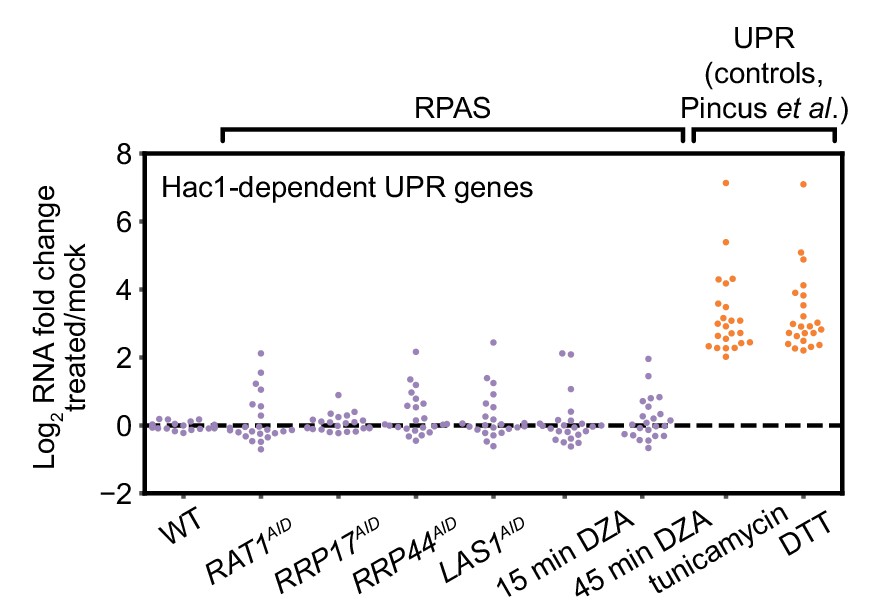
The endoplasmic reticulum unfolded protein response (UPR) is not activated during RPAS.
Swarm plot of log2 fold change of Hac1-dependent UPR transcripts in the condition indicated on the x-axis (n = 23). RNA-seq data for cells treated with tunicamycin (5 µg/ml, 4 hr) and dithiothreitol (DTT, 5 mM, 4 hr), established inducers of the UPR, are from Pincus et al. (2014).
Figure 3

Compromised r-protein gene expression and translational output during RPAS.
(A) Swarm plot of log2 fold change of r-protein encoding transcripts in the condition indicated on the x-axis (n = 136). (B) Swarm plot of log2 fold change of transcripts encoding ribosome biogenesis (RiBi) factors, excluding r-protein genes, in the condition indicated on the x-axis (n = 169). (C) Schematic of transgene system for estradiol-inducible expression of V5-tagged ORFs. (D) Western blot showing time-course of induction of Rps3-V5 after the indicated time of beta-estradiol (100 nM) addition. (E) Strains containing the indicated V5-tagged transgene were induced for 10 min with estradiol and then treated with vehicle (-) or 15 μg/ml DZA (+) for 20 min and analyzed by western blot (upper) and quantified relative to vehicle control (lower). Bar height indicates the average and error bars the standard deviation of n = 3 biological replicates. The dashed line corresponds to the hypothetical maximal reduction amount (to 80% of control) in protein produced as a result of ribosome dilution alone in 20 min (one fourth of a cell cycle). (F) WT cells were treated with vehicle (DMSO) or DZA for 15 or 45 min and analyzed by western blot. Rapamycin (rap, 200 ng/ml, 45 min) was used as a positive control for altering Gcn2 and TORC1 activity (Dever et al., 1992; González et al., 2015).
Figure 4 with 2 supplements
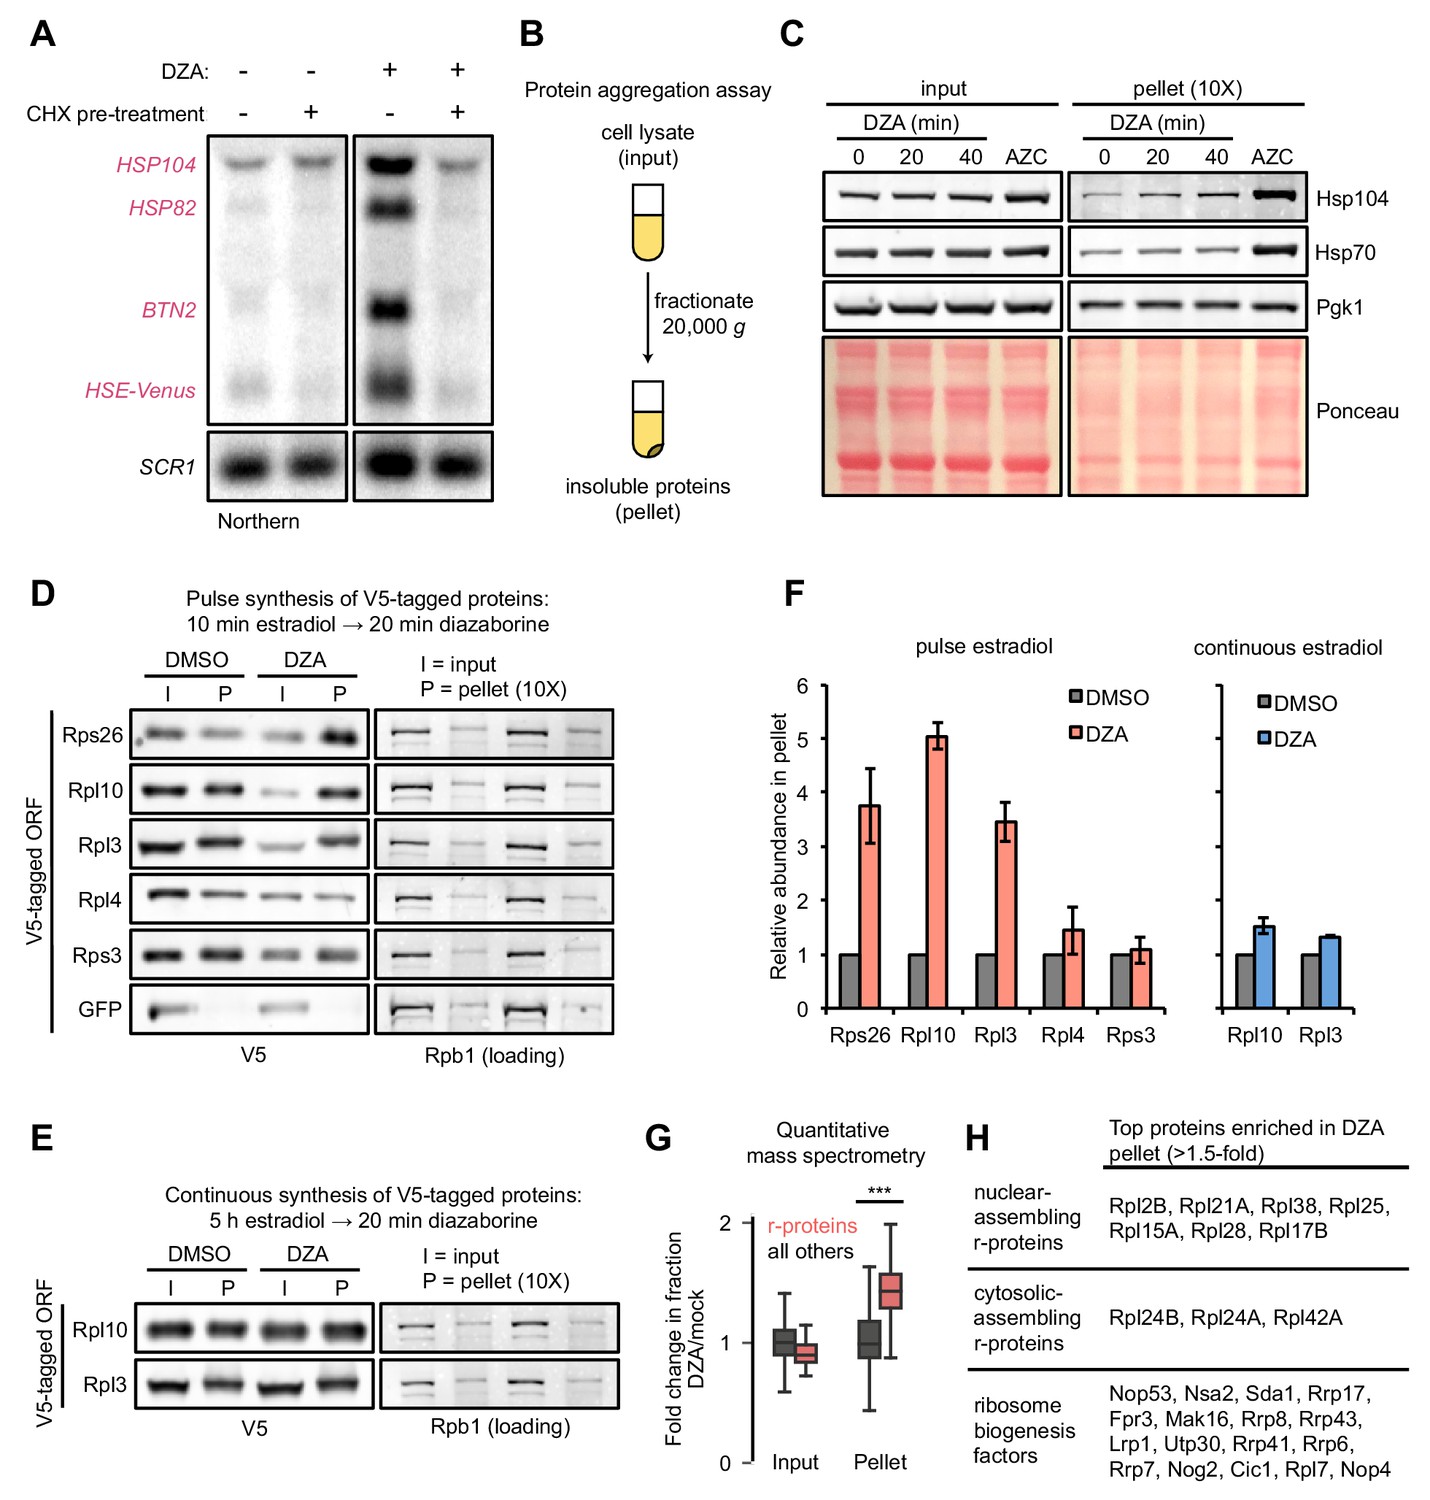
Aggregation of orphan r-proteins during RPAS.
(A) Cells were mock or CHX (200 μg/ml) treated for 3 min prior to addition of DZA for 20 min and Hsf1 target were detected by Northern blot. HSE-Venus, Venus transgene downstream of four Hsf1-binding sites (Heat Shock Element, HSE). (B) Schematic of the protein aggregation assay. Proteins extracted from cryogenically lysed cells were fractionated by centrifugation at 20,000 g for 20 min to pellet insoluble proteins. (C) Cells were treated with DZA for 0, 20, or 40 min. Input and insoluble proteins (pellet) were resolved by SDS-PAGE. AZC (10 mM, 40 min) was used as a control to compare DZA results to a general increase in aggregates in the pellet, by Ponceau staining, and Hsp70 and Hsp104 sedimentation. 10X more of the pellet sample than input sample was loaded to increase sensitivity. (D) Strains expressing the indicated V5-tagged r-protein (or GFP as a control) were induced for 10 min with estradiol followed by vehicle (DMSO) or DZA treatment for 20 min. Input and pellet samples for all were analyzed by Western blot. 10X more of the pellet sample than input sample was loaded to increase sensitivity. (E) Same as (D), except cells were continuously induced for 5 hr with estradiol to label the mature protein pool prior to DMSO or DZA treatment. (F) Quantification of the indicated V5-tagged proteins in the pellet fraction versus the input (from panels D and E), normalized to the pellet to input ratio of Rpb1. The ratio was set to one for DMSO-treated cells. Bar height indicates the average and error bars the range of n = 2 biological replicates. (G) Box plot depicting results of quantitative mass spectrometry on proteins that pellet following 20 min mock (DMSO) or DZA treatment. Fold change (DZA/mock) of each protein was calculated for input and pellet fractions and r-proteins (pink) were compared to all other proteins (grey). ***, p-value<0.0001 (Wilcoxon rank-sum test). (H) List of r-proteins that assemble in the nucleus and cytosol (Woolford and Baserga, 2013) and ribosome biogenesis factors with greatest increase in abundance in the pellet fraction (>1.5 fold in two biological replicates) detected in DZA-treated cells by mass spectrometry (data as in 4G). See Supplementary file 6 for full dataset.
Figure 4—figure supplement 1
Aggregation of orphan r-proteins during RPAS.
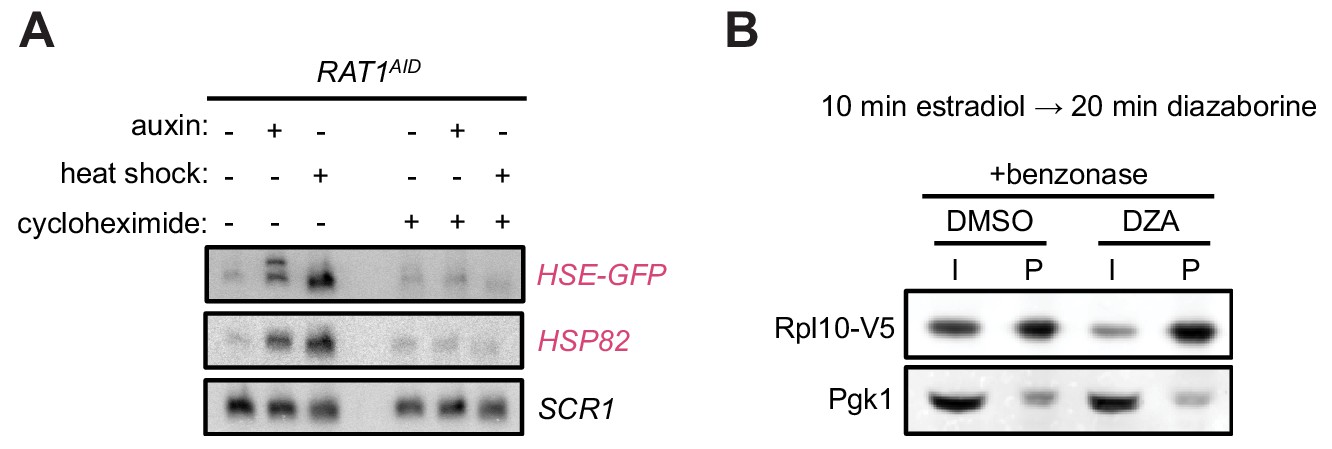
(A) RAT1AID cells were mock or CHX (200 µg/ml, 3 min) treated before addition of auxin or heat shock (37°C) for 20 min. Northern was performed for the Hsf1 reporter transgene HSE-GFP consisting of GFP downstream of four Hsf1-binding sites (Heat Shock Element, HSE), and HSP82. (B) Treating extracts with benzonase does not prevent the aggregating behavior of newly synthesized Rpl10 when treated with DZA. Experiment was performed as in Figure 4 except extracts contained benzonase to degrade RNA and DNA.
Figure 4—figure supplement 2
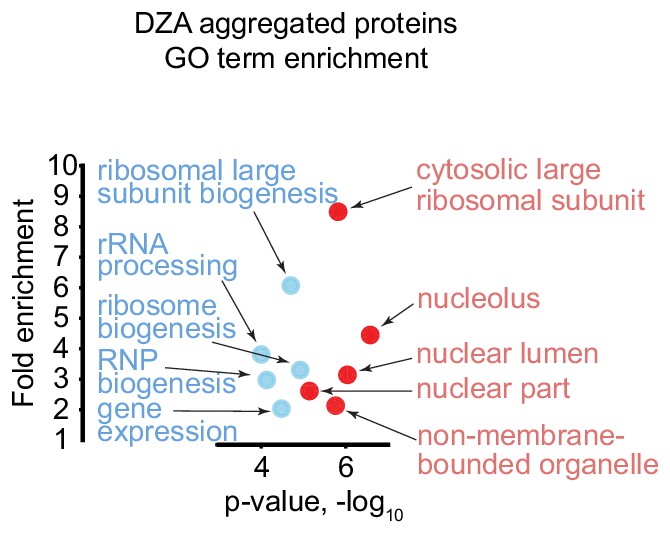
Gene ontology analysis of top aggregating proteins in DZA-treated cells detected by mass spectrometry.
Gene ontology (GO) term enrichment for aggregated proteins (>1.5 fold in two biological replicates, n = 51) detected in DZA-treated cells by mass spectrometry (data as in Figure 4). Shown are the top five terms for the ‘Process’ (blue) and ‘Component’ (red) categories with p-value and the fold enrichment relative to all proteins detected (n = 2491).
Figure 5
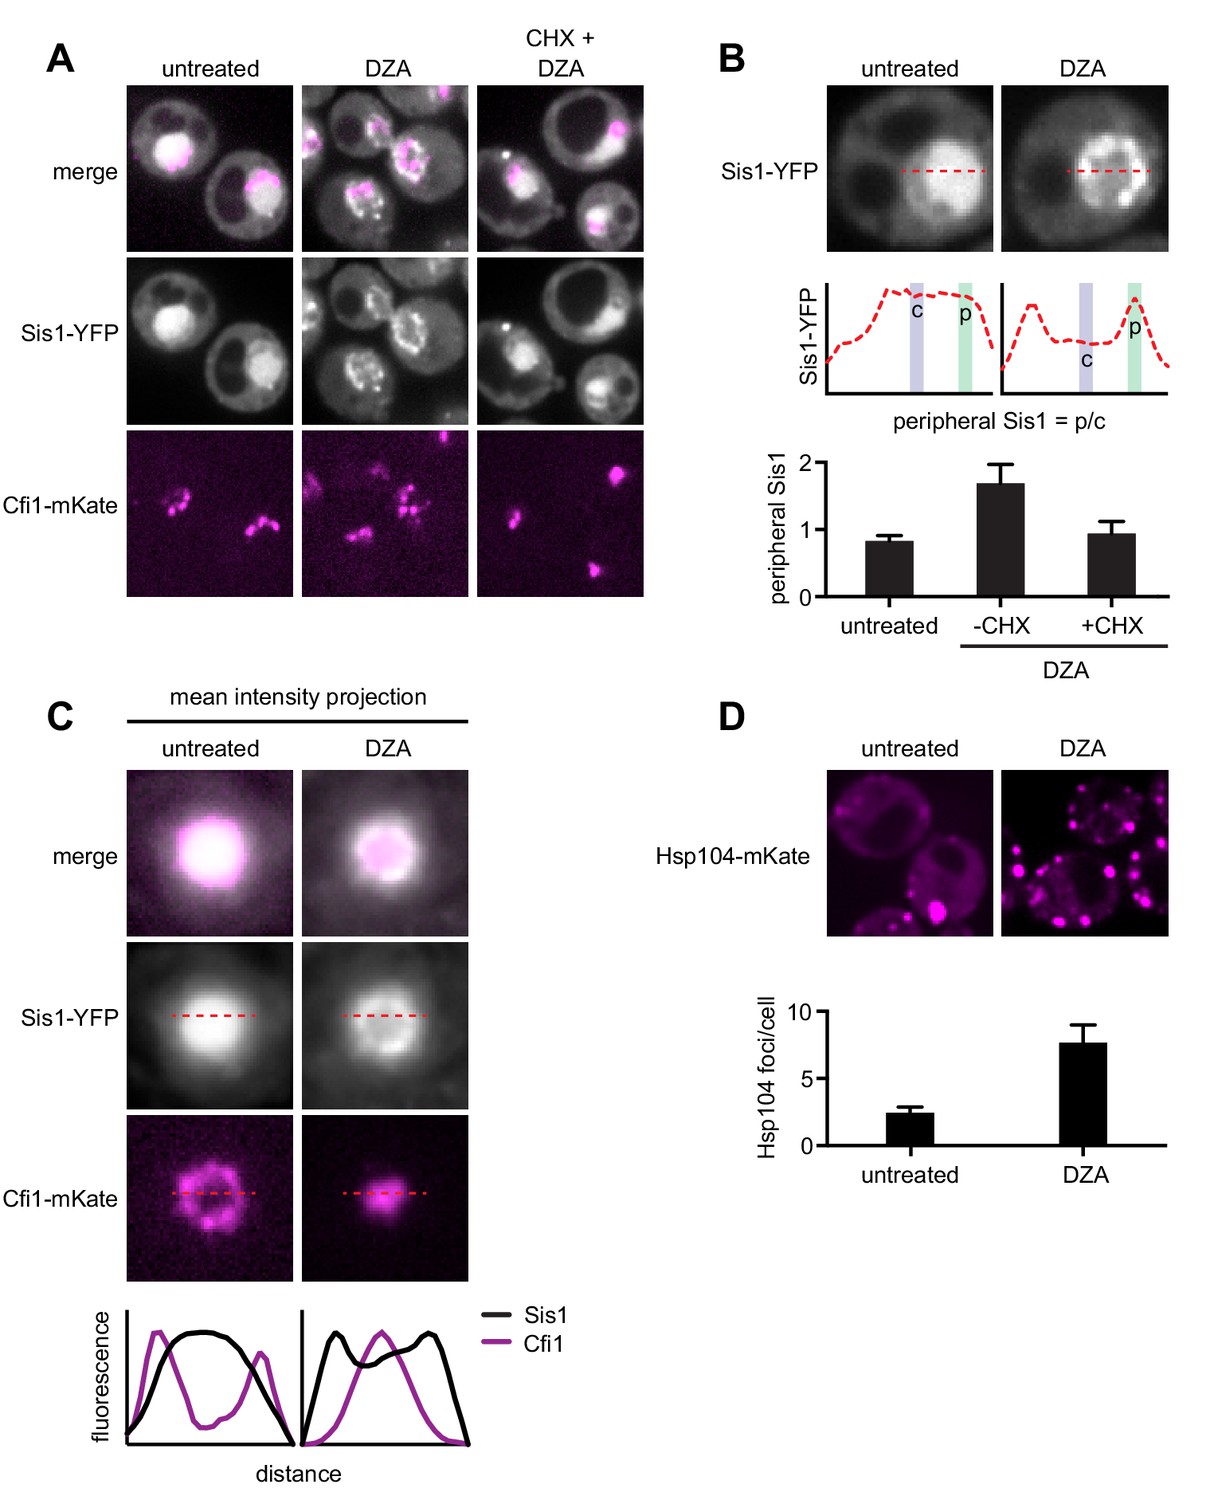
RPAS disrupts nuclear and cytosolic proteostasis.
(A) Fluorescence micrographs of cells expressing Sis1-YFP and the nucleolar marker Cfi1-mKate after treatment with DZA (5 μg/ml, 30 min) with or without pre-treatment with CHX (200 μg/ml, 5 min). (B) Quantification of Sis1 relocalization to the nuclear periphery was done via fluorescence line scans and computed as the ratio of Sis1 signal at the periphery (p) versus the center (c) of the nucleus (n > 30 cells per condition). (C) Image segments (50 pixels) centered on the middle of the nucleus were extracted in both the Sis1-YFP and Cfi1-mKate channels for individual cells (n = 25 cells for both conditions). Images were stacked and average intensity was projected. The Cfi1 ring under control conditions results from the composite of images: in most cells it appears localized to one side, but always at the periphery of the nucleus. Fluorescent line scans quantify the localization patterns. (D) Micrographs of cells expressing Hsp104-mKate were imaged live in untreated conditions or after DZA treatment (5 μg/ml, 30 min). Below micrographs, quantification of number of Hsp104 foci and Sis1 peripheral localization (n > 30 cells/condition).
Figure 6 with 2 supplements
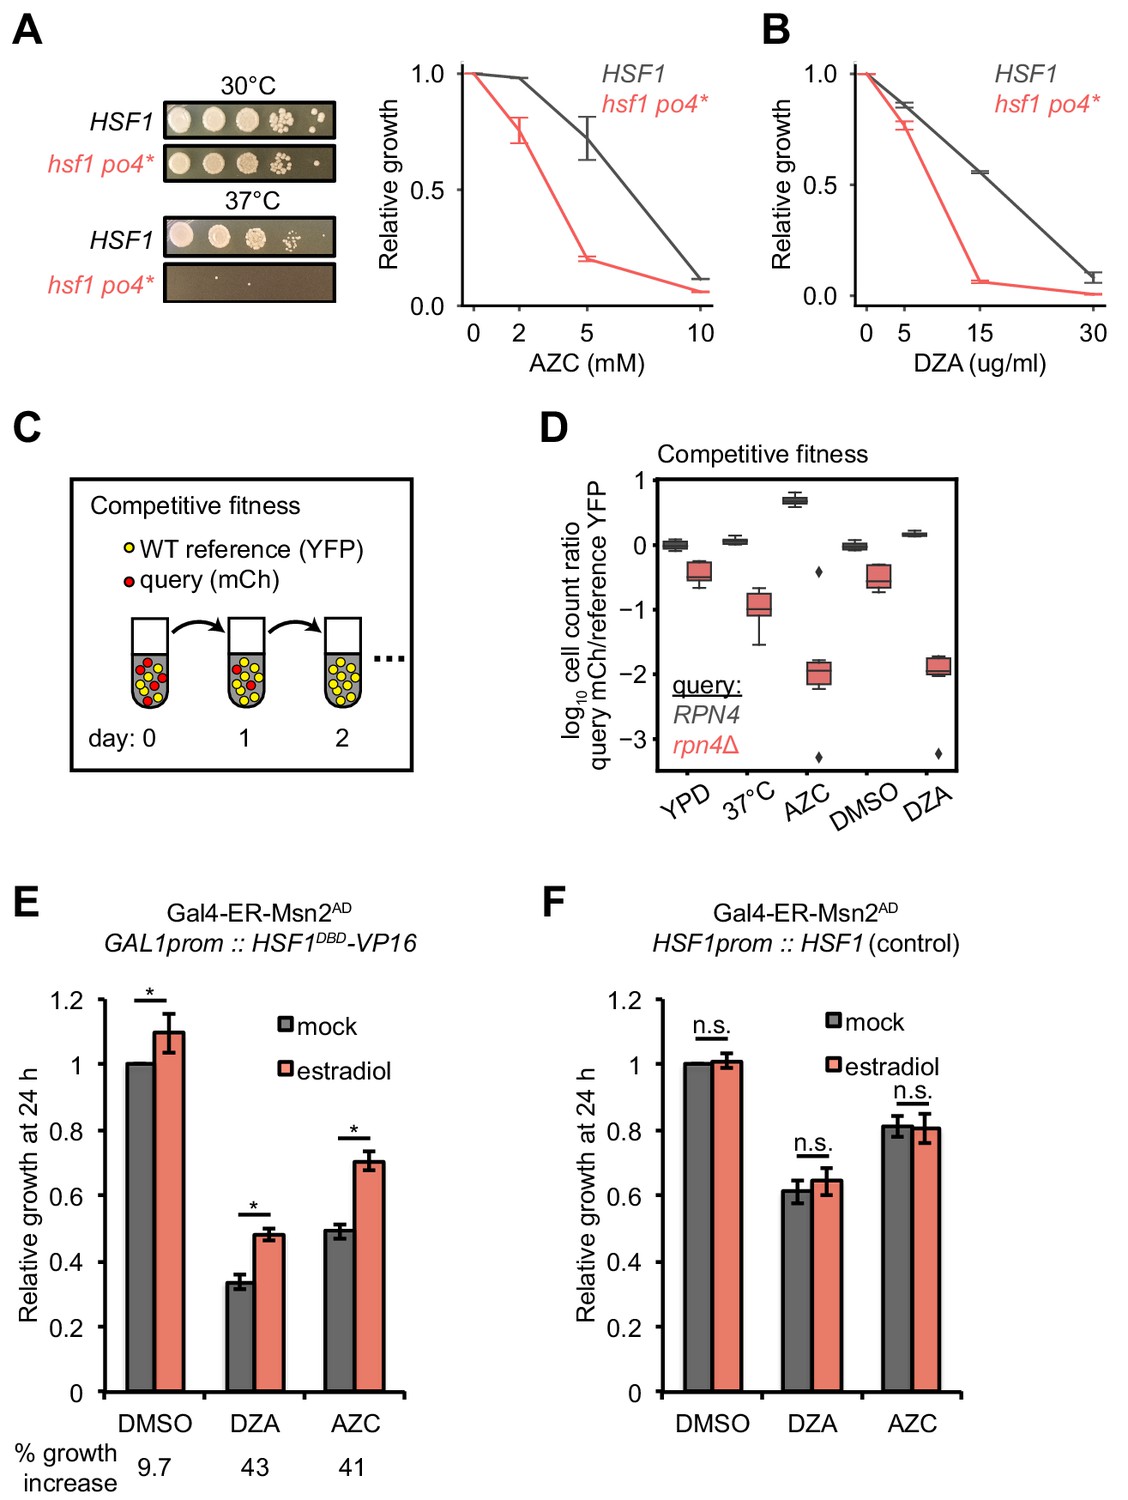
Hsf1 and Rpn4 support cell fitness under RPAS.
(A) Growth defects of hsf1 po4* cells. Left panels, wild-type (HSF1) and mutant (hsf1 po4*, all serine to aspartate) cells were serially diluted 1:10 onto YPD plates and incubated at 30 or 37°C for 2 days. Right panel, cells were grown for 24 hr in the presence of the indicated concentration of AZC and relative growth (compared to untreated) was determined by OD600. Line represents the average and error bars the range of n = 2 biological replicates. (B) Cells were grown for 24 hr in the presence of the indicated concentration of DZA and relative growth (compared to untreated) was determined by OD600. Line represents the average and error bars the range of n = 2 biological replicates. (C) Schematic of competitive fitness assay. Wild-type (WT) cells expressing YFP and query cells expressing mCherry (mCh) were co-cultured in each condition over 5 days. Abundance of YFP +and mCh +cells was determined daily by flow cytometry. (D) The log10 ratio of mCh+ (query) to YFP+ (WT reference) of wild-type (RPN4) and rpn4Δ cells after 3 days of co-culture in YPD, YPD at 37°C, 5 mM AZC, vehicle (DMSO) and DZA (15 μg/ml). Box plot of n = 8 biological replicates with outliers shown as diamonds. (E) Growth of cells expressing a synthetic Hsf1 construct severed from negative regulation by chaperones (Hsf1DBD-VP16) was expressed under an estradiol-responsive promoter. Pre-conditioning was performed with estradiol (2 nM) for 3 hr prior to addition of DMSO, DZA (8 μg/ml), or AZC (2.5 mM) for an additional 21 hr. Growth was determined as OD600 normalized to DMSO control. Bar height depicts the average and error bars the standard deviation of n = 3 biological replicates. Values below indicate the average % increase in growth by estradiol pre-conditioning versus mock. *, all p<0.01 (Student’s t-test). (F) Results of experiments performed identically as described in A, but with an isogenic strain containing HSF1 under its WT promoter instead of the Hsf1DBD-VP16 under an estradiol-responsive promoter. n.s., not significant, all p>0.1 (Student’s t-test).
Figure 6—figure supplement 1
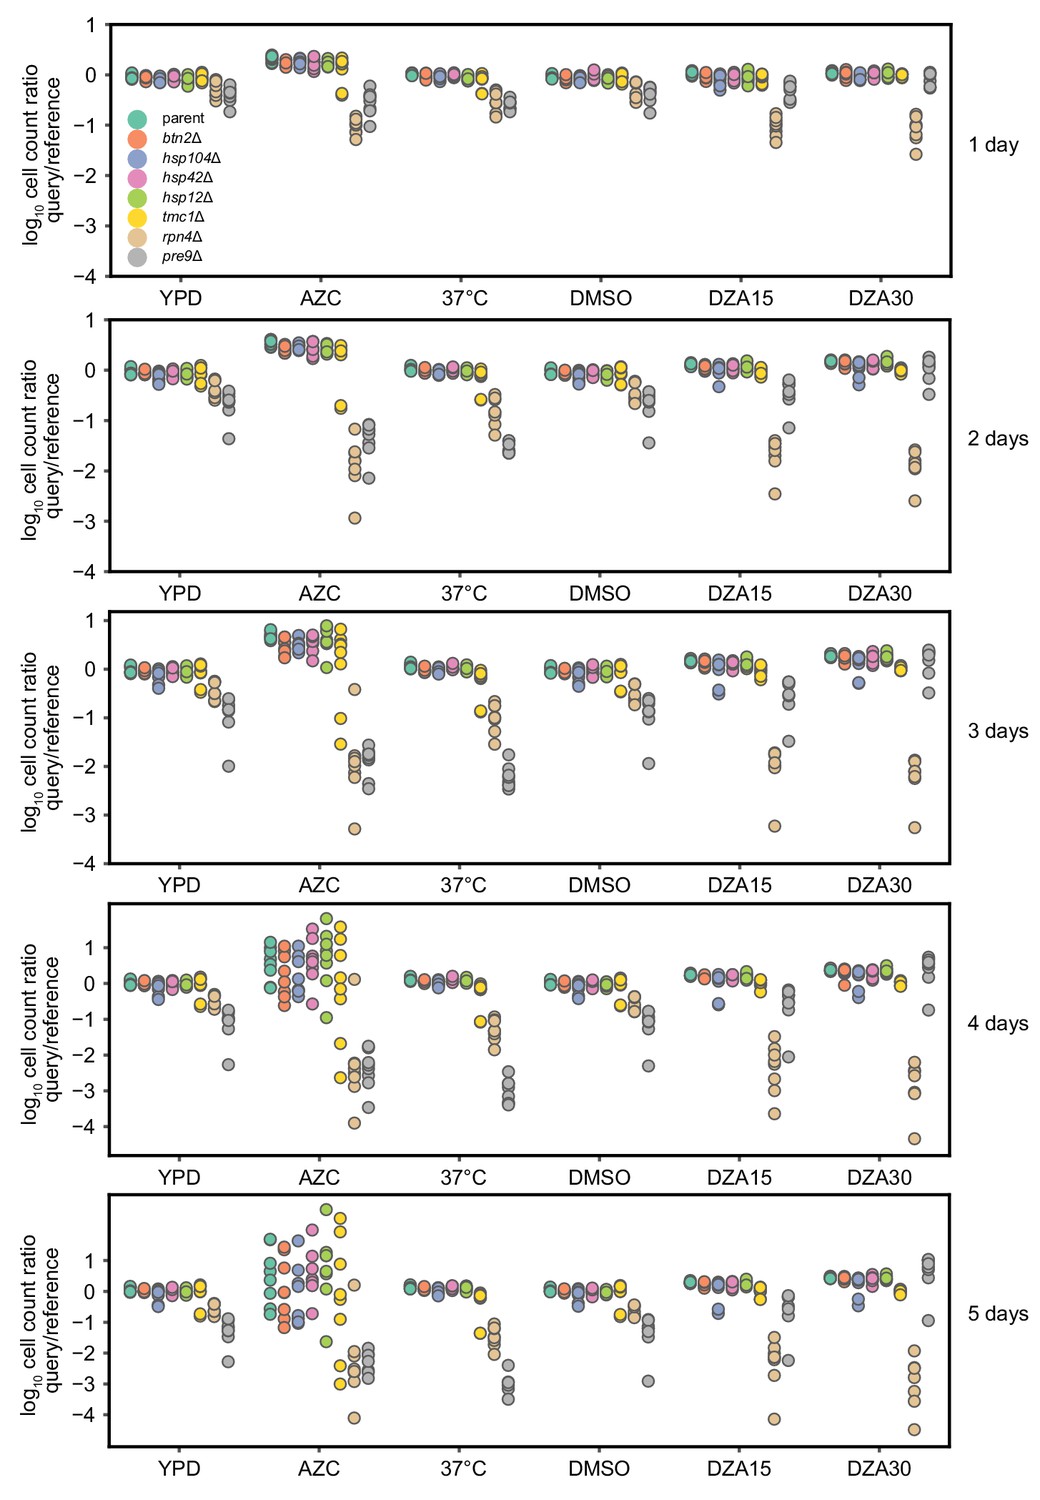
Competitive fitness of strains lacking single Hsf1-dependent genes.
Log10 ratios of query (mCh) to WT reference (YFP) cells after the indicated number of days of co-culture, normalized to the ratio at t = 0. Each dot represents one replicate for a total of eight replicates per competition. Conditions: YPD, 37°C, AZC (5 mM), DMSO (vehicle, 0.2%), DZA15 (DZA 15 µg/ml), DZA30 (DZA 30 µg/ml). The query parent (WT), btn2Δ, hsp104Δ, hsp42Δ, and hsp12Δ all grew identically under all conditions, suggesting these mutants had no growth defect in any condition. tmc1Δ exhibited a mild but reproducible defect in DZA (~4% slower per doubling, p=2.2 × 10⁻⁸ by two-sided Student’s t-test in ‘DZA30’, no defect in DMSO).
Figure 6—figure supplement 2
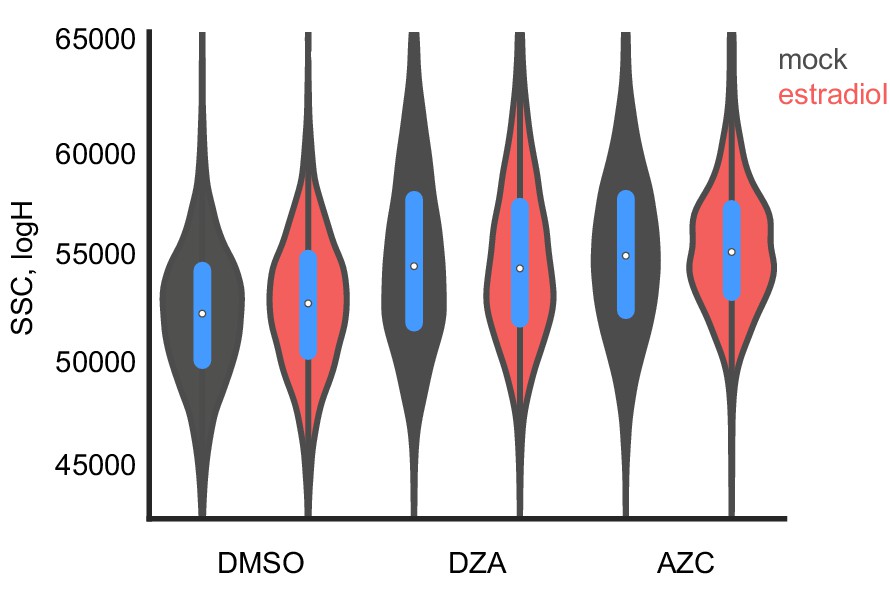
Growth improvement is not due to changes in cell size.
The size of distribution of cells from Figure 6E was determined by flow cytometry by side scatter, plotted in log-space for each condition without or with estradiol pre-conditioning.
Figure 7 with 1 supplement
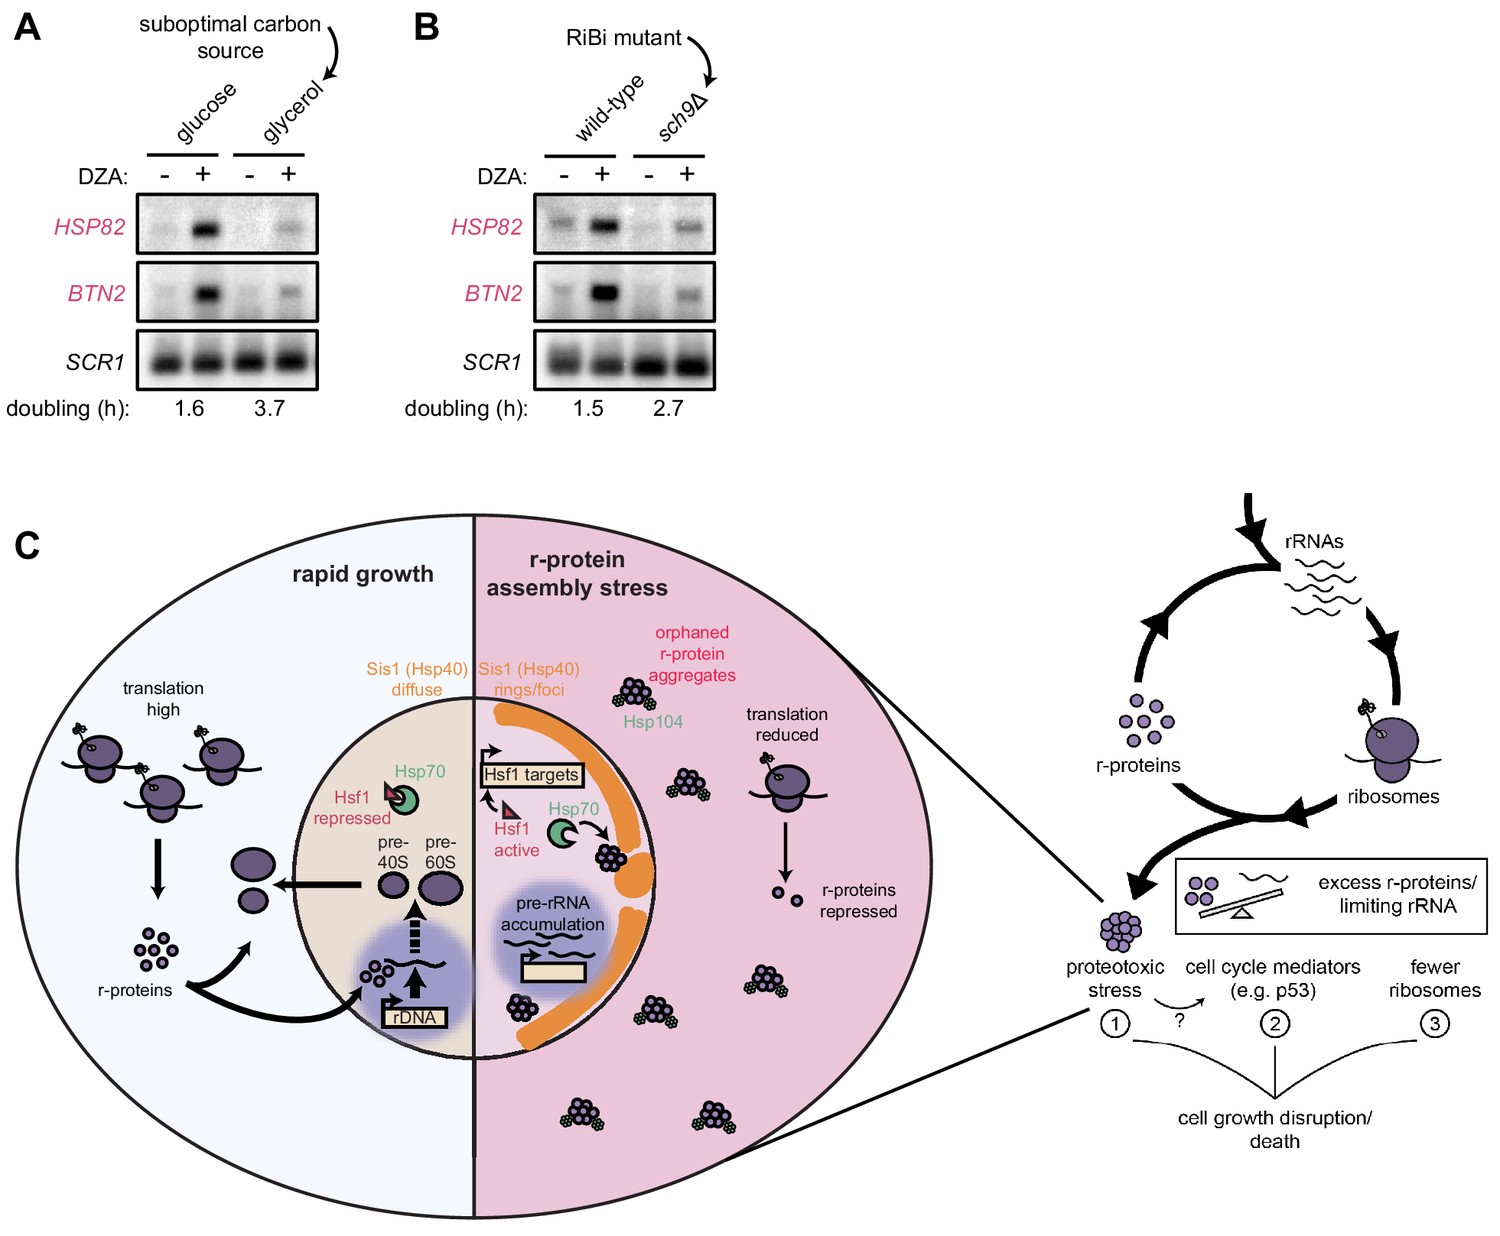
Cells producing fewer ribosomes show reduced proteostatic strain in RPAS.
(A) Wild-type cells were grown to mid-log in rich medium with either 2% glucose or glycerol and treated with DMSO (vehicle, -) or DZA (+) for 15 min. Shown are Northern blots for Hsf1 target genes HSP82 and BTN2. (B) Wild-type and sch9Δ cells were both grown to mid-log in rich medium with 2% glucose and treated with DMSO (vehicle, -) or DZA (+) for 15 min. Shown are Northern blots for Hsf1 target genes HSP82 and BTN2. (C) Model of how disruptions to ribosome biogenesis leads to RPAS and the impacts on cellular physiology. During proliferation, cells rapidly produce ribosomes through coordinated synthesis of r-proteins (purple circles) in the cytoplasm and rRNAs in the nucleolus. Perturbations that result in orphan r-proteins result in proteotoxic stress following r-protein aggregation (left panel). In the cytoplasm, aggregates are visible via Hsp104 foci and translation is downregulated. In the nucleus, Hsp40 Sis1 (orange), and possibly Hsp70, are targeted to aggregates and the nucleolus moves from the nuclear periphery, to adjacent to Sis1-marked ‘rings’. Concomitantly, pre-rRNA accumulates, r-protein genes are transcriptionally repressed, and Hsf1 is liberated from Hsp70 sequestration to activate target genes encoding protein folding and degradation machinery. Proteostasis collapse stalls growth independently from reduced pools of ribosomes (right panel).
Figure 7—figure supplement 1
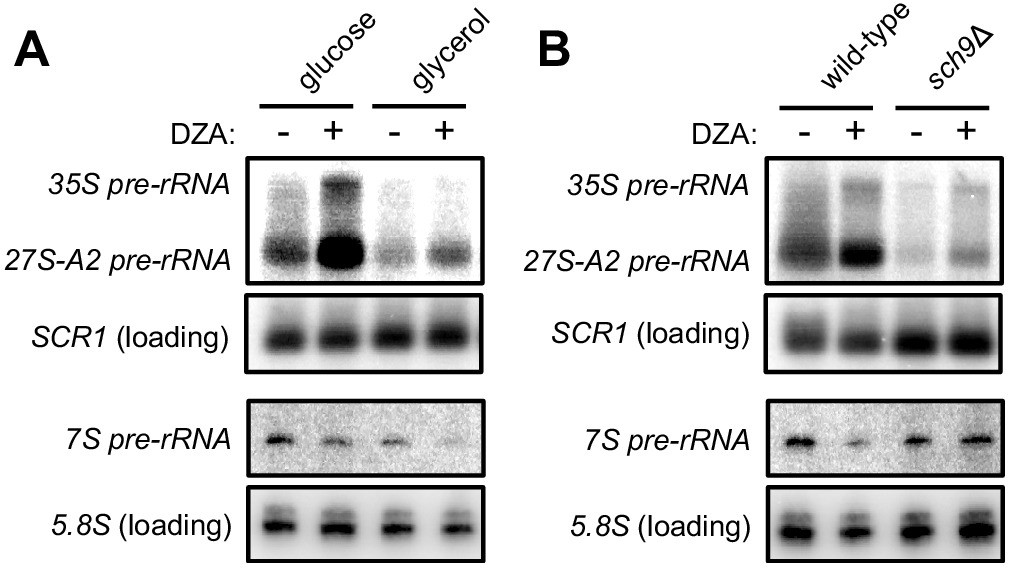
Disrupted rRNA processing in DZA-treated cells.
(A) Samples from Figure 7A were probed for 35S and 27S-A2 (probe 800, (Kos-Braun et al., 2017)) and 7S pre-rRNA (probe 017, (El Hage et al., 2008)). SCR1 control is as in Figure 7A for comparison, and mature 5.8S rRNA is detected from a short exposure of probe 017. (B) Samples from Figure 7B were probed for 35S and 27S-A2 (probe 800, (Kos-Braun et al., 2017)) and 7S pre-rRNA (probe 017, (El Hage et al., 2008)). SCR1 control is as in Figure 7B for comparison, and mature 5.8S rRNA is detected from a short exposure of probe 017.
Tables
Key resources table
| Reagent type (species) or resource | Designation | Source or reference | Identifiers | Additional information |
|---|---|---|---|---|
| Antibody | Mouse monoclonal anti-V5 | Invitrogen | Invitrogen:R960-25; RRID:AB_2556564 | 1:2000 |
| Antibody | Mouse monoclonal anti-Pgk1 | Abcam | Abcam:ab113687; RRID:AB_10861977 | 1:10,000 |
| Antibody | Rabbit polyclonal anti-Rpb1 | Santa Cruz Biotechnology | Santa Cruz:sc-25758; RRID:AB_655813 | 1:1000 |
| Antibody | Rabbit polyclonal anti-Hsp104 | Enzo Life Sciences | Enzo:ADI-SPA-1040 | 1:1000 |
| Antibody | Mouse monoclonal anti-Hsp70 | Abcam | Abcam:ab5439; RRID:AB_304888 | 1:1000 |
| Antibody | Rabbit monoclonal anti-phos-Rps6 (Ser235/236) | Cell Signaling Technology | Cell Signaling:4858; RRID:AB_916156 | 1:2000 |
| Antibody | Rabbit polyclonal anti-phos-eIF2α (Ser51) | Invitrogen | Invitrogen:44–728G; RRID:AB_2533736 | 1:1000 |
| Chemical compound, drug | auxin (indole-3-acetic acid) | Sigma-Aldrich | Sigma-Aldrich:I3750 | |
| Chemical compound, drug | diazaborine | Millipore Sigma | Millipore Sigma:530729 | |
| Chemical compound, drug | cycloheximide | Sigma-Aldrich | Sigma-Aldrich:C4859 | |
| Chemical compound, drug | L-azetidine-2-carboxylic acid | Sigma-Aldrich | Sigma-Aldrich:A0760 | |
| Chemical compound, drug | diamide | Sigma-Aldrich | Sigma-Aldrich:D3648 | |
| Chemical compound, drug | rapamycin | LC Labs | LC Labs:R-5000 | |
| Chemical compound, drug | beta-estradiol | Sigma-Aldrich | Sigma-Aldrich:E2758 |
Additional files
-
Supplementary file 1
Yeast strains used in this study.
- https://doi.org/10.7554/eLife.43002.021
-
Supplementary file 2
Plasmids used in this study.
- https://doi.org/10.7554/eLife.43002.022
-
Supplementary file 3
Primers used in this study.
- https://doi.org/10.7554/eLife.43002.023
-
Supplementary file 4
Gene annotation lists and RNA-seq data used in Figures 1–3.
Tab ‘Gene_Lists’ contains members of groups used for analysis. Subsequent tabs contain RNA abundance measurements determined by DESeq2 or RPKM calculations.
- https://doi.org/10.7554/eLife.43002.024
-
Supplementary file 5
Flow cytometry data from competitive fitness experiments used in Figure 6.
Query (mCh) and reference (YFP) counts for each competition at t = 0, 1, 2, 3, 4, 5 days. Each mutant query had four isolates (‘Iso1-4’) that were tested in two technical replicates (‘Rep1-2’), for a total of eight replicates per experiment. The normalized, log10 transformed values were used to generate plots.
- https://doi.org/10.7554/eLife.43002.025
-
Supplementary file 6
Summary of proteomics data of input and pellet proteins.
The value of each protein is normalized to the total signal in each sample (TMT channel) to determine relative abundance within each sample (parts per million, ppm).
- https://doi.org/10.7554/eLife.43002.026
-
Transparent reporting form
- https://doi.org/10.7554/eLife.43002.027
Download links
A two-part list of links to download the article, or parts of the article, in various formats.
Downloads (link to download the article as PDF)
Open citations (links to open the citations from this article in various online reference manager services)
Cite this article (links to download the citations from this article in formats compatible with various reference manager tools)
Proteotoxicity from aberrant ribosome biogenesis compromises cell fitness
eLife 8:e43002.
https://doi.org/10.7554/eLife.43002


