Disentangling bias between Gq, GRK2, and arrestin3 recruitment to the M3 muscarinic acetylcholine receptor
- Department of Pharmaceutical Chemistry, Philipps-University Marburg, Germany
- Department of Pharmacology and Clinical Pharmacy, Faculty of Pharmacy, Philipps-University Marburg, Germany
- Molecular, Cellular and Pharmacobiology Section, Institute for Pharmaceutical Biology, University of Bonn, Germany
Figures
Figure 1 with 5 supplements
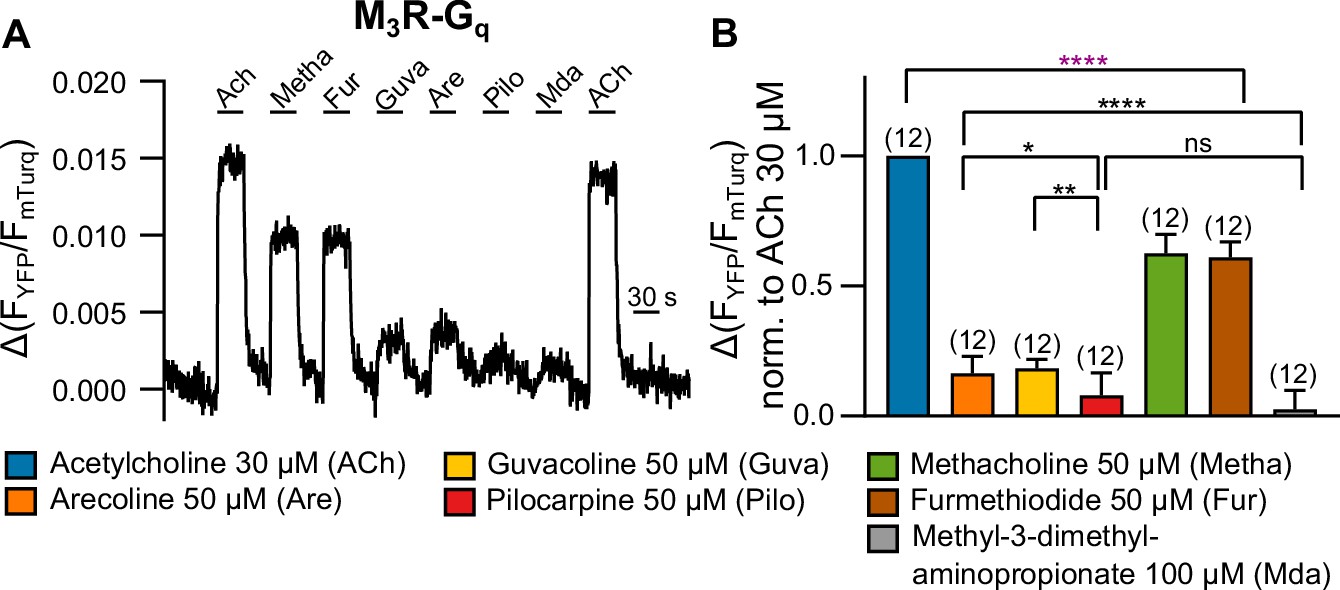
Measuring G protein binding to the M3R upon stimulation with muscarinic receptor agonists (A).
(B) G protein-M3R interaction was measured as described in Figure 1—figure supplement 3 by means of single-cell Förster resonance energy transfer (FRET) recording. The cells were stimulated with distinct concentrations of each agonist as indicated. The amplitudes were normalized to the ACh amplitude of every cell. An ordinary one-way ANOVA (****p<0.0001) with Tukey’s multiple comparison test, and additionally for paired measurements a paired Student’s t-test, was conducted. Only the significant differences (ANOVA: black, t-test: purple) in terms of biased recruitment to the M3R are shown. All data are plotted as mean values ± SD for each condition.
-
Figure 1—source data 1
Source data related to Figure 1B.
- https://cdn.elifesciences.org/articles/58442/elife-58442-fig1-data1-v2.xlsx
Figure 1—figure supplement 1
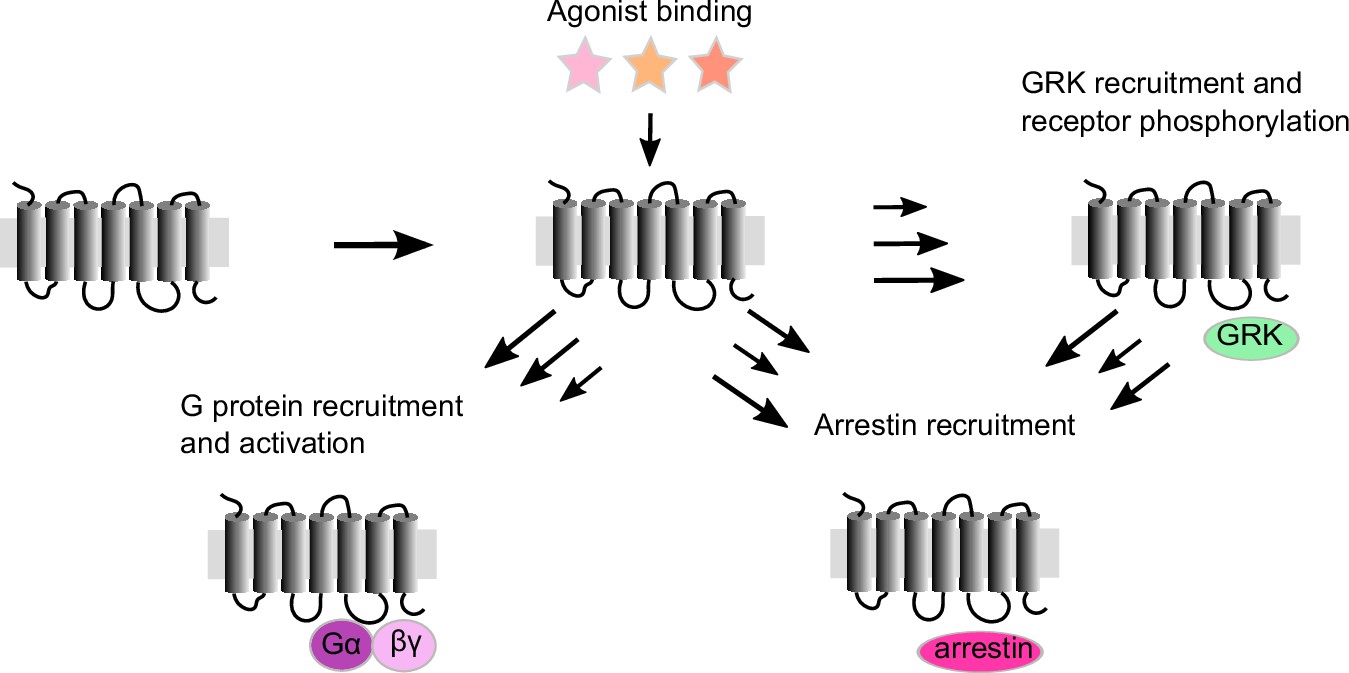
Schematic representation of G protein-coupled receptor (GPCR) activation: agonist binding to the orthosteric pocket stabilizes the active receptor conformations.
This results in the opening of the intracellular effector-binding cavity and leads to the recruitment of intracellular effector proteins to the active receptor, like G proteins, G protein-coupled receptor kinases (GRKs), and arrestins. While activated G proteins transmit and modulate a multitude of signals, recruitment of GRKs leads to receptor phosphorylation, enabling and modulating the recruitment of arrestins to the receptor, which can then lead to receptor internalization and desensitization. Agonists can lead to different levels of effector protein recruitment, depicted here as arrows of different length.
Figure 1—figure supplement 2
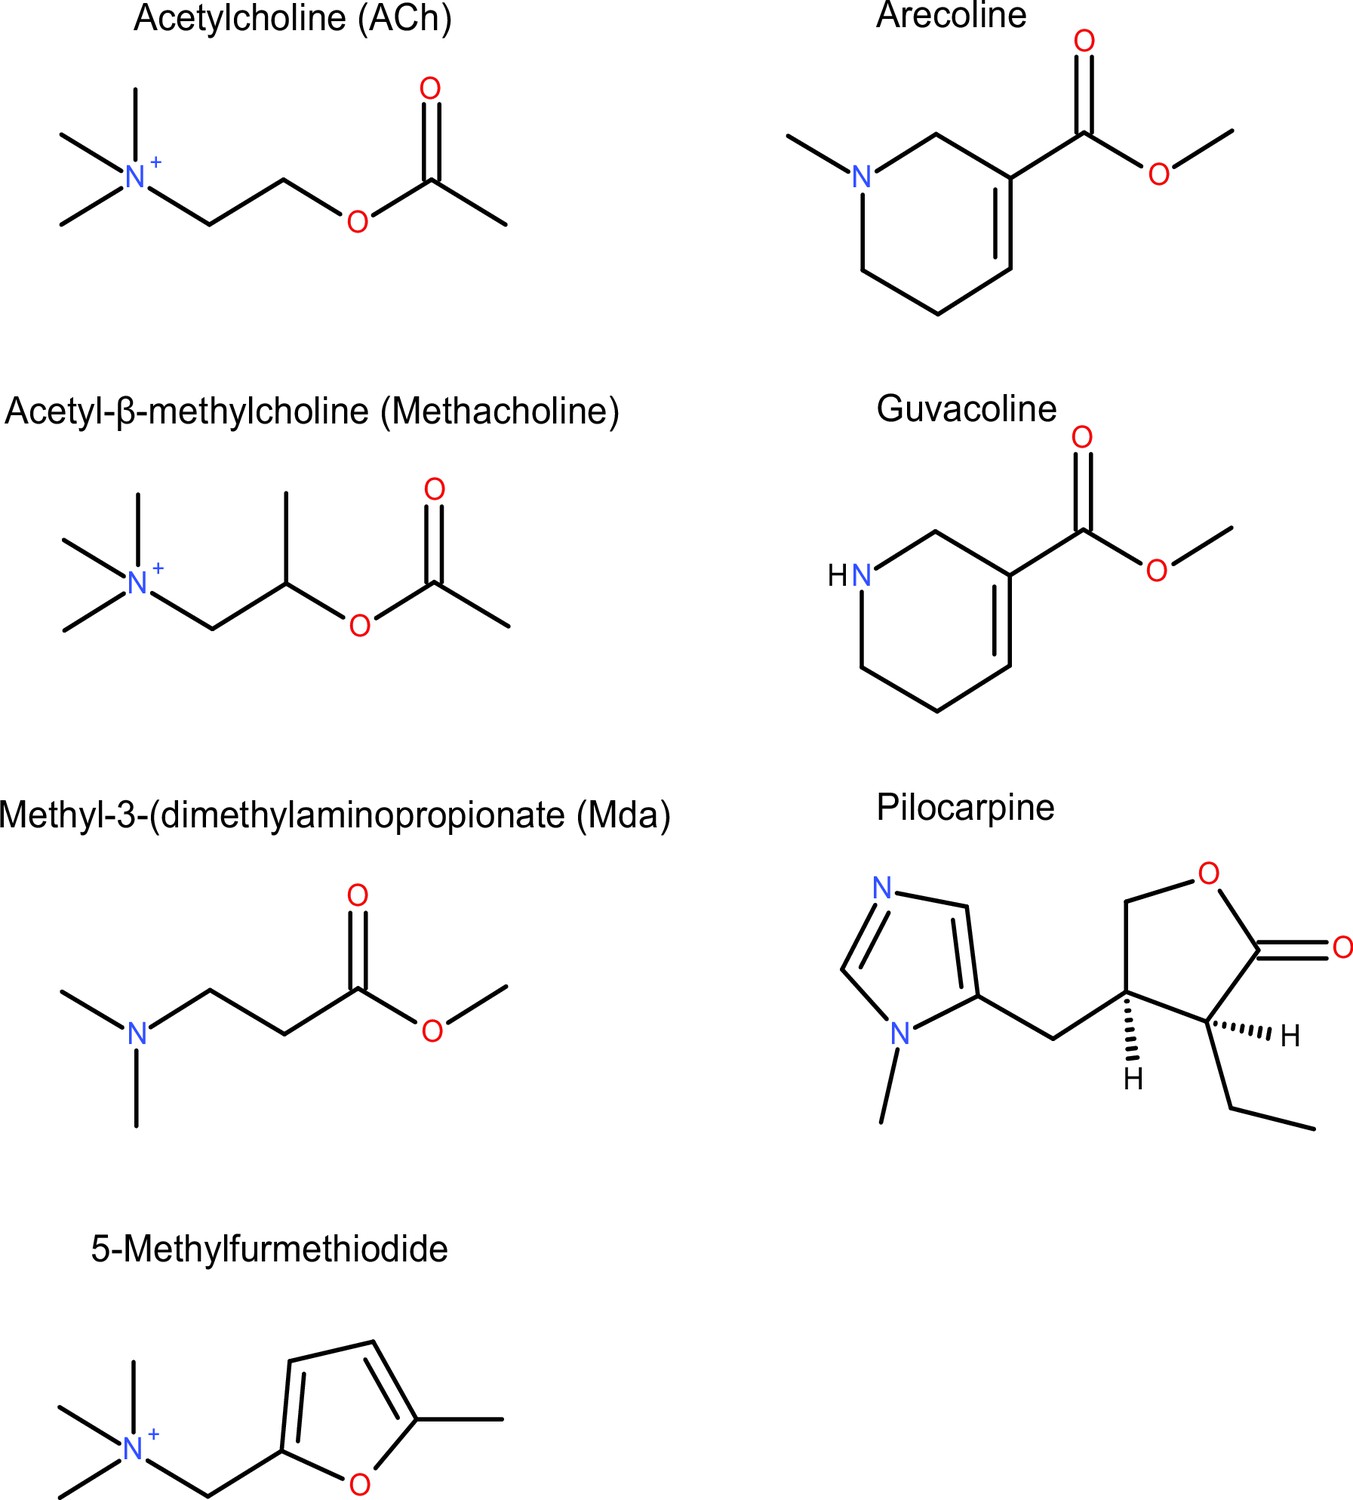
2D chemical structures of the seven agonists.
Figure 1—figure supplement 3
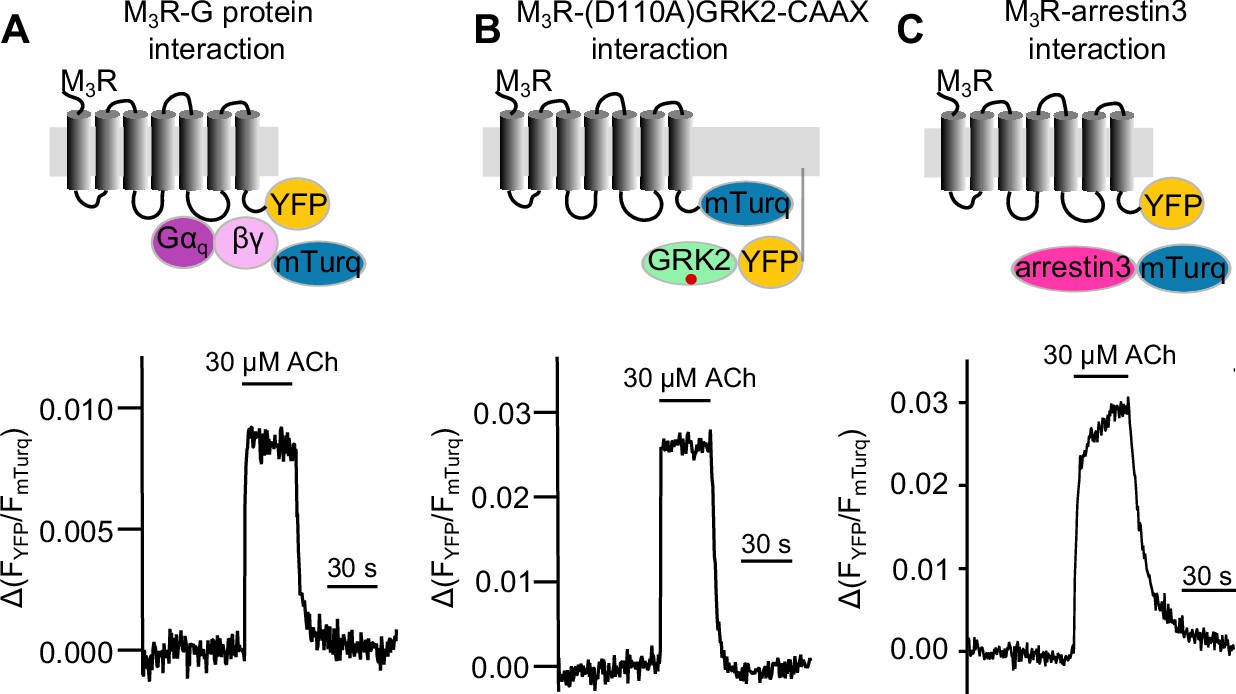
Measuring response modulation of muscarinic receptor agonists of Gq, GRK2, and arrestin3 binding to the M3 muscarinic acetlycholine receptor (M3R).
Schematic illustration of single-cell Förster resonance energy transfer (FRET) imaging and example measurements of Gq (A), GRK2 (B), and arrestin3 (C) interaction with M3R upon stimulation with 30 μM ACh.
Figure 1—figure supplement 4
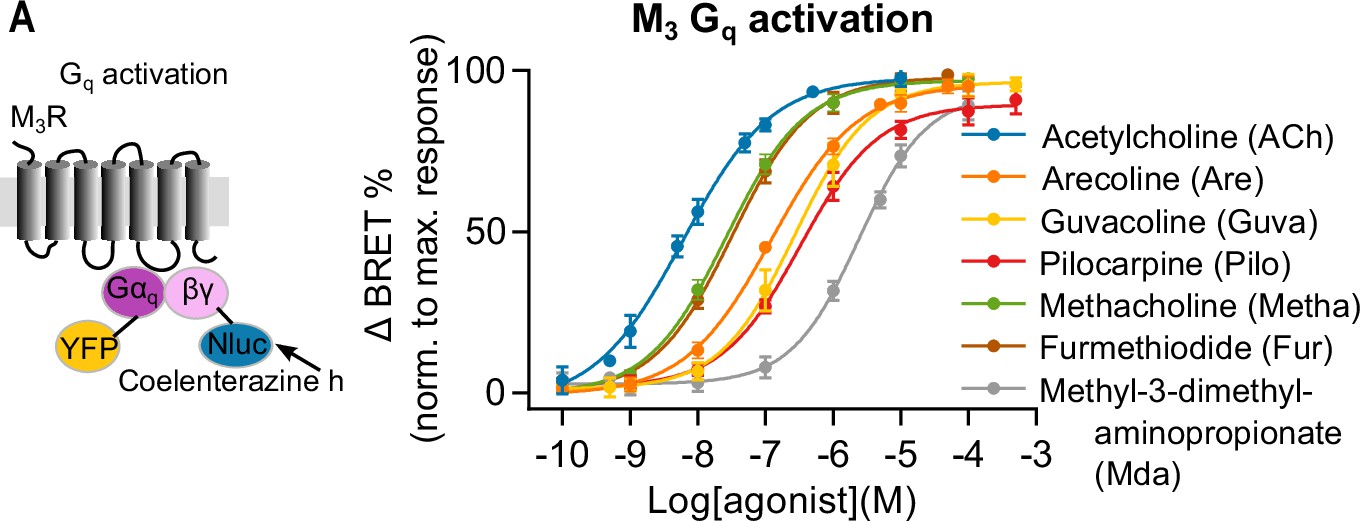
Measuring Gq activation of muscarinic receptor agonists.
Gq activation was measured with BRET imaging in HEK293T cells. The BRET ratio was normalized to the maximum response of ACh (50 μM) of every well. A concentration-response curve for Gq activation with GRK2 overexpression was plotted for ACh (n = 4–14), Are (n = 4–9), Guva (n = 4–14), Pilo (n = 7), Metha (n = 8), Fur (n = 8), and Mda (n = 4–10). All data are plotted as mean values ± SD for each condition.
-
Figure 1—figure supplement 4—source data 1
Source data related to Figure 1—figure supplement 4, concentration-response curves of Gq activation.
- https://cdn.elifesciences.org/articles/58442/elife-58442-fig1-figsupp4-data1-v2.xlsx
Figure 1—figure supplement 5
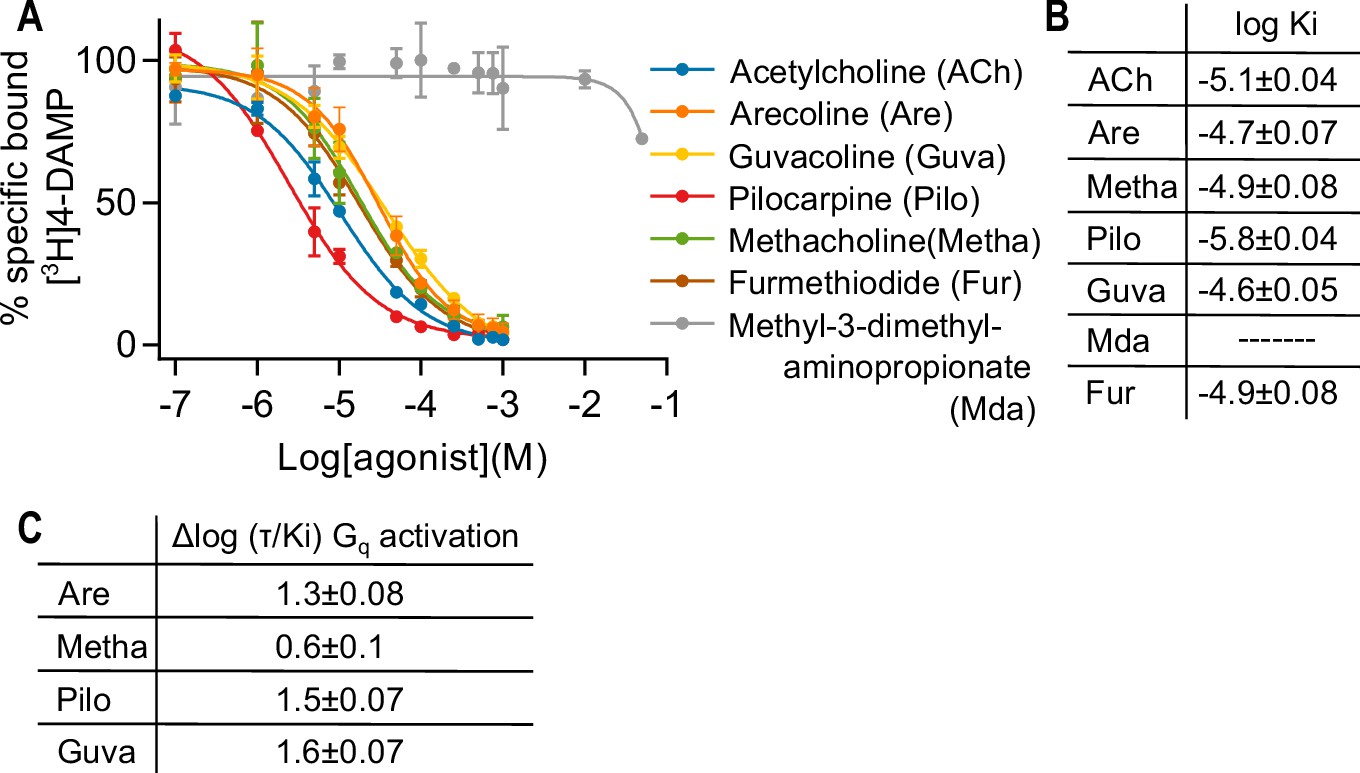
Measuring affinity of seven muscarinic receptor agonists at the M3R.
(A) In a radioligand displacement assay, the competition between 0.2 nM [3H] 1,1-dimethyl-4-diphenylacetoxypiperidinium ([3H]4-DAMP) and increasing concentrations of agonist was measured. Atropine (1 μM) was used to detect unspecific binding. Results are expressed as % of control specific binding with n = 2 ± SD for each condition. The calculated log Ki values ± SD are shown in (B). (C) Relative agonist activity of five agonists for Gq activation. Data from (A), (B), and (Figure 1—figure supplement 4) were used for the calculation. The Δlog (τ/Ki) values were calculated relative to ACh as reference agonist. τ was calculated according to the operational model by Black and Leff, 1997. The error was estimated with Gaussian error propagation.
-
Figure 1—figure supplement 5—source data 1
Source data related to Figure 1—figure supplement 5.
- https://cdn.elifesciences.org/articles/58442/elife-58442-fig1-figsupp5-data1-v2.xlsx
Figure 2 with 3 supplements
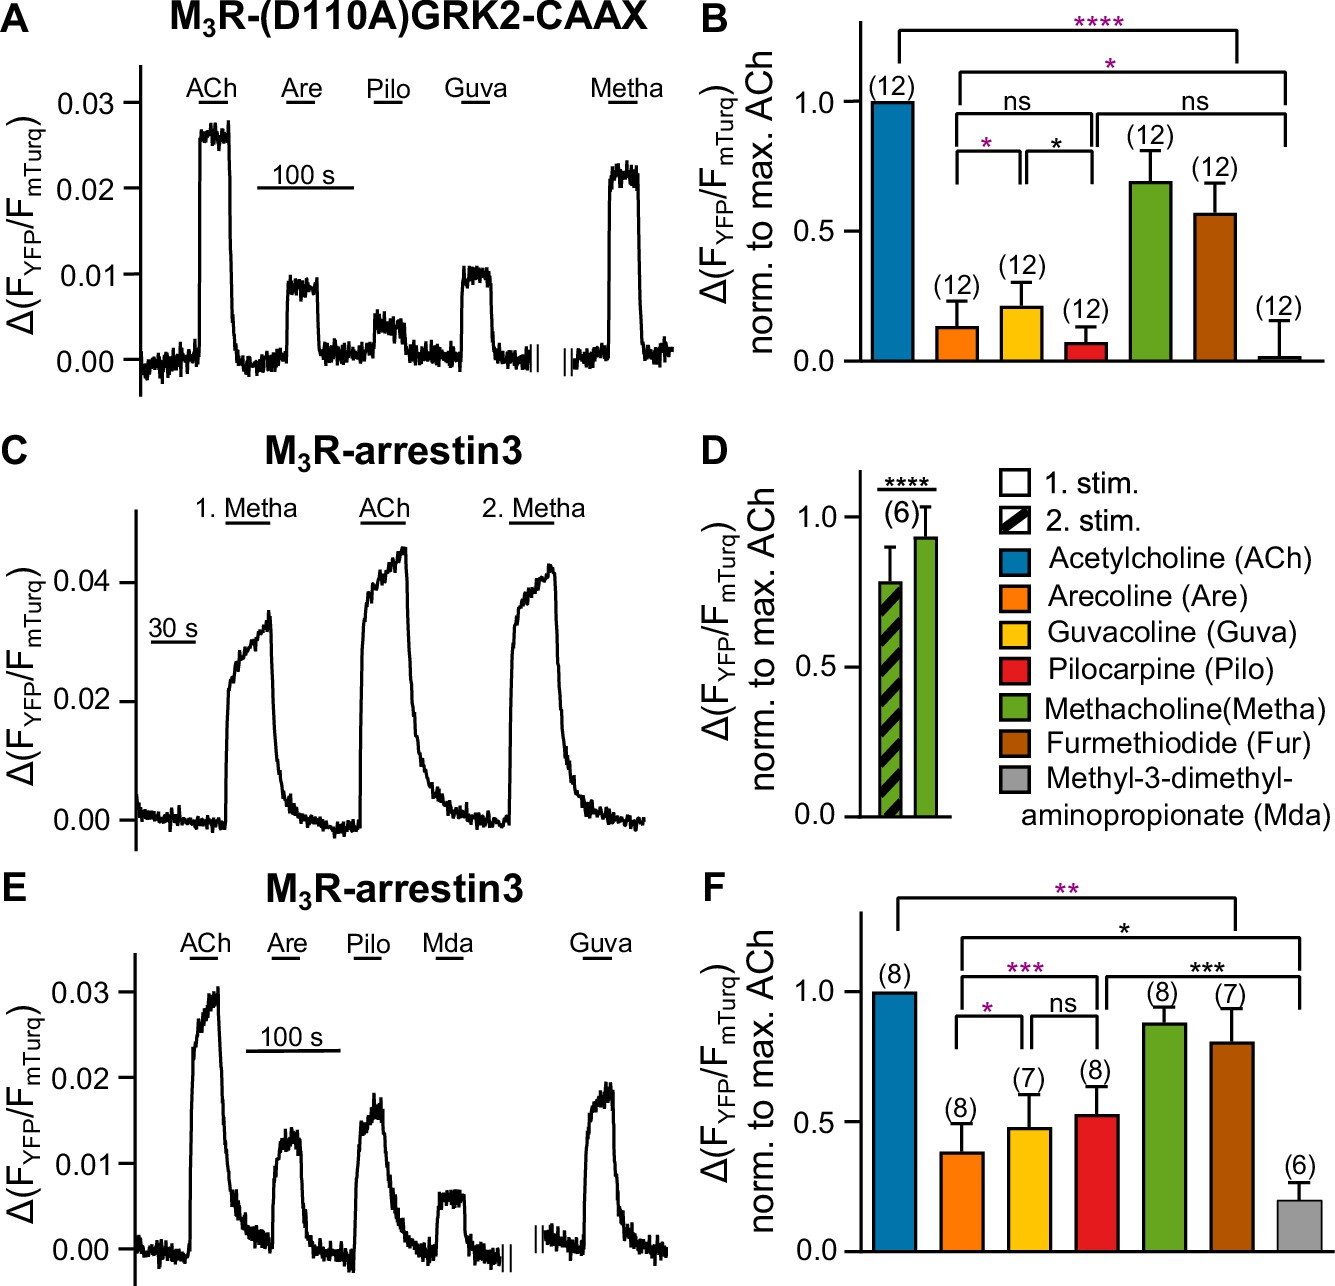
Bias in arrestin3 recruitment is distinct from bias in GRK2 recruitment.
(A, B) M3R-(D110A)GRK2-CAAX interaction without Gαq overexpression was measured with a single-cell Förster resonance energy transfer (FRET)-based assay, after cells were preincubated with 50 ng/mL of PTX overnight and additionally for 10 min before the start of the measurement, while continuously superfused with FR900359 at a concentration of 1 µM during the whole measurement. (C–F) M3R-arrestin3 interaction was measured with a single-cell FRET-based assay. Each cell was stimulated for 30 s with saturating concentrations of each indicated agonist. (C) Stimulation with agonist (first stimulation), thereafter with ACh and after that with agonist again (second stimulation) shows that M3R-arrestin3 interaction increases with repeated stimulation by an agonist in the same cell. (D) Mean amplitude values of first and second stimulation were statistically analyzed with a paired t-test. (B, D, F) All amplitudes were normalized to the ACh amplitude of the same cell (norm. to max. ACh). One-way ANOVA (****p<0.0001) with Tukey’s multiple comparison test, and additionally for paired measurements a paired Student’s t-test, was conducted. Only the significant differences (ANOVA: black, t-test: purple) in terms of biased recruitment to the M3R are shown. Data are shown as mean ± SD, *p<0.05, **p<0.001, ***p<0.001, ****p<0.0001. The number of experiments is indicated in parentheses.
-
Figure 2—source data 1
Source data related to Figure 2B, D and F.
- https://cdn.elifesciences.org/articles/58442/elife-58442-fig2-data1-v2.xlsx
Figure 2—figure supplement 1
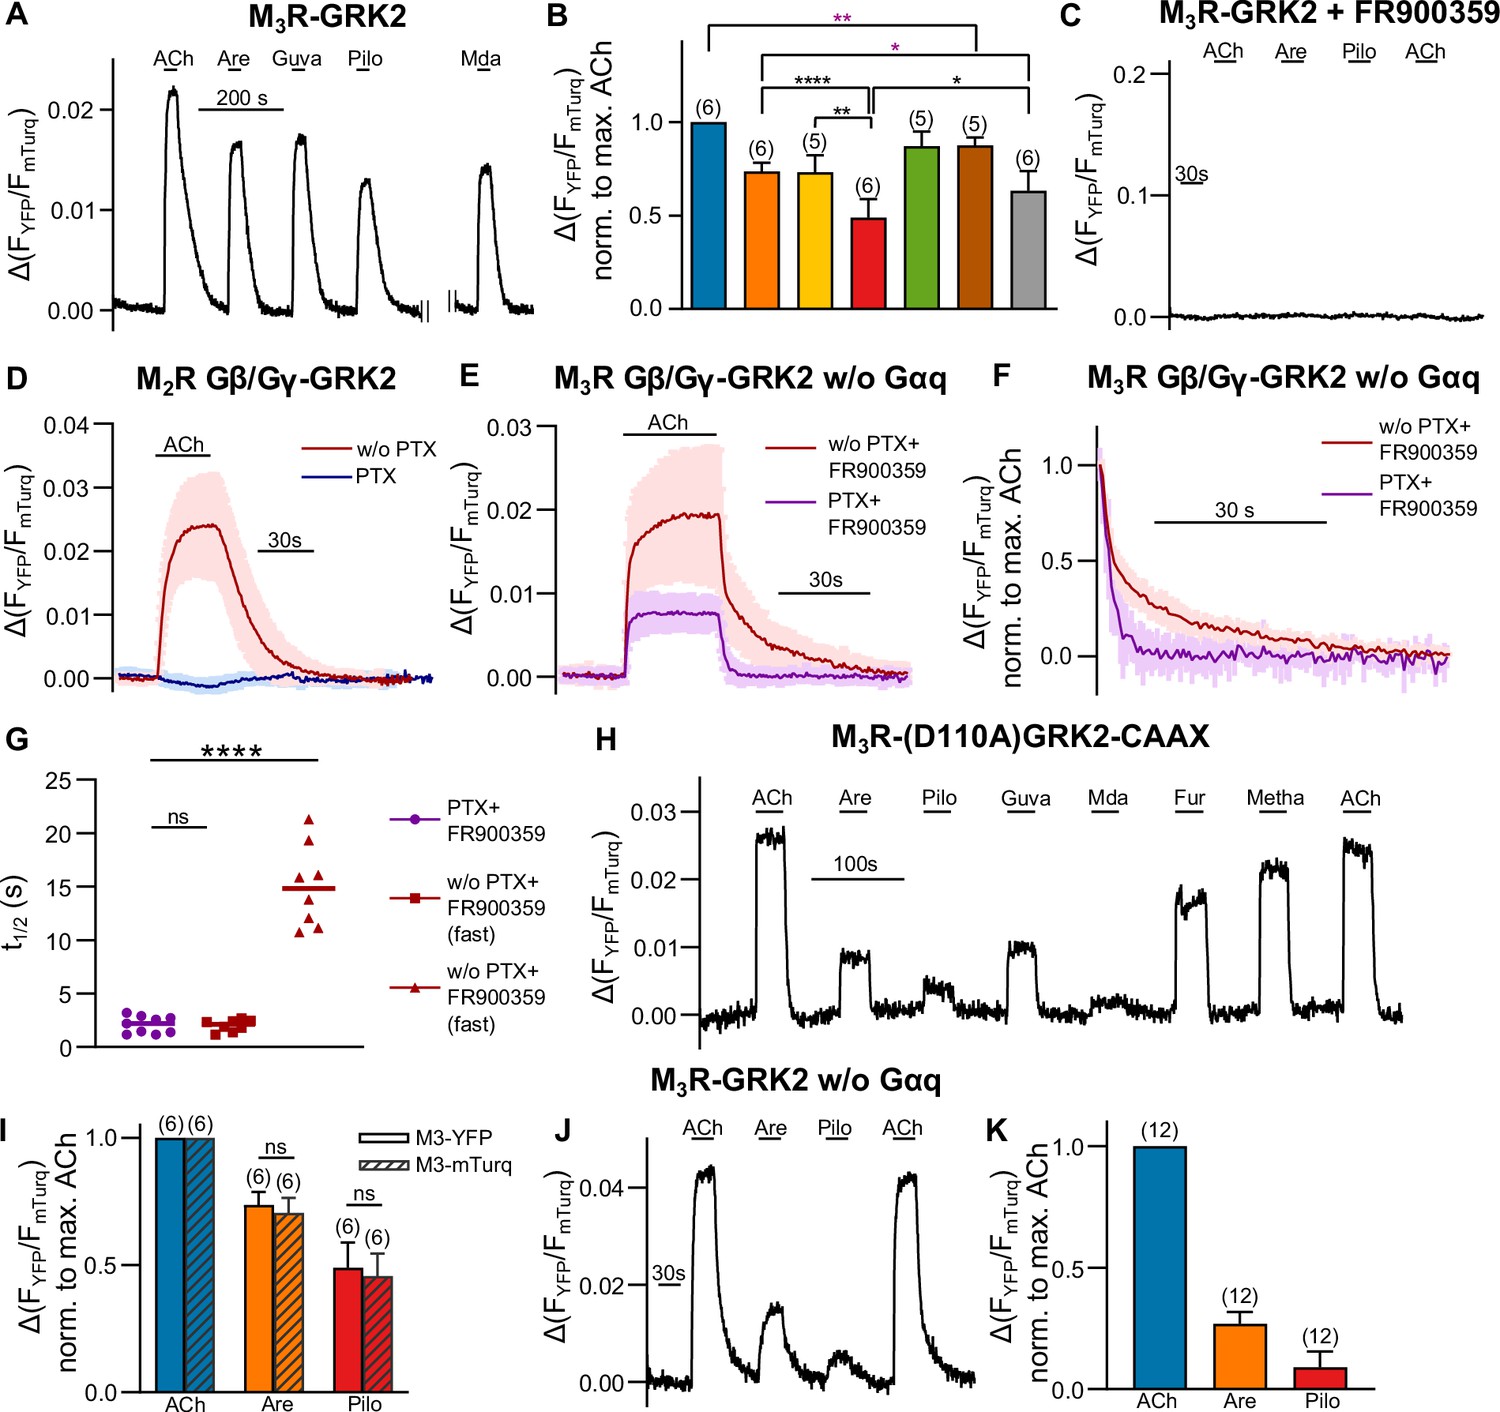
Förster resonance energy transfer (FRET)-based single-cell measurements to control successful eradication of the influence of G protein activation on M3R-GRK2 interaction.
(A, B) M3R-GRK2 interaction was measured with a single-cell FRET-based assay. Each cell was stimulated for 30 s with saturating concentrations of each indicated agonist. All amplitudes were normalized to the ACh amplitude of the same cell (norm. to max. ACh). One-way ANOVA (****p<0.0001) with Tukey’s multiple comparison test, and additionally for paired measurements a paired Student’s t-test, was conducted. Only the significant differences (ANOVA: black, t-test: purple) in terms of biased recruitment to the M3R are shown. (C) M3R-YFP-GRK2-mTurq interaction was measured as described in (A). The cells were stimulated with each agonist as indicated (ACh: 30 µM; Are and Pilo: 50 µM). The cells were incubated 10 min before the measurement and superfused during the whole measurement with 1 µM FR900359. (D, E) Shown are the control measurements of the G protein inhibitor function. (D) Gβ/Gγ GRK2 interaction induced by the activated M2R was measured in single cells. The cells were stimulated with 30 µM ACh for 30 s, where one condition was pretreated with 50 ng/mL PTX overnight (n = 6). (E) Gβ/Gγ GRK2 interaction induced by the stimulated M3R was measured without Gαq overexpression. In addition to the pretreatment of PTX as described in (B), 1 µM FR900359 was present for one condition 10 min before and during the whole measurement (n = 8–9). (F) The data of (E) were normalized to the maximum response of ACh in order to determine (G) the half-lives by fitting a one-phase exponential decay for ACh and a two-phase decay for the treatment together with the inhibitors (percent fast: 60.16 ± 14.44) (H) Complete time series of the measurement shown in Figure 2A. (I) The amplitudes of FRET between M3R-YFP-GRK2-mTurq evoked by the indicated agonists were normalized to those obtained by 30 µM ACh and were compared to those measured between M3R-mTurq-GRK2-YFP. (G, I) The analysis was verified by an unpaired t-test. (J, K) The M3R-GRK2 interaction measurement was performed analog to (A), but without Gαq overexpression. Data are shown as mean ± SD, *p<0.05, **p<0.001, ***p<0.001, ****p<0.0001.
-
Figure 2—figure supplement 1—source data 1
Source data related to Figure 2—figure supplement 1B, D, E, F, F, I and K.
- https://cdn.elifesciences.org/articles/58442/elife-58442-fig2-figsupp1-data1-v2.xlsx
Figure 2—figure supplement 2
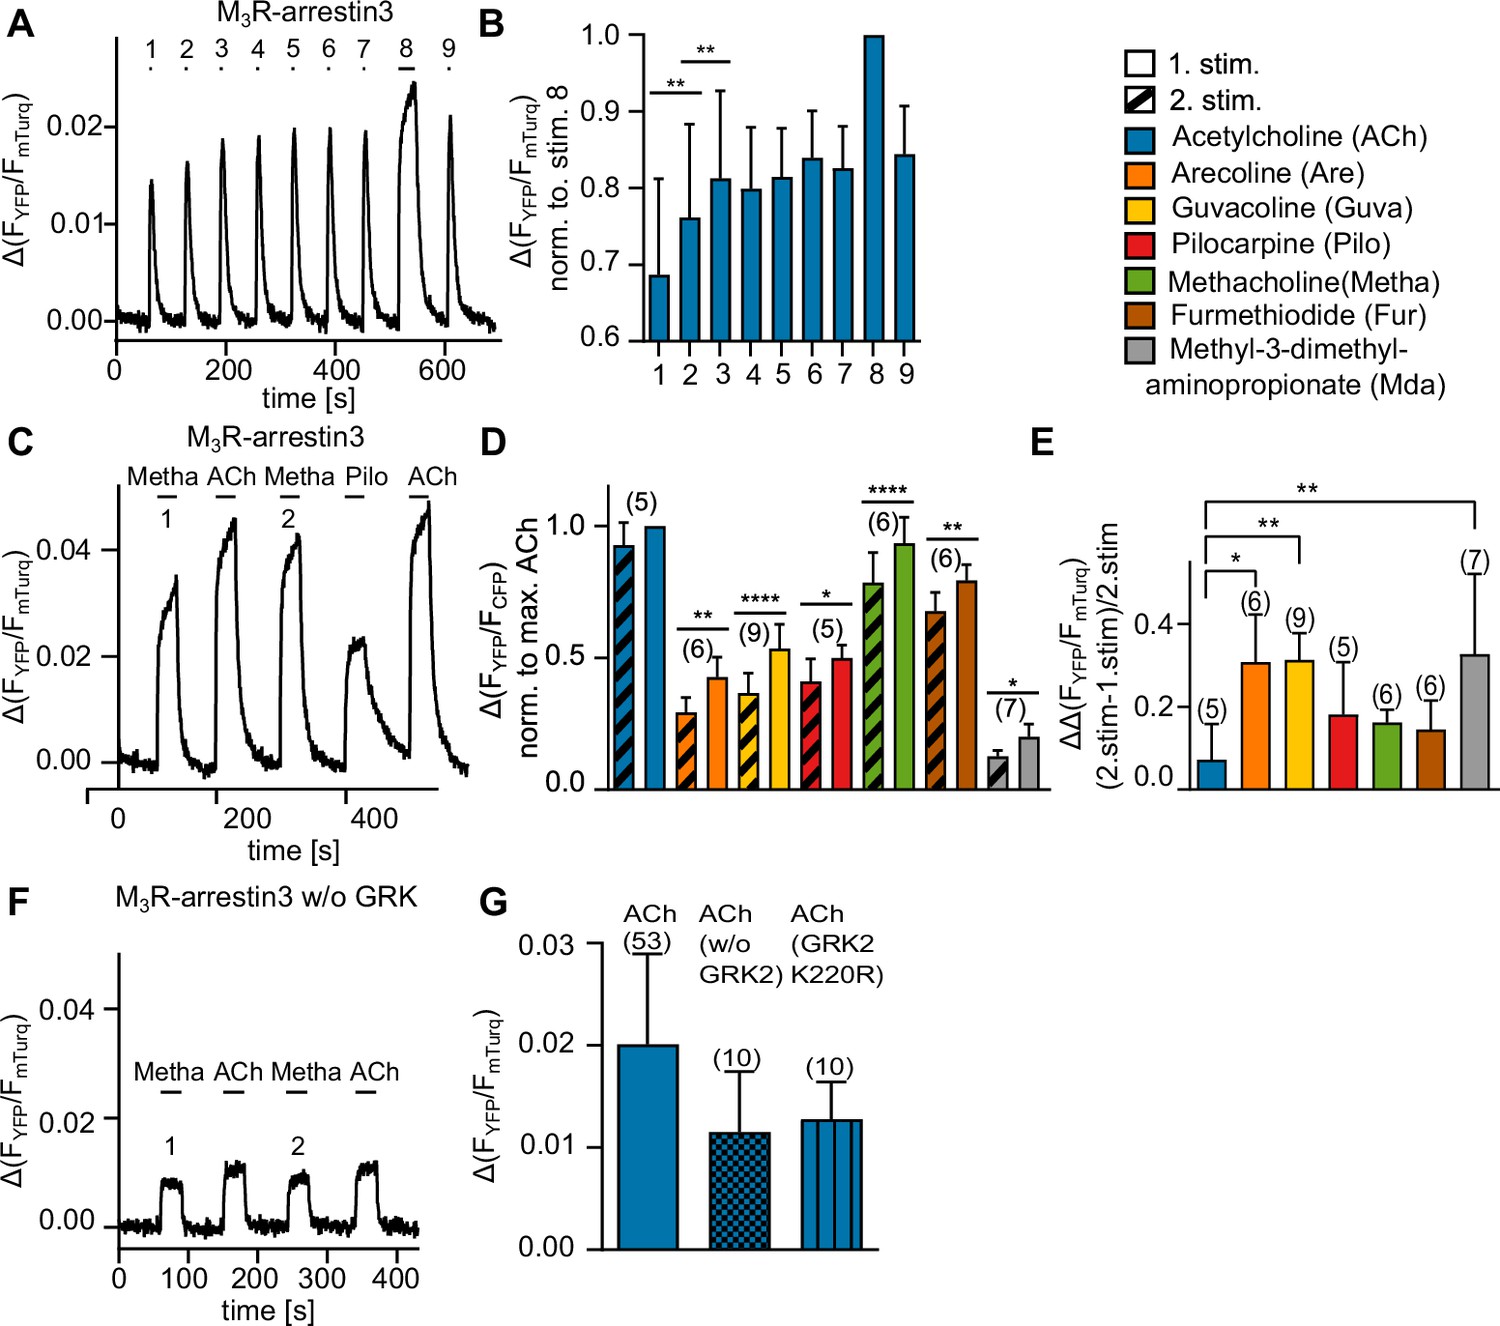
M3R-arrestin3 interaction increases with repeated stimulation by an agonist in the same cell.
(A) M3R-arrestin3 interaction was measured with a single-cell Förster resonance energy transfer (FRET)-based assay in HEK293T cells. Each cell was stimulated repeatedly with ACh (30 µM) for 5 s. After an increase in M3R-arrestin3 interaction could no longer be observed, the cell was stimulated for 30 s and thereafter again for 5 s with ACh. The stimulations are numbered (1–9). (B) To analyze the increase, mean amplitude values of (A) of n = 6 were plotted and analyzed statistically by a one-way ANOVA (**p=0.0022) with Tukey’s multiple comparison test. (C) M3R-arrestin3 interaction was measured with single-cell FRET-based measurements. Each cell was stimulated for 30 s with a saturating concentration of agonist (first stimulation), thereafter with ACh and after that with agonist again (second stimulation). The resulting amplitudes from the stimulation of the cell with Pilo and ACh were used as control and for normalization. (D) Comparison of mean amplitude values between first and second stimulation for each agonist was analyzed statistically with a paired t-test. (E) The amplitude of the first stimulation was subtracted from the amplitude of the second stimulation and normalized to the amplitude of the second stimulation, yielding the individual interaction increase. A one-way ANOVA (***p<0.001) with Tukey’s multiple comparison test was conducted. (F) M3R-arrestin3 interaction was measured as described in (C) without overexpression of GRK2 (w/o GRK2). (G) M3R-arrestin3 interaction, induced by stimulation with ACh (30 µM) in cells overexpressing GRK2, without GRK2 and cells overexpressing the kinase-deficient mutant K220R (Kong et al., 1994; Wolters et al., 2015). Data are shown as mean ± SD, *p<0.05, **p<0.001, ***p<0.001, ****p<0.0001. The number of experiments is indicated in parentheses.
-
Figure 2—figure supplement 2—source data 1
Source data related to Figure 2—figure supplement 2B, D, E and G.
- https://cdn.elifesciences.org/articles/58442/elife-58442-fig2-figsupp2-data1-v2.xlsx
Figure 2—figure supplement 3
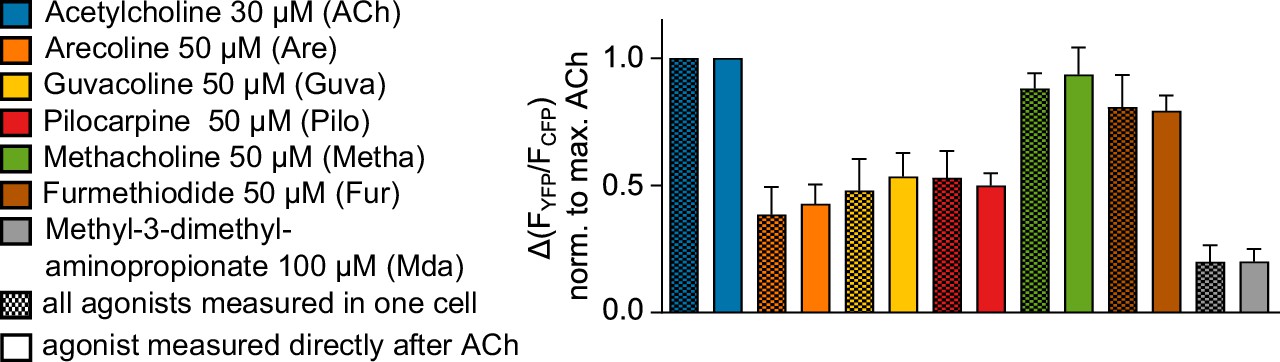
The sequence of measuring M3R-arrestin3 interaction for different agonists in the same cell does not influence the results.
M3R-arrestin3 interaction was measured as shown in Figure 1—figure supplement 3C. Saturating concentrations of each agonist were measured sequentially in the same cell after prestimulation with ACh as shown in Figure 2E. The resulting normalized amplitudes for each agonist (Figure 2F) were compared with the arrestin3 recruitment of each agonist directly after ACh stimulation as described in Figure 2C and Figure 2—figure supplement 2.
-
Figure 2—figure supplement 3—source data 1
Source data related to Figure 2—figure supplement 3.
- https://cdn.elifesciences.org/articles/58442/elife-58442-fig2-figsupp3-data1-v2.xlsx
Figure 3 with 2 supplements
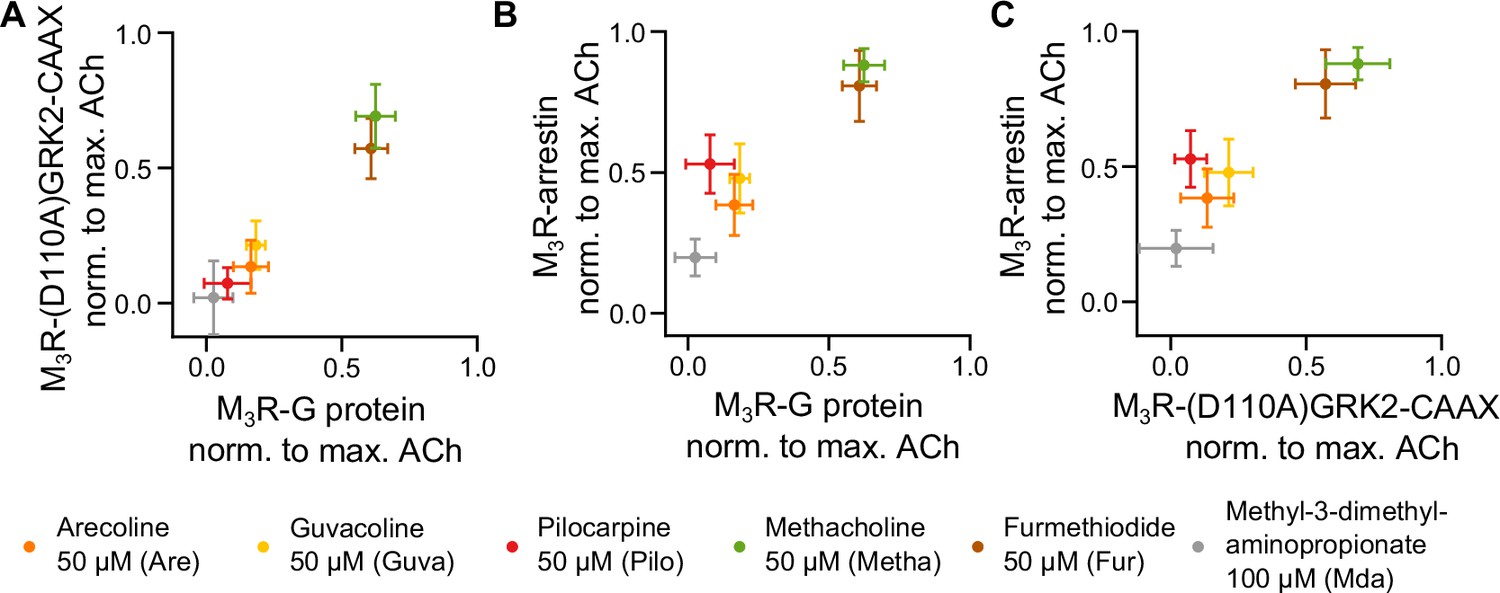
Measuring GRK2 recruitment disentangled from Gq reveals no bias between Gq and GRK2 recruitment to M3R.
Recruitment of Gq (data from Figure 1) was plotted in relation to (A) recruitment of (D110A)GRK2-CAAX and (B) recruitment of arrestin3 (data from Figure 2) for six agonists normalized to the maximum amplitude of ACh at a concentration of 30 µM. (C) The normalized M3R-arrestin3 recruitment was plotted in relation to the M3R-(D110A)GRK2-CAAX recruitment.
Figure 3—figure supplement 1
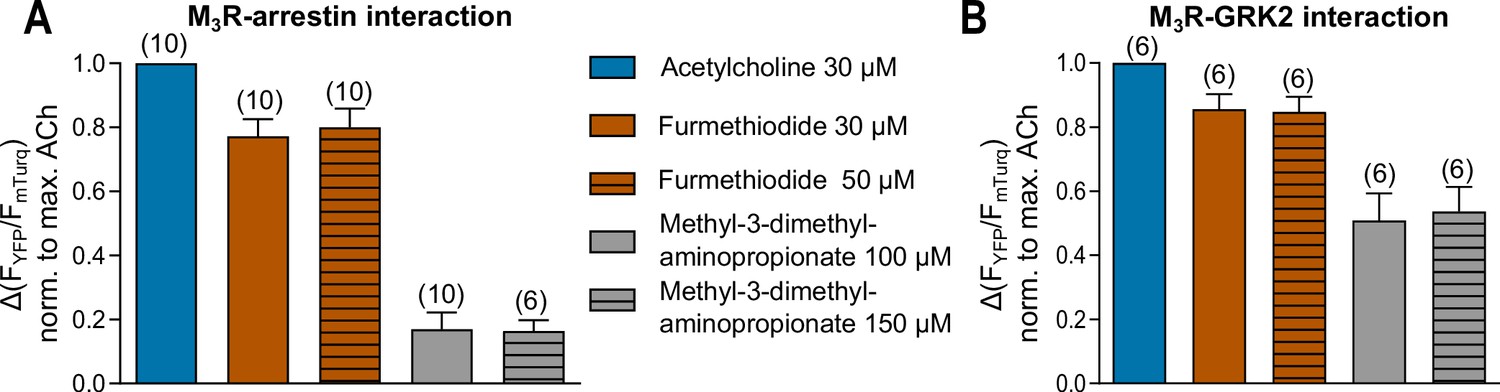
Förster resonance energy transfer (FRET)-based single-cell measurement of maximum response for Fur and Mda for (A) M3R-arrestin3 and (B) M3R-GRK2 interaction.
(A, B) The interaction with M3R was measured as shown in Figure 1—figure supplement 3. After a first stimulation with ACh, concentrations of Fur and Mda were measured in the same cell and each amplitude was normalized to the maximum response of ACh. Data are shown as mean ± SD. The number of experiments is indicated in parentheses.
-
Figure 3—figure supplement 1—source data 1
Source data related to Figure 3—figure supplement 1A, B.
- https://cdn.elifesciences.org/articles/58442/elife-58442-fig3-figsupp1-data1-v2.xlsx
Figure 3—figure supplement 2
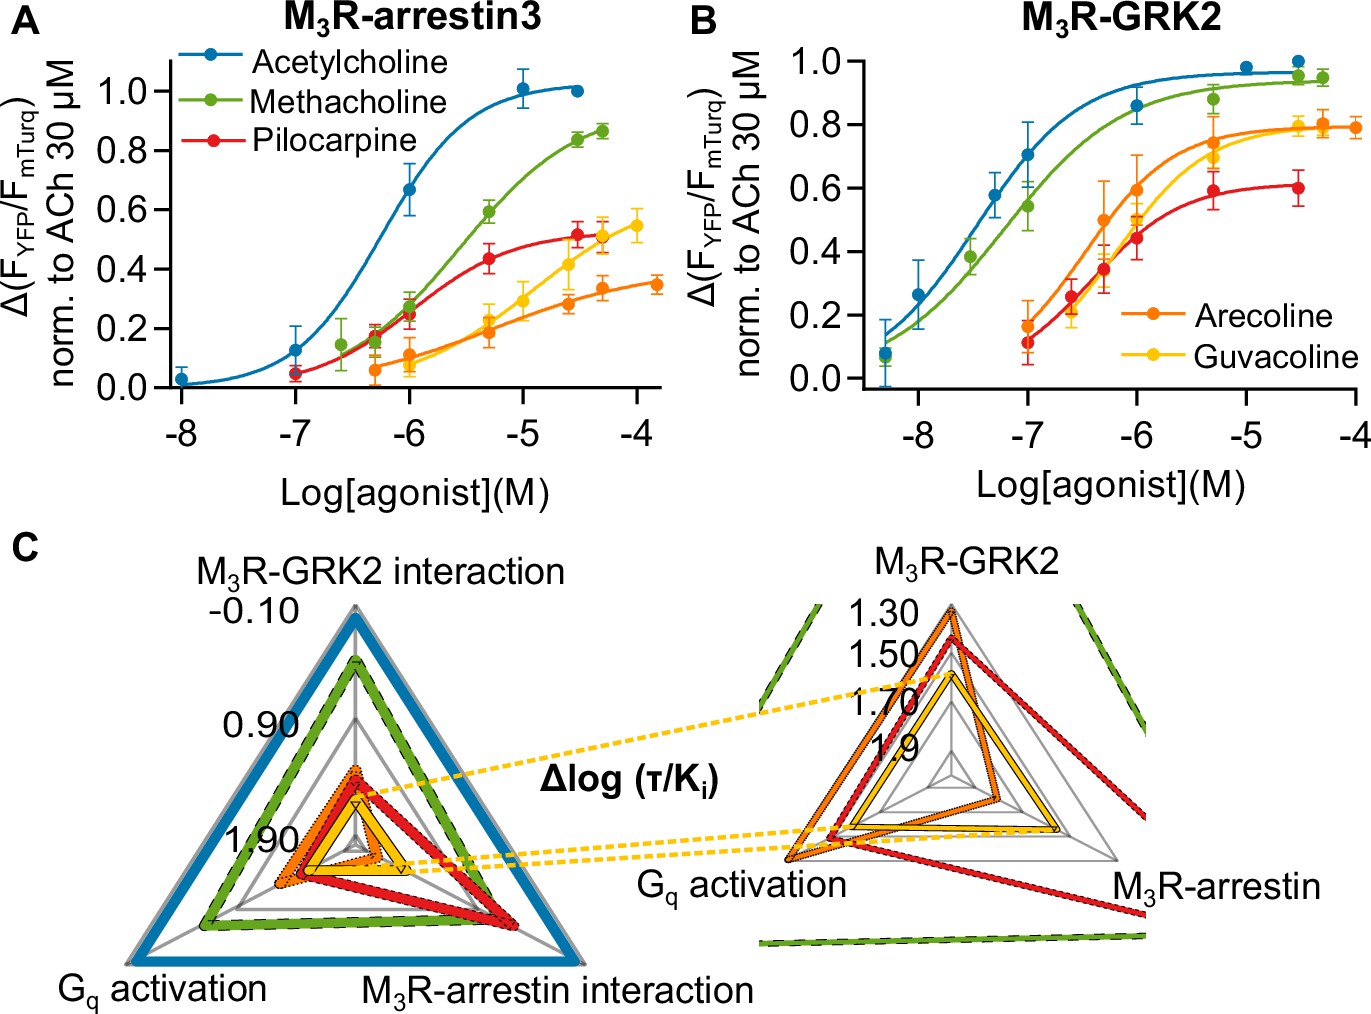
Identification of methacholine, pilocarpine, and arecoline as biased agonists at the M3R relative to ACh.
(A) After a first stimulation with ACh, increasing concentrations of agonist were measured in the same cell and each amplitude was normalized to the maximum response of ACh, n = 5–8. (B) Increasing concentrations of agonist were measured in the same cell and each amplitude was normalized to ACh, n = 5–7. All data are shown as mean ± SD. (C) Relative agonist activity of five agonists for Gq activation, M3R-arrestin3, and M3R-GRK2 recruitment. Data from (A), (B), and Figure 1—figure supplements 4 and 5 were used for the calculation. The Δlog (τ/Ki) values relative to ACh as reference agonist are plotted in a radar plot. τ was calculated according to the operational model by Black and Leff, 1997.
-
Figure 3—figure supplement 2—source data 1
Source data related to Figure 3—figure supplement 2A.
- https://cdn.elifesciences.org/articles/58442/elife-58442-fig3-figsupp2-data1-v2.xlsx
-
Figure 3—figure supplement 2—source data 2
Source data related to Figure 3—figure supplement 2B.
- https://cdn.elifesciences.org/articles/58442/elife-58442-fig3-figsupp2-data2-v2.xlsx
-
Figure 3—figure supplement 2—source data 3
Source data related to Figure 3—figure supplement 2C.
- https://cdn.elifesciences.org/articles/58442/elife-58442-fig3-figsupp2-data3-v2.xlsx
Author response image 1
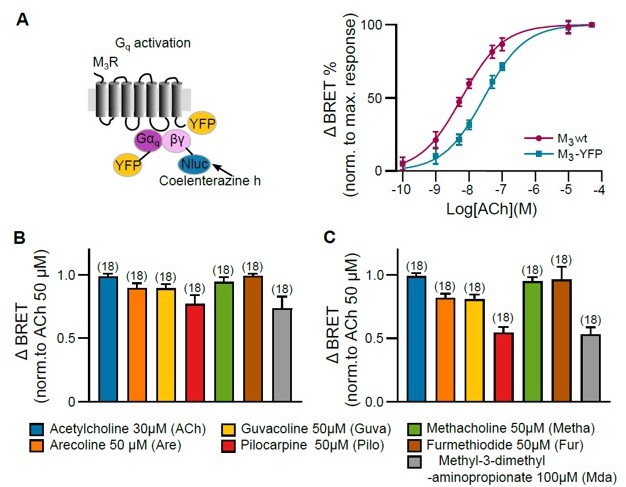
Gq activation of M3 wt and M3-YFP was measured with a BRET-based assay in HEK293T cells.
(A) Concentration-response curves of Gq activation with GRK2 overexpression were plotted for M3R wt and M3R-YFP. (B) M3R wt and (C) M3R-YFP Gq activation were measured with distinct concentrations of every agonist as indicated. After stimulating every well with agonist, a saturating concentration of ACh (50 µM) was applied. The BRET ratio after agonist application was normalized to the maximum response of ACh (50 µM) of every well. All data are plotted as mean values ± SD for each condition.
Tables
Key resources table
| Reagent type (species) or resource | Designation | Source or reference | Identifiers | Additional information |
|---|---|---|---|---|
| Chemical compound, drug | Acetylcholine iodide | Sigma-Aldrich | CAS number: 2260-50-6 | |
| Chemical compound, drug | Arecoline hydrobromide | TCI Chemicals | CAS number: 300-08-3 | |
| Chemical compound, drug | Methacholine chloride | TCI Chemicals | CAS number: 62-51-1 | |
| Chemical compound, drug | Guvacoline hydrobromide | TRC Canada | CAS number: 17210-51-4 | |
| Chemical compound, drug | Methyl-3-(dimethylamino) propionate | Sigma-Aldrich | CAS number: 3853-06-3 | |
| Chemical compound, drug | Pilocarpine hydrochloride | TCI Chemicals | CAS number: 54-71-7 | |
| Chemical compound, drug | Trimethyl-(5-methyl-furan-2-ylmethyl)-ammonium iodide | Sigma-Aldrich | CAS number: 1197-60-0 |
Additional files
Download links
A two-part list of links to download the article, or parts of the article, in various formats.
Downloads (link to download the article as PDF)
Open citations (links to open the citations from this article in various online reference manager services)
Cite this article (links to download the citations from this article in formats compatible with various reference manager tools)
Disentangling bias between Gq, GRK2, and arrestin3 recruitment to the M3 muscarinic acetylcholine receptor
eLife 10:e58442.
https://doi.org/10.7554/eLife.58442


