Epistatic selection on a selfish Segregation Distorter supergene – drive, recombination, and genetic load
- Department of Biology, University of Rochester, United States
- Ronin Institute, United States
Abstract
Meiotic drive supergenes are complexes of alleles at linked loci that together subvert Mendelian segregation resulting in preferential transmission. In males, the most common mechanism of drive involves the disruption of sperm bearing one of a pair of alternative alleles. While at least two loci are important for male drive—the driver and the target—linked modifiers can enhance drive, creating selection pressure to suppress recombination. In this work, we investigate the evolution and genomic consequences of an autosomal, multilocus, male meiotic drive system, Segregation Distorter (SD) in the fruit fly, Drosophila melanogaster. In African populations, the predominant SD chromosome variant, SD-Mal, is characterized by two overlapping, paracentric inversions on chromosome arm 2R and nearly perfect (~100%) transmission. We study the SD-Mal system in detail, exploring its components, chromosomal structure, and evolutionary history. Our findings reveal a recent chromosome-scale selective sweep mediated by strong epistatic selection for haplotypes carrying Sd, the main driving allele, and one or more factors within the double inversion. While most SD-Mal chromosomes are homozygous lethal, SD-Mal haplotypes can recombine with other, complementing haplotypes via crossing over, and with wildtype chromosomes via gene conversion. SD-Mal chromosomes have nevertheless accumulated lethal mutations, excess non-synonymous mutations, and excess transposable element insertions. Therefore, SD-Mal haplotypes evolve as a small, semi-isolated subpopulation with a history of strong selection. These results may explain the evolutionary turnover of SD haplotypes in different populations around the world and have implications for supergene evolution broadly.
Editor's evaluation
The work advances our understanding of the Segregation Distorter (SD) complex in Drosophila melanogaster. SD, the classic example of a selfish chromosome, consists of two tightly linked genetic elements and thus qualifies as a supergene. The work also excels through particularly careful analyses.
https://doi.org/10.7554/eLife.78981.sa0Introduction
Supergenes are clusters of linked loci that control variation in complex phenotypes. Some supergenes mediate adaptive polymorphisms that are maintained by some form of frequency- or density-dependent natural selection, as in, for example, mimicry in butterflies, self-incompatibility in plants, plumage polymorphisms in birds, and heteromorphic sex chromosomes (see Schwander et al., 2014; Thompson and Jiggins, 2014, for review). Other supergenes are maintained by selfish social behaviors that enhance the fitness of carriers at the expense of non-carriers, as in some ant species (Keller and Ross, 1998; Wang et al., 2013). Still other supergenes are maintained by their ability to achieve selfish, better-than-Mendelian transmission during gametogenesis, as in the so-called meiotic drive complexes found in fungi, insects, and mammals (Lyon, 2003; Larracuente and Presgraves, 2012; Lindholm et al., 2016; Svedberg et al., 2018; Fuller et al., 2020).
Meiotic drive complexes gain transmission advantages at the expense of other loci and their hosts. In heterozygous carriers of male drive complexes in animals, the driver disables spermatids that bear drive-sensitive target alleles (Larracuente and Presgraves, 2012; Lindholm et al., 2016). To spread in the population, the driver must be linked in a cis-arrangement to a drive-resistant (insensitive) target allele (Charlesworth and Hartl, 1978). Recombination between the driver and target can result in a ‘suicide’ haplotype that distorts against itself (Sandler and Carpenter, 1972; Hartl, 1974). These epistatic interactions between driver and target lead to selection for modifiers of recombination that tighten linkage, such as chromosomal inversions (Charlesworth and Hartl, 1978; Schwander et al., 2014; Thompson and Jiggins, 2014; Charlesworth, 2016). Like most supergenes (Charlesworth and Charlesworth, 1975; Turner, 1977), meiotic drive complexes originate from two or more loci with some degree of initial linkage. Successful drivers thus tend to be located in regions of low recombination, such as non-recombining sex chromosomes (Hamilton, 1967; Hurst and Pomiankowski, 1991), centromeric regions, or in chromosomal inversions of autosomes (Lyon, 2003; Larracuente and Presgraves, 2012; Lindholm et al., 2016; Svedberg et al., 2018).
The short-term benefits of reduced recombination can entail long-term costs. Chromosomal inversions that lock supergene loci together can also incidentally capture linked loci, which causes large chromosomal regions to segregate as blocks. Due to reduced recombination, the efficacy of natural selection in these regions is compromised: deleterious mutations can accumulate, and beneficial ones are more readily lost (Muller, 1964; Hill and Robertson, 1968; Felsenstein, 1974; Charlesworth et al., 2009). Many meiotic drive complexes are thus homozygous lethal or sterile. The degeneration of drive haplotypes is not inevitable, however. Different drive haplotypes that complement one another may be able to recombine, if only among themselves (Dod et al., 2003; Presgraves et al., 2009; Brand et al., 2015). Gene conversion from wildtype chromosomes may also ameliorate the genetic load of supergenes (Uyenoyama, 2005; Wang et al., 2013; Tuttle et al., 2016; Branco et al., 2018; Stolle et al., 2019; Brelsford et al., 2020). Male meiotic drive complexes thus represent a class of selfish supergenes that evolve and persist via the interaction of drive, recombination, and natural selection.
Here, we focus on the evolutionary genetics of Segregation Distorter (SD), a well-known autosomal meiotic drive complex in Drosophila melanogaster (Sandler et al., 1959). In heterozygous males, SD disables sperm bearing drive-sensitive wildtype chromosomes via a chromatin condensation defect (Hartl et al., 1967; Temin et al., 1991). SD has two main components: the driver, Segregation Distorter (Sd), is a truncated duplication of the gene RanGAP located in chromosome arm 2L (Powers and Ganetzky, 1991; Merrill et al., 1999; Kusano et al., 2001); and the target of drive, Responder (Rsp), is a block of satellite DNA in the pericentromeric heterochromatin of 2R. Previous studies of SD chromosomes have detected linked upward modifiers of drive, including Enhancer of SD (E[SD]) on 2L and several others on 2R (Sandler and Hiraizumi, 1960; Miklos, 1972; Ganetzky, 1977; Hiraizumi et al., 1980; Brittnacher and Ganetzky, 1984), but their molecular identities are unknown. Sd-RanGAP and Rsp straddle the centromere, a region of reduced recombination, and some SD chromosomes bear pericentric inversions that presumably further tighten linkage among these loci. In heterozygotes with a pericentric inversion, recombination in the inverted region generates aneuploids and therefore reduced fertility, although this effect might be mitigated by strong suppression of recombination (Coyne et al., 1993). Many SD chromosomes also bear paracentric inversions on 2R (reviewed in Lyttle, 1991; Larracuente and Presgraves, 2012). Although recombination between paracentric inversions and the main components of SD is possible, their strong association implies a role for epistatic selection in the evolution of these supergenes (Larracuente and Presgraves, 2012).
While SD is present at low population frequencies (<5%) around the world (Temin et al., 1991; Larracuente and Presgraves, 2012), Sd-RanGAP appears to have originated in sub-Saharan Africa, the ancestral geographic range of D. melanogaster, survived the out-of-Africa bottleneck, and spread to the rest of the world (Presgraves et al., 2009; Brand et al., 2015). Multiple factors likely contribute to the low frequency of SD in populations: negative selection, insensitive Rsp alleles, and unlinked suppressors (reviewed in Larracuente and Presgraves, 2012). Two independent longitudinal studies suggest that SD haplotypes can replace each other in populations over short time scales (<30 years) (Temin and Kreber, 1981; Brand et al., 2015) without major changes in the overall population frequency of SD (Temin and Kreber, 1981). The predominant SD variant in Africa is SD-Mal, which recently swept across the entire continent (Presgraves et al., 2009; Brand et al., 2015). SD-Mal has a pair of rare, African-endemic, overlapping paracentric inversions spanning ~40% of 2R:In(2R)51B6–11;55E3–12 and In(2R)44F3–12;54E3–10, hereafter collectively referred to as In(2R)Mal (Aulard et al., 2002; Presgraves et al., 2009). SD-Mal chromosomes are particularly strong drivers, with ~100% transmission. Notably, recombinant chromosomes bearing the Sd-RanGAP duplication from this haplotype but lacking the inversions do not drive (Presgraves et al., 2009), suggesting that In(2R)Mal is essential for SD-Mal drive. We therefore expect strong epistatic selection to enforce the association of Sd-RanGAP and In(2R)Mal. The functional role of In(2R)Mal for drive is still unclear: do these inversions function to suppress recombination between Sd-RanGAP and a major distal enhancer on 2R, or do they contain a major enhancer?
Here, we combine genetic and population genomic approaches to study SD-Mal haplotypes sampled from a single population in Zambia, the putative ancestral range of D. melanogaster (Pool et al., 2012). We address four issues. First, we reveal the structural features of the SD-Mal haplotype, including the organization of the insensitive Rsp allele and the In(2R)Mal rearrangements. Second, we characterize the genetic function of In(2R)Mal and its role in drive. Third, we infer the population genetic history of the rapid rise in frequency of SD-Mal in Zambia. And fourth, we explore the evolutionary consequences of reduced recombination on SD-Mal haplotypes. Our results show that SD-Mal experienced a recent chromosome-scale selective sweep mediated by epistatic selection and has, as a consequence of its reduced population recombination rate, accumulated excess non-synonymous mutations and transposable element (TE) insertions. The SD-Mal haplotype is a supergene that evolves as a small, semi-isolated subpopulation in which complementing SD-Mal chromosomes can recombine inter se via crossing over and with wildtype chromosomes via gene conversion. These results have implications for supergene evolution and may explain the enigmatic evolutionary turnover of SD haplotypes in different populations around the world.
Results and discussion
To investigate the evolutionary genomics of SD-Mal, we sequenced haploid embryos from nine driving SD-Mal haplotypes sampled from a single population in Zambia (Brand et al., 2015), the putative ancestral range of D. melanogaster (Pool et al., 2012). Illumina read depth among samples ranged between ~46 and 67× (Supplementary file 1; BioProject PRJNA649752 in NCBI). Additionally, we obtained ~12× coverage with long-read Nanopore sequencing of one homozygous viable line, SD-ZI125, to create a de novo assembly of a representative SD-Mal haplotype (BioProject PRJNA649752 in NCBI; assembly in Navarro-Dominguez et al., 2022a). We use these data to study the evolution of SD-Mal structure, diversity, and recombination.
Chromosomal features of the SD-Mal supergene
The SD-Mal haplotype has at least three key features: the main drive locus, the Sd-RanGAP duplication on 2L; an insensitive Responder (Rspi) in 2R heterochromatin; and the paracentric In(2R)Mal arrangement on chromosome 2R (Figure 1). We used our long-read and short-read sequence data for SD-ZI125 to confirm the structure of the duplication (Figure 1A) and then validated features in the other SD-Mal haplotypes. All SD-Mal chromosomes have the Sd-RanGAP duplication at the same location as the parent gene on chromosome 2L (see also Brand et al., 2015). The Rsp locus, the target of SD, corresponds to a block of ~120 bp satellite repeats in 2R heterochromatin (Figure 1B; Wu et al., 1988). The reference genome, Iso-1, has a Rsps allele corresponding to a primary Rsp locus containing two blocks of tandem Rsp repeats—Rsp-proximal and Rsp-major—with ~1000 copies of the Rsp satellite repeat interrupted by TEs (Khost et al., 2017). A small number of Rsp repeats exist outside of the primary Rsp locus, although they are not known to be targeted by SD. There are three of these additional Rsp loci in Iso-1: ~ 10 copies in 2R, distal to the major Rsp locus (Rsp-minor); a single copy at the distal end of 2R (60A); and ~12 copies in 3L (Houtchens and Lyttle, 2003; Larracuente, 2014; Khost et al., 2017). The genomes of SD flies carry ~20 copies of Rsp (Wu et al., 1988; Pimpinelli and Dimitri, 1989), but the organization of the primary Rsp locus on SD chromosomes is unknown. To characterize the Rsp locus of the SD-Mal haplotype, we mapped SD-Mal reads to an Iso-1 reference genome (see Khost et al., 2017). As expected, reads from Iso-1 reference are distributed across the whole Rsp-major region. For SD-Mal chromosomes, however, very few reads map to the Rsp repeats at the Rsp-major (Figure 1B). This suggests that all SD-Mal have a complete deletion of the primary Rsp locus containing Rsp-proximal and Rsp-major and that the only Rsp copies in the SD-Mal genomes are the minor Rsp loci in chromosomes 2R and 3L (Figure 1—figure supplement 1).
Figure 1 with 4 supplements see all
Map depicting the chromosomal features of the SD-Mal chromosome.
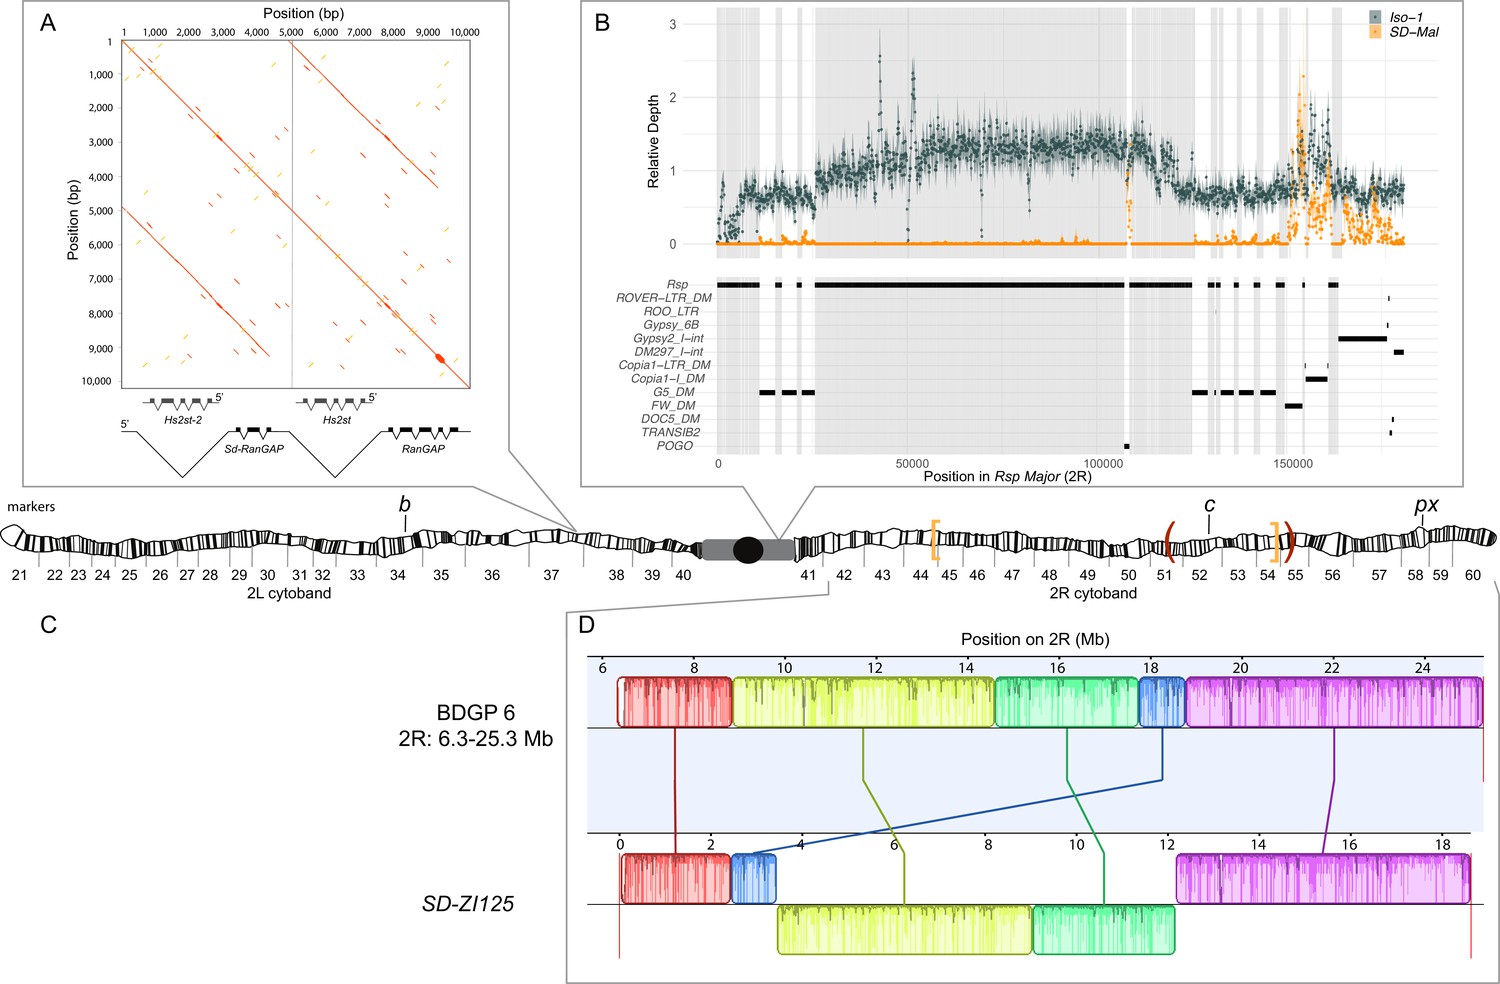
The schematic shows the cytogenetic map of chromosomes 2L and 2R (redrawn based on images in Lefevre, 1976) and the major features of the chromosome. (A) Dotplot showing that the Sd locus is a partial duplication of the gene RanGAP (in black), located at band 37D2-6. The gene Hs2st occurs in the first intron of RanGAP, and it is also duplicated in the Sd locus (Hs2st-2). (B) The Rsp-major locus is an array of tandem repeats located in the pericentric heterochromatin (band h39). Read mapping to a reference genome containing 2R pericentric heterochromatin (Iso1 strain, see Chang and Larracuente, 2019) shows that SD-Mal chromosomes do not have any Rsp repeats in the Rsp-major locus, consistent with being insensitive to distortion by Sd (Rspi) (orange, high relative coverage regions correspond to transposable element interspersed), in contrast with Iso-1, which is sensitive (Rsps). The tracks below indicate the presence of types of repetitive elements found at this locus. Black lines indicate the presence of a repeat type in the reference genome. Gray shading shows where Rsp repeats are in the reference genome. (C) Two paracentric, overlapping inversions constitute the In(2R)Mal arrangement shown on the schematic of polytene chromosomes: In(2R)51BC;55E (In(2R)Mal-p) in orange brackets and In(2R)44F;54E (In(2R)Mal-d) in red parentheses. Pericentromeric heterochromatin and the centromere are represented by a gray rectangle and black circle, respectively. (D) Our assembly based on long-read sequencing data provide the exact breakpoints of In(2R)Mal and confirms that the distal inversion (Dmel.r6, 2R:14,591,034–18,774,475) occurred first, and the proximal inversion (Dmel.r6, 2R:8,855,601–15,616,195) followed, overlapping ~1 Mb with the distal inversion. The colored rectangles correspond to locally collinear blocks of sequence with the height of lines within the block corresponding to average sequence conservation in the aligned region (Darling et al., 2010). Blocks below the center black line indicate regions that align in the reverse complement orientation. Vertical red lines indicate the end of the assembled chromosomes. Visible marker locations used for generating recombinants (b (34D1), c (52D1), and px (58E4-58E8)) are indicated on the cytogenetic map (Lefevre, 1976).
The complex In(2R)Mal inversion is distal to the Rsp locus on chromosome 2R (Figure 1C). We used our SD-ZI125 assembly to determine the precise breakpoints of these inversions. Relative to the standard D. melanogaster 2R scaffold (BDGP6), SD-ZI125 has three large, rearranged blocks of sequence corresponding to In(2R)Mal (Figure 1C): a 1.03 Mb block collinear with the reference but shifted proximally; a second inverted 5.74 Mb block; and a third inverted 3.16 Mb block. From this organization, we infer that the distal inversion, which we refer to as In(2R)Mal-d, occurred first and spanned 4.18 Mb (approx. 2R:14,591,003–18,774,475). The proximal inversion, which we refer to as In(2R)Mal-p, occurred second and spanned 6.76 Mb, with 1.02 Mb overlapping with the proximal region of In(2R)Mal-d (approx. 2R:8,855,602–17,749,310). Note that any rearrangement different than distal first, proximal second, leads to a different outcome (Figure 1—figure supplement 2). All four breakpoints of the In(2R)Mal rearrangement involve simple joins of unique sequence. Three of these four breakpoints span genes (Figure 1—figure supplement 3): sns (2R:8,798,489–8,856,091), CG10931 (2R:17,748,935–17,750,136), and Mctp (2R:18,761,758–18,774,824). The CDSs of both sns and Mctp remain intact in the In(2R)Mal arrangement, with the inversion disrupting their 3’ UTRs. Neither of these two genes is expressed in testes (https://flybase.org/reports/FBgn0024189; https://flybase.org/reports/FBgn0034389; Chintapalli et al., 2007; FB2021_06; Larkin et al., 2021), making it unlikely that they affect drive. In(2R)Mal-p disrupts the CDS of CG10931, which is a histone methyltransferase with high expression levels in testis (https://flybase.org/reports/FBgn0034274; Chintapalli et al., 2007; FB2021_06; Larkin et al., 2021). Even for genes that are not directly interrupted by the inversion breakpoints, the chromosomal rearrangements may disrupt the regulation of nearby genes if, for example, they affect the organization of topologically associating domains (TADs; reviewed in Spielmann et al., 2018). The In(2R)Mal inversion breakpoints disrupt physical domains reported in Hou et al., 2012, however inversion-mediated disruptions of TAD boundaries do not necessarily affect gene expression (Ghavi-Helm et al., 2019). Future work is required to determine if the inversions affect gene expression near the breakpoints and if CG10931 has a role in the SD-Mal drive phenotype.
In African populations, chromosomes bearing Sd but lacking In(2R)Mal do not drive (Presgraves et al., 2009; Brand et al., 2015). The functional role of In(2R)Mal in drive is, however, unclear. As expected, In(2R)Mal suppresses recombination: in crosses between a multiply marked chromosome 2, b c px, and SD-Mal (Figure 1—figure supplement 4), we find that In(2R)Mal reduces the b–c genetic distance by 54.6% and the c–px genetic distance by 92.4%, compared with control crosses between b c px and Oregon-R (Table 1). Our crosses confirm that In(2R)Mal is indeed required for drive: if we generate recombinants along an SD-Mal chromosome, all recombinants with both Sd and In(2R)Mal show strong drive (Table 2, rows 1 and 2), whereas none of the recombinants that separate Sd and In(2R)Mal drive (Table 2, rows 3 and 4). We conclude that SD-Mal drive requires both Sd and In(2R)Mal, which implies that one or more essential enhancers, or co-drivers, is located within or distal to In(2R)Mal.
Table 1
Frequency of recombinants along SD-Mal chromosomes vs. wildtype (OreR) chromosomes.
| Cross | N | n | nR (b–c) | nR (c–px) | d (b–c) | d (c–px) |
|---|---|---|---|---|---|---|
| OreR/b c px x b c px/b c px | 15 | 1,716 | 418 | 372 | 26.62 | 23.21 |
| SD-Mal/b c px x b c px/b c px | 11 | 1,820 | 211 | 32 | 11.81 | 1.76 |
-
N, number of crosses; n, total progeny scored; nR, number of recombinants, d, genetic distance in cM, Kosambi-corrected.
Table 2
Strength of segregation distortion in recombinants of SD-ZI125.
| Genotype | Markers | N | n | ±SE | k | ±SE | k* | ±SE | p-value (k* = 0.5) | |
|---|---|---|---|---|---|---|---|---|---|---|
| 1 | Sd In(2R)Mal | + + + and b + + | 112 | 90.3 | 6.03 | 0.99 | 0.00 | 0.98 | 0.00 | <0.0001 |
| 2 | Sd In(2R)Mal | + + px | 71 | 118.8 | 9.48 | 0.97 | 0.01 | 0.96 | 0.01 | <0.0001 |
| 3 | Sd In(2R)Mal+ | + c px | 19 | 147.6 | 14.39 | 0.54 | 0.01 | 0.51 | 0.01 | 0.3082 |
| 4 | Sd+ In(2R)Mal | b + + | 24 | 124.8 | 10.31 | 0.68 | 0.02 | 0.55 | 0.03 | 0.0572 |
| 5 | Sd+ In(2R)Mal+ | + c px | 65 | 120.4 | 8.32 | 0.53 | 0.01 | 0.51 | 0.01 | 0.3586 |
-
Chromosome 2 markers are black (b), curved (c), and plexus (px). N, number of crosses; n, average number of progeny from the crosses; SE, standard error; k, average proportion of progeny inheriting the recombinant SDr chromosome from SDr/b c px males; k*, average proportion of progeny inheriting the partial SDr chromosome from SDr/b c px males, corrected for viability. p-values reported by a single sample t-test with a null hypothesis of k* = 0.5, as expected for Mendelian segregation. b + + flies were PCR-genotyped for the presence (row 1) or absence (row 4) of Sd-RanGAP.
The temporal order of inversions (first In(2R)Mal-d, then In(2R)Mal-p) suggests two possible scenarios. In(2R)Mal-d, occurring first, may have captured the essential enhancer, with the subsequent In(2R)Mal-p serving to further reduce recombination between Sd and the enhancer. Alternatively, an essential enhancer may be located distal to In(2R)Mal-d, and the role of both In(2R)Mal inversions is to reduce recombination with Sd. To distinguish these possibilities, we measured drive in b+ Sd c+ In(2R)Mal px recombinants, which bear Sd and In(2R)Mal but have recombined between the distal breakpoint of In(2R)Mal (2R:18,774,475) and px (2R:22,494,297). All of these recombinants show strong drive (n = 71; Table 2, row 2). Assuming that recombination is uniformly distributed throughout the 3.72 Mb interval between the In(2R)Mal-d distal breakpoint and px, the probability of failing to separate an essential co-driver or distal enhancer among any of our 71 recombinants is <0.014. Furthermore, using molecular markers (see Materials and methods), we detected two recombinants within 100 kb of the distal breakpoint of In(2R)Mal, both with strong drive (k > 0.99; Supplementary file 2). We therefore infer that the co-driver resides inside or within 100 kb of the In(2R)Mal arrangement. More specifically, we speculate that the In(2R)Mal-d inversion both captured the co-driver and reduced recombination with Sd, whereas In(2R)Mal-p tightened linkage between centromere-proximal components of SD-Mal and In(2R)Mal-d.
Despite the recruitment of these inversions, recombination occurs readily between Sd and the proximal break of In(2R)Mal (Table 2; Presgraves et al., 2009; Brand et al., 2015). Nevertheless, we observe long-range linkage disequilibrium between Sd and In(2R)Mal. Among 204 haploid genomes from Zambia (Lack et al., 2016; see Materials and methods), we identified 198 wildtype haplotypes (Sd+ In(2R)Mal+), 3 SD-Mal haplotypes (Sd In(2R)Mal), and 3 recombinant haplotypes (three Sd In(2R)Mal+, zero Sd+ In(2R)Mal). While Sd and In(2R)Mal each have individually low sample frequencies (0.0294 and 0.0147, respectively), they tend to co-occur on the same chromosome (r2 = 0.493; Fisher’s exact p = 1.4 × 10⁻⁵). We calculated the expected decay of linkage disequilibrium between Sd and In(2R)Mal in the absence of any natural selection (Hill and Robertson, 1968), assuming a conservative sex-averaged recombination frequency corresponding to a map distance between Sd and In(2R)Mal of ~2.5 cM (FlyBase; FB2021_06; Larkin et al., 2021) and an effective population size of 106. Under these assumptions, the observed estimated coefficient of linkage disequilibrium, D = 0.0143, has an expected half-life of just ~28 generations (2.8 years) and, decays to negligible levels (i.e., expected D and r2 both ~10–3) in <100 generations (<10 years). We therefore conclude that the SD-Mal supergene haplotype is maintained by strong epistatic selection.
Rapid increase in frequency of the SD-Mal supergene
We used population genomics to infer the evolutionary history and dynamics of SD-Mal chromosomes. We called SNPs in our Illumina reads from nine complete SD-Mal haplotypes from Zambia (see Materials and methods). For comparison, we also analyzed wildtype (SD+) chromosomes from the same population in Zambia (Lack et al., 2016), including those with chromosome 2 inversions: 10 with the In(2L)t inversion and 10 with the In(2R)NS inversion (see Materials and methods). Table 3 shows that nucleotide diversity (π) is significantly lower on SD-Mal haplotypes compared to uninverted SD+ chromosome arms (Table 3; Figure 2A). The relative reduction in diversity on SD-Mal haplotypes is distributed heterogeneously: π is sharply reduced for a large region that spans ~25.8 Mb, representing 53% of chromosome 2 and extending from Sd-RanGAP on 2L (2L:19,441,959; Figure 2—figure supplement 1), across the centromere, and to ~2.9 Mb beyond the distal breakpoint of In(2R)Mal (2R:18,774,475; Table 3, rows 3, 5, and 6; Figure 2A). Thus, the region of reduced nucleotide diversity on SD-Mal chromosomes covers all the known essential loci for the drive phenotype: Sd-RanGAP, Rspi, and In(2R)Mal.
Table 3
Nucleotide diversity (π) on SD-Mal and SD+ chromosomes.
| π ( ± st. dev.) | p-value | ||||||
|---|---|---|---|---|---|---|---|
| Chr. | Region | SD+ | SD-Mal | SD+ × f | SD-Mal vs. SD+ | SD-Mal vs. SD+*f | |
| 1 | 2L | Distal to Sd-RanGAP | 1.03E-02 | 1.03E-02 | 1.52E-04 | 0.5727 | 0.00E + 00 |
| (±3.01E-03) | (±3.09E-03) | (±4.43E-05) | |||||
| 2 | 2L | Proximal to Sd-RanGAP | 4.44E-03 | 9.39E-05 | 6.52E-05 | 5.84E-90 | 0.0027 |
| (±2.75E-03) | (±1.66E-04) | (±4.04E-05) | |||||
| 3 | 2R | In(2R)Mal | 8.94E-03 | 7.97E-05 | 1.31E-04 | 0.00E + 00 | 1.42E-33 |
| (±2.95E-03) | (±1.18E-04) | (±4.33E-05) | |||||
| 4 | 2L-2R | SD-Mal supergene | 6.42E-03 | 7.98E-05 | 9.43E-05 | 0.00E + 00 | 2.60E-06 |
| (±4.03E-03) | (±1.32E-04) | (±5.92E-05) | |||||
-
Average nucleotide diversity (π) per site and empirical standard deviation estimated in 10-kb windows along chromosome 2, for SD+, SD-Mal, and SD+ scaled by the estimated frequency of SD-Mal chromosomes (SD+× f, where f = 1.47%). Outside of the linked region (row 1), πSD-Mal ~ πSD+. Inside of the linked region (rows 2–4), πSD-Mal < πSD+; even after scaling πSD+ by the frequency of SD-Mal in the population, πSD-Mal < πSD+× f. Due to non-independence of SNPs in non-recombining regions, we also estimated variance in π based on Charlesworth and Charlesworth, 2010; which is 5.30E-05 for In(2R)Mal and 6.27E-05 for the entire SD-Mal supergene. p-values reported by paired t-test between 10-kb windows.
Figure 2 with 2 supplements see all

Diversity on SD-Mal chromosomes.
(A) Average pairwise nucleotide diversity per site (π) and (B) Tajima’s D estimates in non-overlapping 10-kb windows along chromosome 2 in Zambian SD-Mal chromosomes (n = 9, orange) and SD+ chromosomes from the same population, bearing the cosmopolitan inversions In(2L)t (n = 10, dark blue) and In(2R)NS (n = 10, light blue). Regions corresponding to pericentric heterochromatin are shaded in gray and the centromere location is marked with a black circle. SD-Mal chromosomes show a sharp decrease in nucleotide diversity and skewed frequency spectrum from the Sd locus (Sd-RanGAP, 2L:19.4 Mb) to ~2.9 Mb beyond the distal breakpoint of In(2R)Mal.
The reduced nucleotide diversity among SD-Mal might be expected given its low frequency in natural populations (see below; Presgraves et al., 2009; Brand et al., 2015). SD persists at low frequencies in populations worldwide, presumably reflecting the balance between drive, negative selection, and genetic suppression and/or resistance (Hartl, 1975; Charlesworth and Hartl, 1978; Larracuente and Presgraves, 2012). If the SD-Mal supergene has been maintained at stable drive-selection-suppression equilibrium frequency for a long period of time, then its nucleotide diversity may reflect a mutation-drift equilibrium appropriate for its effective population size. Under this scenario, we expect diversity at the supergene to be similar to wildtype (SD+) diversity scaled by the long-term equilibrium frequency of SD. We estimated SD-Mal frequency to be 1.47% by identifying the Sd duplication and In(2R)Mal breakpoints in 204 haploid genomes from Zambia (3/204, comparable to Presgraves et al., 2009; Brand et al., 2015; data from Lack et al., 2016; see Materials and methods). To approximate our expectation under mutation-drift equilibrium, we scaled average π from the SD+ sample by 1.47% in 10-kb windows across the region corresponding to the SD-Mal supergene, defined as the region from Sd-RanGAP to the distal breakpoint of In(2R)Mal. While nucleotide diversity outside of the SD-Mal supergene region is comparable to SD+ (Table 3, row 1), diversity in the supergene region is significantly lower than expected even when scaled by its frequency (Table 3, row 4), suggesting that the low population frequency of SD-Mal cannot fully explain its reduced diversity. This observation suggests two possibilities: the SD-Mal supergene historically had an equilibrium frequency less than 1.47% in Zambia; or the SD-Mal supergene, having reduced recombination, has experienced hitchhiking effects due to background selection and/or a recent selective sweep.
To distinguish between these possibilities, we analyzed summaries of the site frequency spectrum. We find strongly negative Tajima’s D mirroring the distribution of reduced diversity, indicating an excess of rare alleles (Figure 2B). Such a skew in the site frequency spectrum suggests a recent increase in frequency of the SD-Mal supergene in Zambia. Given the low recombination frequency between SD-Mal and SD+ chromosomes, we treat them as two subpopulations and estimate their differentiation using Wright’s fixation index, FST. The high differentiation of SD-Mal from SD+ chromosomes from the same population similarly suggests a large shift in allele frequencies. FST in the SD-Mal supergene region is unusually high for chromosomes from the same population (Figure 3A). Neither of the SD+ chromosomes with cosmopolitan inversions show such high differentiation, and mean nucleotide differences (dXY) between SD-Mal and SD+ are comparable to the other inversions, implying that the differentiation of the SD-Mal supergene is recent. Our results—low diversity, strongly negative Tajima’s D, high FST and relatively low dXY—are thus consistent with a rapid increase in frequency of the SD-Mal haplotype that reduced nucleotide diversity within SD-Mal and generated large differences in allele frequencies with SD+ chromosomes (e.g., Charlesworth, 1998; Cruickshank and Hahn, 2014).
Figure 3

Differentiation between SD-Mal and wildtype chromosomes.
(A) Pairwise FST and (B) dXY per base pair in non-overlapping 10-kb windows along chromosome 2, between Zambian SD-Mal haplotypes (n = 9) and wildtype chromosomes from the same population, bearing the cosmopolitan inversions In(2L)t (n = 10) and In(2R)NS (n = 10). Regions corresponding to pericentric heterochromatin are shaded in gray and the centromere location is marked with a black circle.
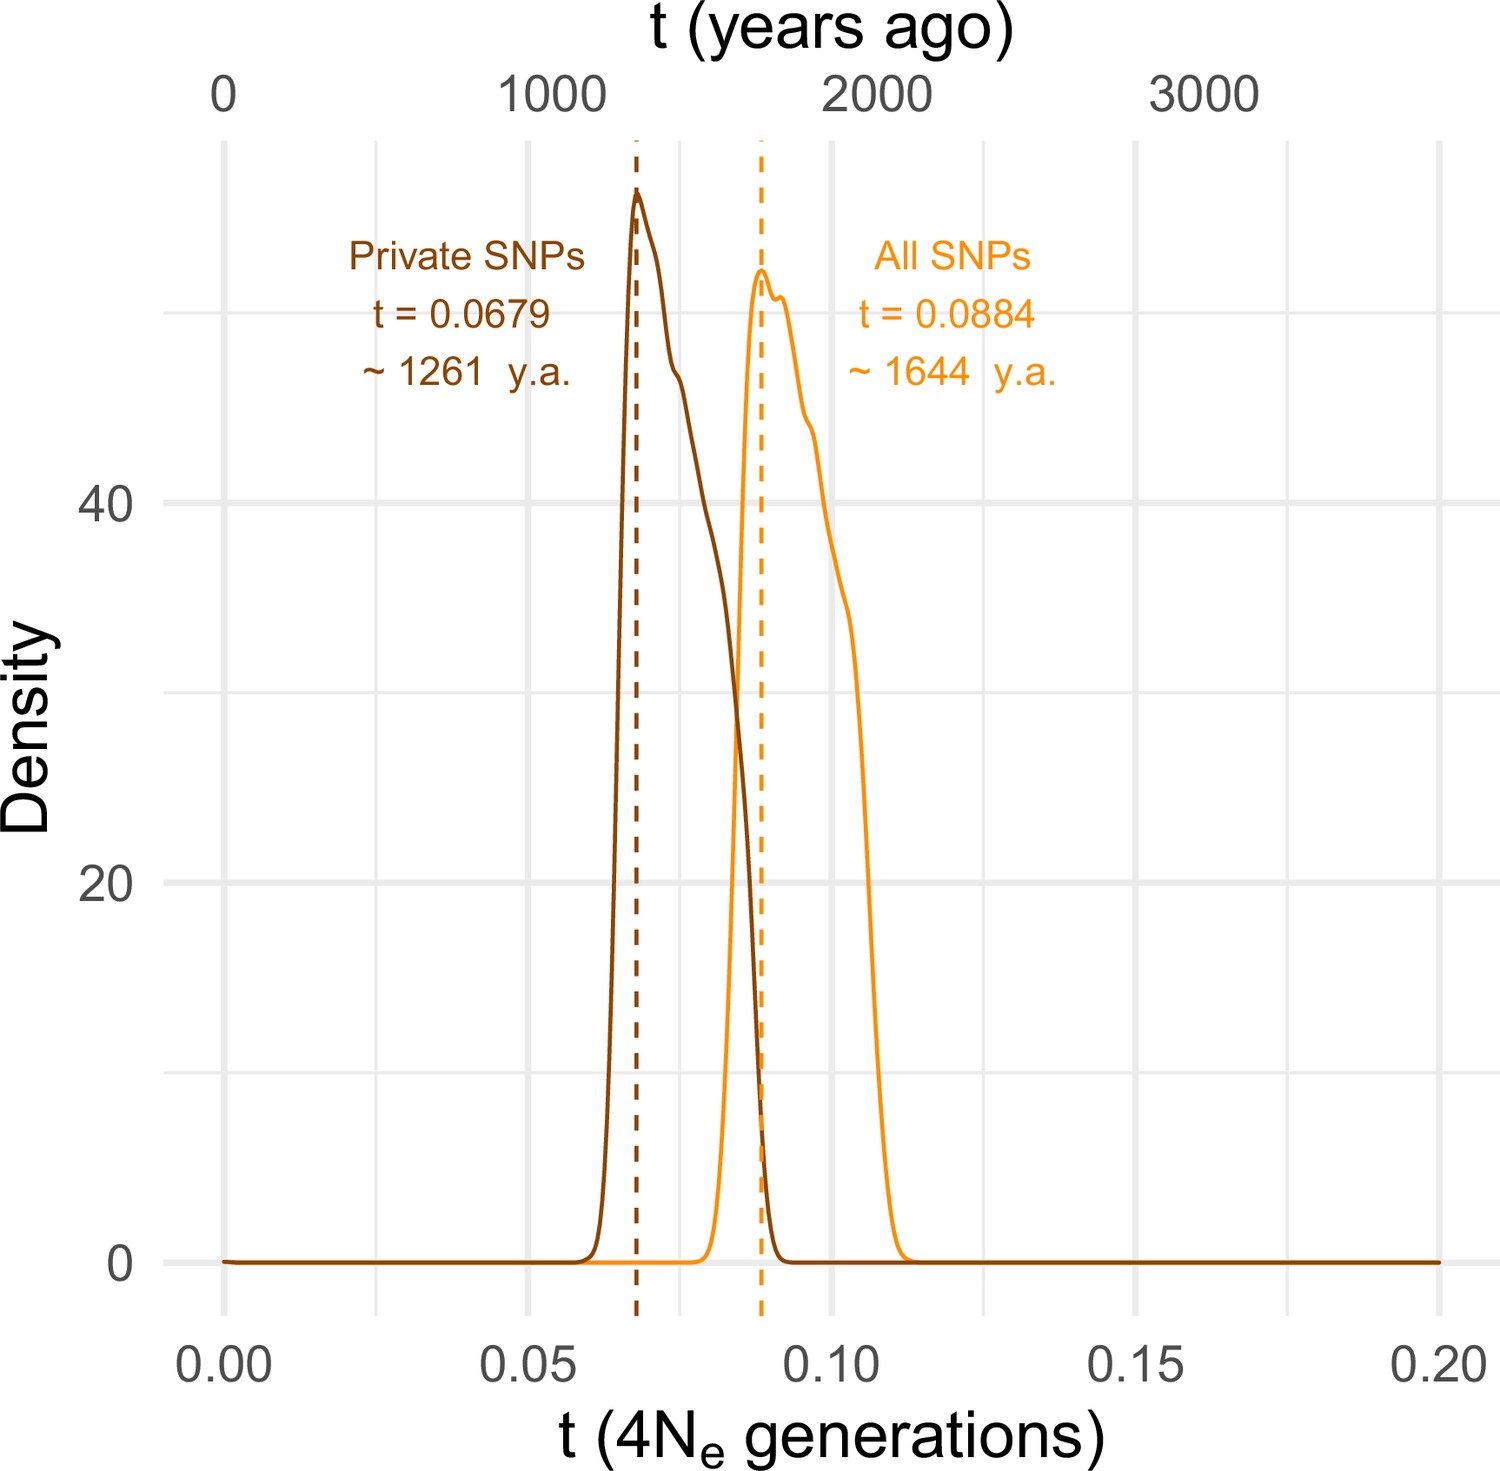
To estimate the timing of the recent expansion of the SD-Mal supergene, we used an approximate Bayesian computation (ABC) method with rejection sampling in neutral coalescent simulations. We do not know if SD chromosomes acquired In(2R)Mal in Zambia or if the inversions occurred de novo on an SD background. For our simulations, we assume that the acquisition of the second inversion (or the double inversion by crossover) was a unique event that enhanced drive strength and/or efficiency and that the onset of the selective sweep occurred following this event. Under this scenario, extant SD-Mal chromosomes have a single origin. We therefore simulated this history in a coalescent framework as an absolute bottleneck to a single chromosome. We performed simulations considering a sample size of n = 9 and assumed no recombination in the ~9.92 Mb region of In(2R)Mal. We simulated with values of S drawn from a uniform distribution ±5% of the observed number of segregating sites in non-coding regions of In(2R)Mal. We considered a prior uniform distribution of the time of the expansion (t) ranging from 0 to 4Ne generations (0–185,836 years ago), assuming that D. melanogaster Ne in Zambia 3,160,475 (Kapopoulou et al., 2018), a In(2R)Mal frequency of 1.47%, and 10 generations per year (Li and Stephan, 2006; Thornton and Andolfatto, 2006; Laurent et al., 2011; Kapopoulou et al., 2018). Using the ABC with rejection sampling conditional on our observed estimates of π and Tajima’s D for In(2R)Mal (πIn(2R)Mal = 584.60, D = –1.33; note that πIn(2R)Mal is an overall, unscaled estimate of nucleotide diversity for the whole In(2R)Mal region and that only non-coding regions were considered), we infer that the SD-Mal expansion began ~0.0884 (95% CIs 0.0837–0.1067) × 4Ne generations ago or, equivalently, ~1644 years ago (1.11% rejection sampling acceptance rate; Figure 4). To account for possible effects of gene conversion between SD and SD+ chromosomes (see below), we discarded SNPs shared with SD+ chromosomes (see below), and recalculated π and Tajima’s D using only private SNPs (πIn(2R)Mal = 427.72, D = –1.45). Based on these parameters, the estimated SD-Mal expansion occurred ~0.0679 (95% CIs 0.0647–0.0868) 4Ne generations ago, ~1261 years (1.02% rejection sampling acceptance rate; Figure 4). To calculate the posterior probability of the model, we performed 100,000 simulations under three models: a model assuming a stable frequency of SD-Mal; a model assuming an exponential growth of SD-Mal, based on parameters estimated for Zambia (Kapopoulou et al., 2018); and a selective sweep model (assuming tall = 0.0884 and tshared_excl = 0.0679) (Figure 4—figure supplement 1). The simulated data are inconsistent with a long-term stable frequency of SD-Mal (all SNPs, pπ = 0.0522, pD = 0.096; private, pπ = 0.0266, pD = 0.0668) or long-term exponential growth (all SNPs, pπ = 0.0465, pD = 0.0907; private, pπ = 0.0215, pD = 0.0605). Instead, our simulations suggest that a recent selective sweep is more consistent with the data (all SNPs, pπ = 0.3554, pD = 0.5952; private, pπ = 0.3480, pD = 0.6142). Taken together, evidence from nucleotide diversity, the site frequency spectrum, population differentiation, and coalescent simulations suggests a rapid non-neutral increase in frequency of the SD-Mal supergene that began <2000 years ago.
Figure 4 with 1 supplement see all
Estimating the time since the SD-Mal selective sweep.
Approximate Bayesian computation (ABC) estimates based on 10,000 posterior samples place the onset of the selective sweep between 0.0884 (95% CI 0.0837–0.1067) and 0.0679 (0.0647–0.0868) × 4Ne generations, that is, ~1261–1644 years ago, considering recent estimates of Ne in Zambia from Kapopoulou et al., 2018, frequency of SD-Mal in Zambia 1.47% and 10 generations per year. Estimates were done considering only In(2R)Mal, where crossing over is rare and only occurs between SD-Mal chromosomes, using all SNPs and excluding shared SNPs in order to account for gene conversion from SD+ chromosomes.
The sweep signal on the SD-Mal haplotypes begins immediately distal to Sd-RanGAP on 2L and extends ~3 Mb beyond the distal boundary of In(2R)Mal on 2R. To understand why the sweep extends so far beyond the In(2R)Mal-d distal breakpoint, we consider three, not mutually exclusive, possibilities. First, chromosomal inversions can suppress recombination ~1–3 Mb beyond their breakpoints (in both multiply inverted balancer chromosomes, [Miller et al., 2016; Crown et al., 2018; Miller et al., 2018] and natural inversions [Stevison et al., 2011; Fuller et al., 2017]), extending the size of the sweep signal. To determine the extent of recombination suppression caused by In(2R)Mal, we estimated recombination rates in the region distal to the inversion. The expected genetic distance between the distal breakpoint of In(2R)Mal (2R:18.77 Mb) and px (2R:22.49 Mb) is ~13.87 cM (Fiston-Lavier et al., 2010). Measuring recombination between SD-Mal and standard arrangement chromosomes for the same (collinear) interval, we estimate a genetic distance of ~1.76 (Table 1), an 87.3% reduction. In(2R)Mal strongly reduces recombination beyond its distal boundary. Second, although we have inferred that the essential enhancer(s) reside(s) within the In(2R)Mal inversion (see above), we have not excluded the possibility of weak enhancers distal to the inversion which might contribute to the sweep signal. We find that SD-Mal chromosomes with In(2R)Mal-distal material recombined away (b+ Sd c+ In(2R)Mal px) have modestly but significantly lower drive strength (k = 0.96 vs. 0.98; Table 2, lines 1–2), suggestive of one or more weak distal enhancers. Third, there may be mutations distal to In(2R)Mal that contribute to the fitness of SD-Mal haplotypes but without increasing the strength of drive, for example, compensatory mutations that ameliorate the effects of SD-Mal-linked deleterious mutations.
Most supergenes show long-range LD, reduced nucleotide diversity, and differentiation when compared with their wildtype counterparts. While some meiotic drive supergenes show evidence of recurrent selective sweeps (Dyer et al., 2007) or a signature of epistatic selection without strong selective sweeps (Fuller et al., 2020), others show no signatures of recent or ongoing positive selection (Kelemen and Vicoso, 2018). The relatively recent origin (~38.5 kya; Brand et al., 2015) of SD might explain the constant turnover, as there may not have been enough time to reach a stable equilibrium compared to older drive systems like the t-haplotype, whose first inversion arose 3 mya (Hammer and Silver, 1993).
Recombination on SD-Mal supergenes
While nearly all SD-Mal haplotypes are individually homozygous lethal and do not recombine with wildtype chromosomes in and around In(2R)Mal, ~90% of pairwise combinations of different SD-Mal chromosomes (SDi/SDj) are viable and fertile in complementation tests (Presgraves et al., 2009; Brand et al., 2015). Therefore, recombination via crossing over may occur between SD-Mal chromosomes in SDi/SDj heterozygous females. To determine if SD-Mal chromosomes recombine, we estimated mean pairwise linkage disequilibrium (r2) between SNPs located within the In(2R)Mal arrangement. We found that mean r2 between pairs of SNPs declines as a function of the physical distance separating them (Figure 5A), a hallmark of recombination via crossing over (Hill and Robertson, 1968; Miyashita and Langley, 1988; Schaeffer and Miller, 1993; Awadalla et al., 1999; Conway et al., 1999). Pairwise LD is higher and extends further in In(2R)Mal than in the equivalent region of SD+ chromosomes or in any of the other two cosmopolitan inversions, In(2L)t and In(2R)NS (Figure 5A). This pattern is not surprising: the low frequency of SD-Mal makes SDi/SDj genotypes, and hence the opportunity for recombination, rare. (The smaller sample size of SD (n = 9) vs. SD+ (n = 10) may also contribute weakly to its higher estimated LD.) To further characterize the history of recombination between SD-Mal haplotypes, we used 338 non-singleton, biallelic SNPs in In(2R)Mal to trace historical crossover events. From these SNPs, we estimate that Rm (Hudson and Kaplan, 1985), the minimum number of recombination events, in this sample of SD-Mal haplotypes is 15 (Figure 5C). Thus, assuming that these SD-Mal haplotypes are ~16,436 generations old (Figure 4), we estimate that recombination events between SD-Mal haplotypes occur a minimum of once every ~1096 generations. We can thus confirm that crossover events are relatively rare, likely due to the low population frequency of SD-Mal and the possibly reduced fitness of SDi/SDj genotypes.
Figure 5
Recombination on SD-Mal haplotypes.
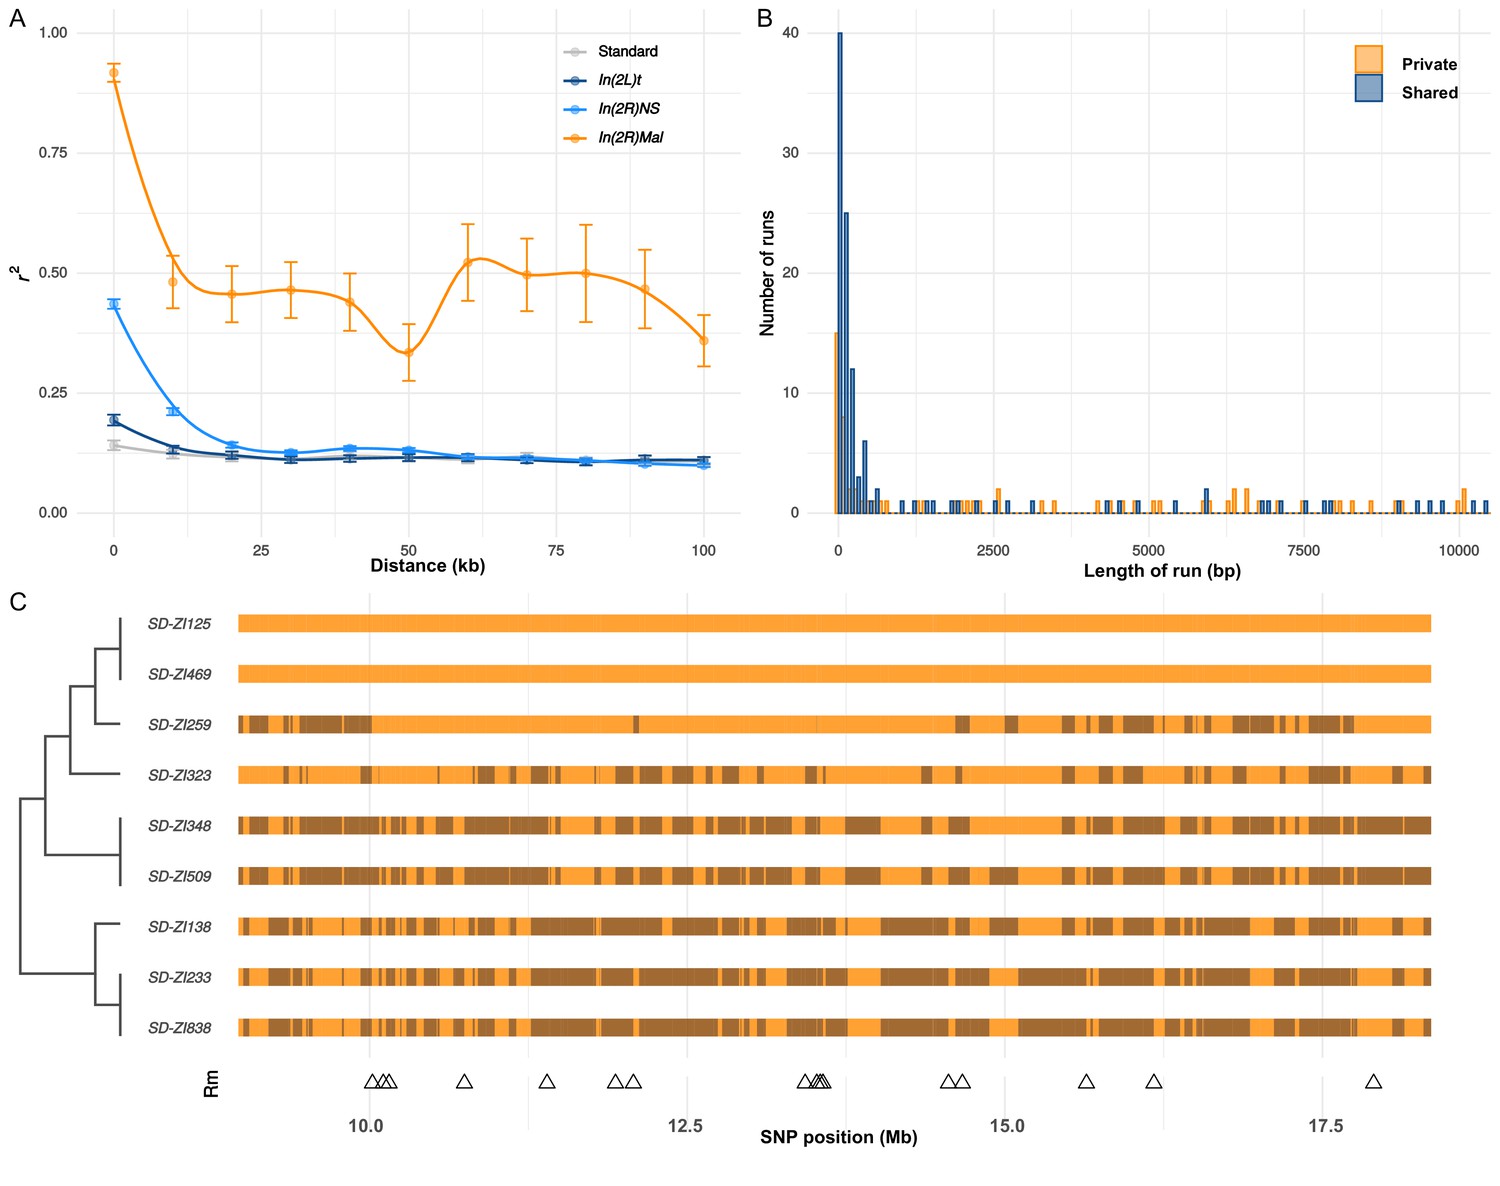
(A) Linkage disequilibrium (r2) as a function of distance in 10-kb windows, measured in In(2R)Mal (n = 9), In(2L)t (n = 10), In(2R)NS (n = 10), and the corresponding region of In(2R)Mal in a standard, uninverted 2R chromosome (n = 10). (B) Histogram of length of runs of SNPs in In(2R)Mal shows that a high proportion of shared SNPs concentrate in runs shorter than 1 kb. (C) Chromosomal configuration of the 338 non-singleton SNPs in nine different SD-Mal lines. Color coded for two states (same in light orange or different in dark orange) using SD-ZI125 as reference. Locations of minimal number of recombination events are labeled as triangles at the bottom. Maximum likelihood tree is displayed on the left.
While crossing over is suppressed in SD-Mal/SD+ heterozygotes, gene conversion and/or double crossover events may still occur, accounting for the shared SNPs between SD-Mal and SD+ chromosomes within In(2R)Mal. As both events exchange tracts of sequence, we expect shared SNPs to occur in runs of sites at higher densities than private SNPs, which should be distributed randomly. Accordingly, in In(2R)Mal, SNP density is five times higher for runs of shared SNPs (0.63 SNPs/kb) than for runs of SD-private SNPs (0.12 SNPs/kb), as expected if SD+ chromosomes, which have higher SNP densities, were donors of conversion tract sequences. Although we cannot exclude the contribution of double crossovers, we note that 62.2% (89 out of 143) of the shared SNP runs are <1 kb, 80.4% (115 out of 143) are <10 kb (Figure 5B), and the longest run is ~50.2 kb. These sizes are more consistent with current estimates of gene conversion tract lengths in D. melanogaster than with double cross-overs (Comeron et al., 2012; Miller et al., 2016). Surprisingly, these inferred gene conversion events are unevenly distributed across In(2R)Mal, being more frequent in the In(2R)Mal-p than in In(2R)Mal-d (Supplementary file 3). Our discovery that SD-Mal haplotypes can recombine with each other distinguishes the SD-Mal supergene from supergenes that are completely genetically isolated (Wang et al., 2013; Charlesworth, 2016; Tuttle et al., 2016). The lack of crossing over with SD+ chromosomes, however, means that SD-Mal haplotypes evolve as a semi-isolated subpopulation, with a nearly 100-fold smaller Ne and limited gene flow from SD+ via gene conversion events. The reduced recombination, low Ne, and history of epistatic selection may nevertheless lead to a higher genetic load on SD-Mal than SD+ chromosomes. We therefore examined the accumulation of deleterious mutations, including non-synonymous mutations and TEs, on the SD-Mal supergene.
Consequences of reduced recombination, small effective size, and epistatic selection
We first studied the effects of a reduced efficacy of selection on SNPs in In(2R)Mal. As many or most non-synonymous polymorphisms are slightly deleterious (Ohta, 1976; Fay et al., 2001; Eyre-Walker et al., 2002; Keightley and Eyre-Walker, 2007; Eyre-Walker and Keightley, 2009), relatively elevated ratios of non-synonymous to synonymous polymorphisms (N/S ratio) can indicate a reduced efficacy of negative selection. For the SNPs in In(2R)Mal, the overall N/S ratio is 2.3-fold higher than that for the same region of SD+ chromosomes (Table 4). Notably, the N/S ratio for private SNPs is 3.1-fold higher (Table 4), whereas the N/S ratios for shared SNPs do not significantly differ from SD+ chromosomes (Table 4, Figure 6—figure supplement 1). These findings suggest that gene conversion from SD+ ameliorates the accumulation of potentially deleterious non-synonymous mutations on SD-Mal chromosomes (see also Kelemen and Vicoso, 2018; Pieper and Dyer, 2016).
Table 4
Synonymous and non-synonymous SNPs.
| Genotype | N | S | N/S | Fold change | p-value | |
|---|---|---|---|---|---|---|
| All SNPs | SD-Mal | 79 | 114 | 0.69 | 2.27 | <0.0001 |
| SD+ | 10,470 | 34,301 | 0.31 | |||
| Private SNPs | SD-Mal | 61 | 55 | 1.11 | 3.10 | <0.0001 |
| SD+ | 6782 | 18,938 | 0.36 | |||
| Shared SNPs | SD-Mal | 18 | 59 | 0.31 | 1.27 | 0.3722 |
| SD+ | 3688 | 15,363 | 0.24 |
-
Counts of non-synonymous (N) and synonymous (S) SNPs in the In(2R)Mal region of SD-Mal chromosomes, and the equivalent region of uninverted, SD+ chromosomes. N/S ratio per genotype, fold-change of N/S ratios between SD-Mal and SD+. p-values reported by Pearson’s χ2 test of independence.
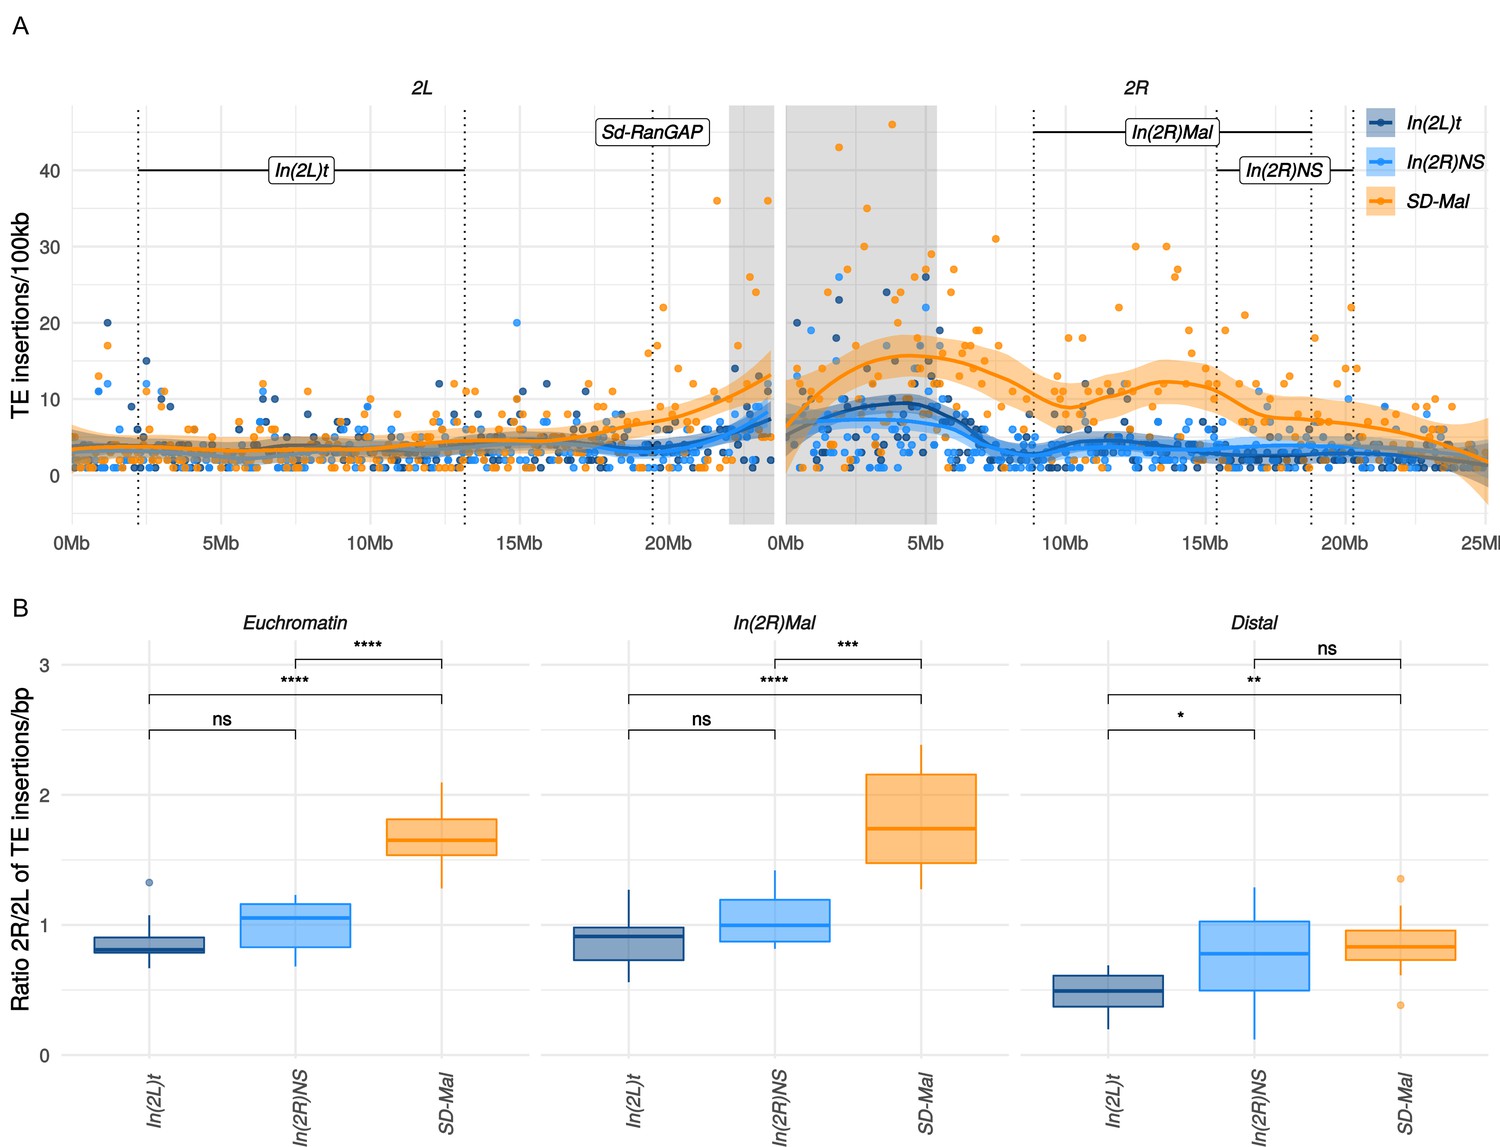
Gene conversion may not, however, rescue SD-Mal from deleterious TEs insertions, as average TE length exceeds the average gene conversion tract length (Kaminker et al., 2002). TEs accumulate in regions of reduced recombination, such as centromeres (Charlesworth et al., 1994) and inversions, especially those at low frequency (Eanes et al., 2009; Sniegowski and Charlesworth, 1994). Indeed, TE densities for the whole euchromatic region of chromosome 2R are significantly higher for SD-Mal compared to SD+ chromosomes (Figure 6A). This increased TE density on SD-Mal is driven by the low recombination regions of the haplotype: In(2R)Mal has significantly higher TE density than SD+ whereas the distal region of 2R outside of the sweep region does not (Figure 6B). The most overrepresented families in In(2R)Mal relative to standard chromosomes are M4DM, MDG1, ROO_I, and LINE elements (Figure 6—figure supplement 2)—TEs that are currently or recently active (Kaminker et al., 2002; Kofler et al., 2015; Diaz-González and Dominguez, 2020)—consistent with the recent origin of the SD-Mal haplotype. Thus, the differences in shared vs. private SNPs suggests that gene conversion from SD+ chromosomes may slow the accumulation of deleterious point mutations but not the accumulation of TEs. Despite occasional recombination, the small Ne of SD-Mal haplotypes has incurred a higher genetic load.
Figure 6 with 3 supplements see all
Transposable elements (TEs) on SD-Mal haplotypes.
(A) Number of TE insertions per 100-kb windows along chromosome 2 in Zambian SD chromosomes (n = 9, orange) and wildtype chromosomes from the same population, bearing the cosmopolitan inversions In(2L)t (n = 10, dark blue) and In(2R)NS (n = 10, light blue). (B) Ratio of the number of insertions in the euchromatin of 2R to 2L per library. The relative enrichment in TEs in 2R of SD-Mal haplotypes is mostly due to an increase of TE insertions in non-recombining regions of the chromosome. Asterisks denote significance, p-values estimated by a Kruskal-Wallis test (threshold for significance p = 0.05).
Conclusions
Supergenes are balanced, multigenic polymorphisms. Under the classic model of supergene evolution, epistatic selection among component loci favors the recruitment of recombination modifiers that reinforce the linkage of beneficial allelic combinations. The advantages of reduced recombination among strongly selected loci can however compromise the efficacy of selection at linked sites. Supergenes thus provide opportunities to study the interaction of recombination and natural selection. We have studied a population of selfish supergenes, the SD-Mal haplotypes of Zambia, to investigate the interplay of recombination, selection, and meiotic drive. Our findings demonstrate, first, that the SD-Mal supergene extends across ~25.8 Mb of D. melanogaster chromosome 2, a region that comprises the driving Sd-RanGAP, a drive-insensitive deletion at the major Rsp locus, and the In(2R)Mal double inversion. Second, using genetic manipulation, we show that SD-Mal requires Sd-RanGAP and an essential co-driver that localizes almost certainly within the In(2R)Mal rearrangement, and probably within the distal inversion. These data provide experimental evidence for epistasis between Sd-RanGAP and In(2R)Mal: neither allele can drive without the other. Third, we provide population genomics evidence that epistatic selection on loci spanning the SD-Mal supergene region drove a very recent, chromosome-scale selective sweep. These patterns are consistent with recurrent episodes of replacement of one SD haplotype by others (Presgraves et al., 2009; Brand et al., 2015). Fourth, despite rare crossovers among complementing SD-Mal haplotypes and gene conversion from wildtype chromosomes, the relative genetic isolation and low frequency of SD-Mal results in the accumulation of deleterious mutations including, especially, TE insertions. From these findings, we conclude that the SD-Mal supergene population is of small effective size, semi-isolate from the greater population of wildtype chromosomes, and subject to bouts of very strong selection.
Non-recombining supergenes that exist exclusively in heterozygous state tend to degenerate, as in the case of Y chromosomes (reviewed in Charlesworth and Charlesworth, 2000) and some autosomal supergenes which, for different reasons, lack any opportunity for recombination (Uyenoyama, 2005; Wang et al., 2013; Tuttle et al., 2016; Branco et al., 2018; Stolle et al., 2019; Brelsford et al., 2020). But not all supergenes are necessarily expected to degenerate. In SD-Mal, for instance, complementing SD-Mal haplotypes can recombine via crossing over, if rarely, and gene flow from wildtype SD+ to SD-Mal chromosomes can occur via gene conversion. In the mouse t-haplotype, there is similar evidence for occasional recombination between complementing t-haplotypes (Dod et al., 2003) and with standard chromosomes, probably via gene conversion (Herrmann et al., 1987; Erhart et al., 2002; Wallace and Erhart, 2008; Kelemen and Vicoso, 2018). Despite the many parallels characterizing supergenes, their ultimate evolutionary fates depend on the particulars of the system.
Materials and methods
Fly lines, library construction, and sequencing
Request a detailed protocolWe sequenced haploid embryos using the scheme in Langley et al., 2011, which takes advantage of a mutation, ms(3)K81 (Fuyama, 1984), which causes the loss of the paternal genome early in embryonic development. We crossed SD-Mal/CyO stocks generated in Brand et al., 2015 to homozygous ms(3)K81 males and allowed them to lay eggs overnight. We inspected individual embryos under a dissecting scope for evidence of development and then isolated them for whole genome amplification using the REPLI-g Midi kit from Qiagen (catalog number 150043). For each WGA DNA sample, we tested for the presence of Sd-RanGAP using PCR (primers from Presgraves et al., 2009). We prepared sequencing libraries for Illumina sequencing with TruSeq PCR free 350 bp. We assessed library quality using a BioAnalyzer and sequenced with HiSeq2500 2 × 150 bp reads (TruSeq) or 2 × 125 bp reads (Nextera). To trim reads, we used Trimgalore v0.3.7 and the parameters: q 28 --length 20 --paired -a GATCGGAAGAGCACACGTCTGAACTCCAGTCAC -a2 GATCGGAAGAGCGTCGTGTAGGGAAAGAGTGT --phred33 --fastqc --retain_unpaired -r1 21 r2 21 --dont_gzip --length 20. Trimmed reads are available in SRA (Bioproject PRJNA649752, SRA accession numbers in Supplementary file 1, Sheet 1).
We sequenced a total of 10 SD-Mal genomes. One of these genomes (SD-ZI157) was Sd-In(2R)Mal+, non-driving, and therefore excluded from further analysis. Out of the remaining nine driving SD-Mal chromosomes, one of them (SD-ZI138) had lower depth than the other eight (Supplementary file 1, Sheet 2) in the main chromosome arms but unusually high depth in the mitochondrial genome. We ran additional analyses dropping SD-ZI138 and show that including this sample does not affect our main conclusions (Supplementary file 5; Sheet 2).
For the Nanopore library, we extracted High-Molecular-Weight DNA from ~200 frozen female SD-ZI125/SD-ZI125 virgins. We extracted DNA using a standard phenol-chloroform method and spooled DNA using capillary tubes. We constructed a library with ~1 μg DNA using RAD004 kit and the ultra-long read sequencing protocol (Quick, 2018). We sequenced the library using R9.4 flow cells and called bases with the ONT Albacore Sequencing Pipeline Software version v2.2.10.
Estimating Rsp copy number
Request a detailed protocolWe mapped Zambian SD reads to an assembly containing 2R pericentric heterochromatin (Chang and Larracuente, 2019), including the Rsp locus detailed in Khost et al., 2017, with bowtie2 v2.3.5 (Langmead and Salzberg, 2012). We estimated mean per-window and per-Rsp repeat depth using mosdepth v0.2.9 (Pedersen and Quinlan, 2018). Coordinates for Rsp repeats were based on annotations in Khost et al., 2017.
In(2R)Mal breakpoints
Request a detailed protocolTo assemble SD-ZI125, we filtered Nanopore reads using Porechop (v0.2.3) and Filtlong (--min_length 500) to remove adapters and short reads (https://github.com/rrwick/Porechop [Wick et al., 2017; Wick, 2017a] and https://github.com/rrwick/Filtlong [Wick, 2017b]). We were left with a total of 1,766,164,534 bases in 327,248 filtered reads. We performed de novo assemblies with the Nanopore reads using Flye v2.3.7 (Kolmogorov et al., 2019) with parameters ‘-t 24 g 160 m --nano-raw’ and wtdbg v2.2 (Ruan and Li, 2020) with parameters ‘-p 19 -AS 1 s 0.05 L 0 -e 1’. We independently polished these two assemblies 10 times with Pilon v1.22 (Walker et al., 2014) using paired-end Illumina reads. Lastly, we reconciled these two polished assemblies using quickmerge v0.3 (Chakraborty et al., 2016) using the flye assembly as the reference with the command ‘python merge_wrapper.py wtdbg assembly flye assembly’. We aligned the contig containing the euchromatin on SD-ZI125 to chromosome 2R of the D. melanogaster (BDGP6) genome using Mauve (Darling et al., 2010). We defined the breakpoints according to the block rearrangement shown in Figure 1. To validate these breakpoints, we designed primers anchored at both sides of the most external breakpoints of In(2R)Mal (Supplementary file 4) for PCR.
Measuring genetic distances along SD-Mal and strength of distortion in the recombinants
Request a detailed protocolTo estimate recombination frequencies and obtain SD-Mal recombinant genotypes, we used a D. melanogaster stock al[1] dpy[ov1] b[1] pr[1] c[1] px[1] sp[1], from Bloomington Drosophila Stock Center (RRID:BDSC_156), which has three visible, recessive markers on chromosome 2 that are informative about recombinants involving SD: black (b, 2L: 13.82), curved (c, 2R:15.9), and plexus (px, 2R:22.49). As our SD flies are white-eyed, we did not score purple (pr, an eye color phenotype). All crosses were transferred to fresh vials after 5 days, and then adults were removed from the second vial after 5 days. Progeny emerging from the crosses were scored for up to 20 days following the cross.
To generate SD-Mal recombinant chromosomes, we crossed 8–10 b c px/b c px virgin females to 3–5 SD-ZI125 males, recovered SD-ZI125/b c px virgins, then backcrossed 8–10 of them to 3–5 b c px homozygous males (Figure 1—figure supplement 4). To estimate genetic distance between the visible markers, we scored the number of recombinants in 11 crosses (n = 1820). To compare genetic distance in SD-Mal to wildtype chromosomes, we estimated the number of recombinants from 15 crosses between OregonR/b c px females to b c px/b c px males (n = 1716).
We recovered three types of recombinant chromosomes from SD-ZI125/b c px x b c px/b c px crosses: b Sd+ c+ In(2R)Mal px+; b+ Sd c In(2R)Mal+ px and b+ Sd c+ In(2R)Mal px (Figure 1—figure supplement 4). We crossed 3–5 virgin b c px/b c px females to individual recombinant males of each type, and scored the proportion of progeny carrying the recombinant chromosome (k = nrecombinant/ntotal). To distinguish distortion from viability effects, we also measured transmission of recombinant chromosomes through females, as drive is male-specific. We used these crosses to measure relative viability (w = nrecombinant/nbcpx). We then used w to calculate a viability-corrected strength of distortion in males (k* = nrecombinant/(wnbcpx + nrecombinant)) (Powers and Ganetzky, 1991).
To check for recombination close to the inversion breakpoints, we amplified two regions between the distal breakpoint of In(2R)Mal (2R:18:77) and px (2R:22.49), corresponding to the genes sano (2R:18.87; F primer: GGACCATTTCTAGGGCATCA, R primer: AATGAAACGTCCCCTCTTTG) and CG15666 (2R:21.34; F primer: GGCCTATTGCGAGAGAACTG, R primer: TGCTTCCTTGATCTCGTCCT). Primers were designed so that they yield amplicons of different length in SD-Mal and SD+.
Estimate of the frequency of SD-Mal in the DPGP3 dataset
Request a detailed protocolTo estimate the frequency of In(2R)Mal in a random sample of Zambian chromosomes, we mapped the 204 Illumina paired-end libraries from the DPGP3 dataset (Lack et al., 2016) to the D. melanogaster (BDGP6) genome, using bwa-mem (v0.7.9a), and we visually looked for an accumulation of discordant read pairs surrounding the estimated breakpoints of In(2R)Mal. To test the reliability of this method, we also applied it to detect cosmopolitan inversions In(2L)t and In(2R)NS and compared our inversion calls with the most recent inversion calls for the DPGP3 dataset (http://johnpool.net/Updated_Inversions.xls, last accessed 07/13/2020), getting a 98% and 99% of concordance for In(2L)t and In(2R)NS, respectively. To determine the frequency of the Sd-RanGAP duplication in the DPGP3 dataset, we applied a similar method around the breakpoints of the Sd-RanGAP duplication (see Supplementary file 5).
SNP calling and annotation
Request a detailed protocolFor SNP calling, we mapped the Illumina reads from our SD-Mal libraries and the 20 SD+ libraries from the DPGP3 dataset to D. melanogaster (BDGP6) genome (ftp://ftp.ensembl.org/pub/release-88/fasta/drosophila_melanogaster/dna/; last accessed o6/25/20) using BWA mem (v0.7.9a). We removed duplicated reads with Picard (2.0.1) and applied the GATK (3.5) ‘best practices’ pipeline for SNP calling. We did local realignment and base score recalibration using SNPs data from DPGP1 ensembl release 88 (ftp://ftp.ensembl.org/pub/release-88/variation/vcf/drosophila_melanogaster/; last accessed 06/25/20). To call SNPs and indels, we used HaplotypeCaller and performed joint genotyping for each of the five genotypes using GenotypeGVCFs. SNPs filtered with following parameters: ‘QD <2.0 || FS >60.0 || MQ <40.0 || MQRankSum <–12.5 || ReadPosRankSum <–8.0’. We annotated SNPs as synonymous or non-synonymous using SNPeff (4.3, Cingolani et al., 2012) with the integrated D. melanogaster database (dmel_r6.12) database and parsed these annotations with SNPsift (Cingolani et al., 2012). To classify the SNPs as ‘shared’ between SD-Mal, SD+In(2L)t and SD+In(2R)NS, or ‘private’ to each one of them, we used BCFtools intersect (1.6; Danecek et al., 2021).
Population genomics analysis
Request a detailed protocolWe wrote a Perl script to estimate S, π, Tajima’s D, FST, and dXY in windows across the genome (available here: https://github.com/bnavarrodominguez/sd_popgen; Navarro-Dominguez, 2022b, copy archived at swh:1:rev:e012c1df579871600334847e254a1ecc6c053592). To calculate FST values, we used the Weir-Cockerham estimator (Weir and Cockerham, 1984). Only those sites with a minimum sample depth of 8 were included in the FST and Tajima’s D calculations. We determined window size by the number of ‘acceptable sample depth’ sites (and not, for example, a particular range of chromosome coordinates). As Tajima’s D is sensitive to the numbers of segregating sites in a sample (Schaeffer, 2002), we also estimated D/Dmin; that is, the ratio of Tajima’s D to its theoretical minimum (Dmin) when all sites in a window are singletons (Tajima, 1989; Figure 2—figure supplement 2). To confirm that repeats were not interfering with our results, we ran our population genomics pipeline masking SNPs in repetitive elements identified by RepeatMasker (Smit et al., 2013), which yielded equivalent results (Supplementary file 6, Sheet 1).
Age of the sweep
Request a detailed protocolWe calculated overall SIn(2R)Mal, πIn(2R)Mal and Tajima’s DIn(2R)Mal from the SD-Mal SNP set using our same Perl script (available here: https://github.com/bnavarrodominguez/sd_popgen), using a single window of 9.5 Mb within the boundaries of In(2R)Mal. To account for gene conversion, we calculated an additional set of summary statistics masking the SNPs annotated as shared by at least one of the SD+ libraries. We estimated the time since the most recent selective sweep using an ABC method with rejection sampling. We modeled the selective sweep as an absolute bottleneck (Nt = 1) at some time (t, 4Ne generations) in the past. We performed simulations in ms (Hudson, 2002), considering a sample size of 9 and assuming no recombination in the ~9.92 Mb of In(2R)Mal. To enrich for neutral mutations, we only considered non-coding SNPs in intergenic and intronic regions. We simulated with values of SSim drawn from a uniform distribution ±5% of SIn(2R)Mal. We considered a prior uniform distribution of time of the sweep (t) ranging from 0 to 4Ne generations, that is, 0–185,836 years ago, considering D. melanogaster Ne in Zambia 3,160,475 (Kapopoulou et al., 2018), frequency of In(2R)Mal 1.47% and 10 generations per year. The rejection sampling algorithm is as follows: (1) draw SSim and t from prior distributions; (2) simulate 1000 samples using the coalescent under a selective sweep model; (3) calculate average summary statistics for drawn SSim and t; (4) accept or reject chosen parameter values conditional on |πIn(2R)Mal − πSim| ≤ ε, |DIn(2R)Mal − DSim| ≤ ε; (5) return to step 1 and continue simulations until m desired samples from the joint posterior probability distribution are collected. For estimates of t, ε was set to 5% of the observed values of the summary statistics (in step 4) and m was set to 10,000. These simulations were performed with parameters calculated using all the SNPs in non-coding regions of In(2R)Mal and also excluding SNPs shared with SD+ chromosomes to account for gene conversion. We simulated 100,000 samples with the resulting estimated t and SIn(2R)Mal, under our sweep model, under a constant size population model, and under an exponential growth model. For the growth model, we assumed an exponential growth rate of α = 0.26, based on parameters estimated for Zambia (exponential growth from past Ne = 1,137,712 to present Ne = 3,160,475 in the last 72,005 years) (Kapopoulou et al., 2018), scaling Ne by the frequency of SD-Mal in Zambia (1.47%). We calculated two-sided p-values for π and Tajima’s D using an empirical cumulative probability function (ecdf) in R (R Development Core Team, 2019). We estimated the maximum a posteriori estimate as the posterior mode and 95% credibility intervals (CIs) in R (R Development Core Team, 2019).
Recombination
Request a detailed protocolFor estimates of recombination, we filtered the SNPs in In(2R)Mal to variable positions genotyped in all of the nine ZI-SD samples and excluded singletons, resulting in a total of 338 SNPs. We estimated pairwise linkage disequilibrium (r2) using PLINK v1.9 (Purcell et al., 2007). We discarded r2 data calculated for pairs of SNPs flanking the internal In(2R)Mal breakpoints. For comparison, we estimated pairwise linkage disequilibrium in the same region of In(2R)Mal for SD+ uninverted 2R chromosome arms and, for comparison, in SD+ In(2R)NS inversion and in SD+ In(2L)t inversions. For SD+ chromosomes, we applied the same filters (variable, non-singleton SNPs), plus an SNP ‘thinning’ to 1 SNPs/kb to get a manageable set of results. To investigate the possibility of crossing over between SD-Mal chromosomes, we used RecMin (Myers and Griffiths, 2003) to estimate the minimum number of crossovers between the 338 biallelic, non-singleton SNPs in In(2R)Mal. RecMin input is a binary file, which we generated using SD-ZI125 as an arbitrary reference for SD, assigning 0 or 1 on each position depending on if it was the same base or different. Maximum likelihood trees to establish relationships between SD-Mal haplotypes based on these 338 SNPs were estimated using RAxML-NG (Kozlov et al., 2019).
Runs of shared and private SNPs were identified in R, using all SNPs (including singletons). A run of SNPs is defined as a region from 5’ to 3’ where all the SNPs are in the same category (shared or private). Distance between the first and the last SNP of a category is considered length of the run. The region between the last SNP of a category and the first SNP of the alternative category is considered distance between runs. Because our sample size is small, we may underestimate the number of shared SNPs, as some private SNPs may be shared with some SD+ chromosomes that we have not sampled.
TE calling
Request a detailed protocolWe used a TE library containing consensus sequences of Drosophila TE families (Chang and Larracuente, 2019). With this library, we ran RepeatMasker (Smit et al., 2013) to annotate reference TEs in the D. melanogaster (BDGP6) genome. To detect genotype-specific TE insertions in our Illumina libraries, we used the McClintock pipeline (Nelson et al., 2017), which runs six different programs with different strategies for TE calling. We collected the redundant outputs from RetroSeq (Keane et al., 2013), PoPoolationTE (Kofler et al., 2012), ngs_te_mapper (Linheiro et al., 2012), TE-Locate (Platzer et al., 2012), and TEMP (Zhuang et al., 2014), discarded the calls produced by TEMP based on non-evidence of absence, and then merged the insertions detected by all different programs, considering the same insertion those of the same TE closer than a distance of ±600 bp, as described in Bast et al., 2019. To reduce false positives, we only considered TE insertion calls that were predicted by more than one of the methods. To account for differences in library read number and/or length between datasets, we report the TE counts for 2R normalized by the TE count for chromosome 2L for the same library (Figure 6B). To assess whether library differences qualitatively affect our results, we repeated the above TE analysis on a set of 3 million randomly selected paired-end reads, trimmed to a fixed length of 75 bp, from each library and report TE count for chromosomes 2R and 2L separately (Figure 6—figure supplement 3).
Data availability
Raw sequence data are deposited in NCBI's short read archive under project accession PRJNA649752. All code for data analysis and figure generation is available in Github (https://github.com/bnavarrodominguez/sd_popgen, copy archived at swh:1:rev:e012c1df579871600334847e254a1ecc6c053592). Data and code will be deposited in Dryad digital repository.
-
Dryad Digital RepositoryEpistatic selection on a selfish Segregation Distorter supergene: drive, recombination, and genetic load.https://doi.org/10.5061/dryad.4qrfj6qch
References
-
Linkage disequilibrium and recombination in hominid mitochondrial DNAScience (New York, N.Y.) 286:2524–2525.https://doi.org/10.1126/science.286.5449.2524
-
Origin, evolution, and population genetics of the selfish Segregation Distorter gene duplication in European and African populations of Drosophila melanogasterEvolution; International Journal of Organic Evolution 69:1271–1283.https://doi.org/10.1111/evo.12658
-
Theoretical genetics of Batesian mimicry II. Evolution of supergenesJournal of Theoretical Biology 55:305–324.https://doi.org/10.1016/s0022-5193(75)80082-8
-
Measures of divergence between populations and the effect of forces that reduce variabilityMolecular Biology and Evolution 15:538–543.https://doi.org/10.1093/oxfordjournals.molbev.a025953
-
The degeneration of Y chromosomesPhilosophical Transactions of the Royal Society of London. Series B, Biological Sciences 355:1563–1572.https://doi.org/10.1098/rstb.2000.0717
-
Genetic recombination and molecular evolutionCold Spring Harbor Symposia on Quantitative Biology 74:177–186.https://doi.org/10.1101/sqb.2009.74.015
-
Twelve years of SAMtools and BCFtoolsGigaScience 10:giab008.https://doi.org/10.1093/gigascience/giab008
-
Quantifying the slightly deleterious mutation model of molecular evolutionMolecular Biology and Evolution 19:2142–2149.https://doi.org/10.1093/oxfordjournals.molbev.a004039
-
Estimating the rate of adaptive molecular evolution in the presence of slightly deleterious mutations and population size changeMolecular Biology and Evolution 26:2097–2108.https://doi.org/10.1093/molbev/msp119
-
Gynogenesis in Drosophila melanogasterThe Japanese Journal of Genetics 59:91–96.https://doi.org/10.1266/jjg.59.91
-
On the components of segregation distortion in Drosophila melanogasterGenetics 86:321–355.
-
Linkage disequilibrium in finite populationsTheoretical and Applied Genetics 38:226–231.https://doi.org/10.1007/BF01245622
-
Generating samples under a Wright-Fisher neutral model of genetic variationBioinformatics (Oxford, England) 18:337–338.https://doi.org/10.1093/bioinformatics/18.2.337
-
The Demographic History of African Drosophila melanogasterGenome Biology and Evolution 10:2338–2342.https://doi.org/10.1093/gbe/evy185
-
Assembly of long, error-prone reads using repeat graphsNature Biotechnology 37:540–546.https://doi.org/10.1038/s41587-019-0072-8
-
RAxML-NG: a fast, scalable and user-friendly tool for maximum likelihood phylogenetic inferenceBioinformatics (Oxford, England) 35:4453–4455.https://doi.org/10.1093/bioinformatics/btz305
-
A Thousand Fly Genomes: An Expanded Drosophila Genome NexusMolecular Biology and Evolution 33:3308–3313.https://doi.org/10.1093/molbev/msw195
-
Fast gapped-read alignment with Bowtie 2Nature Methods 9:357–359.https://doi.org/10.1038/nmeth.1923
-
FlyBase: updates to the Drosophila melanogaster knowledge baseNucleic Acids Research 49:D899–D907.https://doi.org/10.1093/nar/gkaa1026
-
Approximate Bayesian analysis of Drosophila melanogaster polymorphism data reveals a recent colonization of Southeast AsiaMolecular Biology and Evolution 28:2041–2051.https://doi.org/10.1093/molbev/msr031
-
BookA photographic representation and interpretation of the polytene chromosomes of Drosophila melanogaster salivary glandsIn: Ashburner M, Novitski E, editors. The Genetics and Biology of Drosophila. Springer. pp. 31–66.
-
The Ecology and Evolutionary Dynamics of Meiotic DriveTrends in Ecology & Evolution 31:315–326.https://doi.org/10.1016/j.tree.2016.02.001
-
Transmission Ratio Distortion in MiceAnnual Review of Genetics 37:393–408.https://doi.org/10.1146/annurev.genet.37.110801.143030
-
Segregation distortersAnnual Review of Genetics 25:511–581.https://doi.org/10.1146/annurev.ge.25.120191.002455
-
The genetic structure of chromosomes carrying segregation-distorterCanadian Journal of Genetics and Cytology 14:235–243.https://doi.org/10.1139/g72-030
-
The Molecular and Genetic Characterization of Second Chromosome Balancers in Drosophila melanogasterG3: Genes, Genomes, Genetics 8:1161–1171.https://doi.org/10.1534/g3.118.200021
-
The relation of recombination to mutational advanceMutation Research 106:2–9.https://doi.org/10.1016/0027-5107(64)90047-8
-
SoftwareSNP calling and annotation, version swh:1:rev:e012c1df579871600334847e254a1ecc6c053592Software Heritage.
-
McClintock: An Integrated Pipeline for Detecting Transposable Element Insertions in Whole-Genome Shotgun Sequencing DataG3: Genes, Genomes, Genetics 7:2763–2778.https://doi.org/10.1534/g3.117.043893
-
Role of very slightly deleterious mutations in molecular evolution and polymorphismTheoretical Population Biology 10:254–275.https://doi.org/10.1016/0040-5809(76)90019-8
-
Mosdepth: quick coverage calculation for genomes and exomesBioinformatics (Oxford, England) 34:867–868.https://doi.org/10.1093/bioinformatics/btx699
-
Occasional recombination of a selfish X-chromosome may permit its persistence at high frequencies in the wildJournal of Evolutionary Biology 29:2229–2241.https://doi.org/10.1111/jeb.12948
-
PLINK: a tool set for whole-genome association and population-based linkage analysesAmerican Journal of Human Genetics 81:559–575.https://doi.org/10.1086/519795
-
SoftwareR: A Language and Environment for Statistical ComputingR Foundation for Statistical Computing, Vienna, Austria.
-
Fast and accurate long-read assembly with wtdbg2Nature Methods 17:155–158.https://doi.org/10.1038/s41592-019-0669-3
-
ConferenceA note on the chromosomal site of action of SD in Drosophila melanogasterEdinburgh Symposium on the Genetics of the Spermatozoon. pp. 247–268.
-
Supergenes and complex phenotypesCurrent Biology 24:R288–R294.https://doi.org/10.1016/j.cub.2014.01.056
-
Structural variation in the 3D genomeNature Reviews Genetics 19:453–467.https://doi.org/10.1038/s41576-018-0007-0
-
Effects of Inversions on Within- and Between-Species Recombination and DivergenceGenome Biology and Evolution 3:830–841.https://doi.org/10.1093/gbe/evr081
-
Degenerative Expansion of a Young SupergeneMolecular Biology and Evolution 36:553–561.https://doi.org/10.1093/molbev/msy236
-
BookA Look at SD (Segregation Distorter) in the Wild Population in Madison, Wisconsin, More than 20 Years after Its Initial DiscoveryDrosophila Information Service.
-
Segregation Distortion in Drosophila melanogaster: Genetic and Molecular AnalysesThe American Naturalist 137:287–331.https://doi.org/10.1086/285164
-
Butterfly mimicry: the genetical evolution of an adaptationEvolutionary Biology 10:163–206.https://doi.org/10.1007/978-1-4615-6953-4
-
Evolution under tight linkage to mating typeThe New Phytologist 165:63–70.https://doi.org/10.1111/j.1469-8137.2004.01246.x
-
Estimating f-statistics for the analysis of population structureEvolution; International Journal of Organic Evolution 38:1358–1370.https://doi.org/10.1111/j.1558-5646.1984.tb05657.x
-
Completing bacterial genome assemblies with multiplex MinION sequencingMicrobial Genomics 3:e000132.https://doi.org/10.1099/mgen.0.000132
-
TEMP: a computational method for analyzing transposable element polymorphism in populationsNucleic Acids Research 42:6826–6838.https://doi.org/10.1093/nar/gku323
Article and author information
Author details
Beatriz Navarro-Dominguez

Daven C Presgraves
Amanda M Larracuente
Funding
National Institute of General Medical Sciences (R35 GM119515)
- Amanda M Larracuente
Stephen Biggar and Elisabeth Asaro Fellowship in Data Science
- Amanda M Larracuente
David and Lucile Packard Foundation
- Daven C Presgraves
University of Rochester
- Daven C Presgraves
National Institute of General Medical Sciences (F32GM105317)
- Amanda M Larracuente
The funders had no role in study design, data collection and interpretation, or the decision to submit the work for publication.
Acknowledgements
This work was funded by the National Institutes of Health (NIH), National Institute of General Medical Sciences (R35GM119515 and NIH-NRSA F32GM105317 to AML), Stephen Biggar and Elisabeth Asaro fellowship in Data Science to AML, a David and Lucile Packard Foundation grant and University of Rochester funds to DCP. We thank Dr Danna Eickbush for assistance with genomic DNA preparation for nanopore sequencing. We also thank the University of Rochester CIRC for access to computing cluster resources and UR Genomics Research Center for the library construction and sequencing.
Version history
- Preprint posted: December 24, 2021 (view preprint)
- Received: April 3, 2022
- Accepted: April 20, 2022
- Accepted Manuscript published: April 29, 2022 (version 1)
- Accepted Manuscript updated: May 3, 2022 (version 2)
- Version of Record published: May 20, 2022 (version 3)
Copyright
© 2022, Navarro-Dominguez et al.
This article is distributed under the terms of the Creative Commons Attribution License, which permits unrestricted use and redistribution provided that the original author and source are credited.
Metrics
-
- 1,926
- views
-
- 402
- downloads
-
- 12
- citations
Views, downloads and citations are aggregated across all versions of this paper published by eLife.
Download links
A two-part list of links to download the article, or parts of the article, in various formats.
Downloads (link to download the article as PDF)
Open citations (links to open the citations from this article in various online reference manager services)
Cite this article (links to download the citations from this article in formats compatible with various reference manager tools)
Epistatic selection on a selfish Segregation Distorter supergene – drive, recombination, and genetic load
eLife 11:e78981.
https://doi.org/10.7554/eLife.78981
Further reading
-
- Evolutionary Biology
Enantiornithines were the dominant birds of the Mesozoic, but understanding of their diet is still tenuous. We introduce new data on the enantiornithine family Bohaiornithidae, famous for their large size and powerfully built teeth and claws. In tandem with previously published data, we comment on the breadth of enantiornithine ecology and potential patterns in which it evolved. Body mass, jaw mechanical advantage, finite element analysis of the jaw, and traditional morphometrics of the claws and skull are compared between bohaiornithids and living birds. We find bohaiornithids to be more ecologically diverse than any other enantiornithine family: Bohaiornis and Parabohaiornis are similar to living plant-eating birds; Longusunguis resembles raptorial carnivores; Zhouornis is similar to both fruit-eating birds and generalist feeders; and Shenqiornis and Sulcavis plausibly ate fish, plants, or a mix of both. We predict the ancestral enantiornithine bird to have been a generalist which ate a wide variety of foods. However, more quantitative data from across the enantiornithine tree is needed to refine this prediction. By the Early Cretaceous, enantiornithine birds had diversified into a variety of ecological niches like crown birds after the K-Pg extinction, adding to the evidence that traits unique to crown birds cannot completely explain their ecological success.
-
- Evolutionary Biology
The RNA world hypothesis proposes that during the early evolution of life, primordial genomes of the first self-propagating evolutionary units existed in the form of RNA-like polymers. Autonomous, non-enzymatic, and sustained replication of such information carriers presents a problem, because product formation and hybridization between template and copy strands reduces replication speed. Kinetics of growth is then parabolic with the benefit of entailing competitive coexistence, thereby maintaining diversity. Here, we test the information-maintaining ability of parabolic growth in stochastic multispecies population models under the constraints of constant total population size and chemostat conditions. We find that large population sizes and small differences in the replication rates favor the stable coexistence of the vast majority of replicator species (‘genes’), while the error threshold problem is alleviated relative to exponential amplification. In addition, sequence properties (GC content) and the strength of resource competition mediated by the rate of resource inflow determine the number of coexisting variants, suggesting that fluctuations in building block availability favored repeated cycles of exploration and exploitation. Stochastic parabolic growth could thus have played a pivotal role in preserving viable sequences generated by random abiotic synthesis and providing diverse genetic raw material to the early evolution of functional ribozymes.


