Epistatic selection on a selfish Segregation Distorter supergene – drive, recombination, and genetic load
- Department of Biology, University of Rochester, United States
- Ronin Institute, United States
Figures
Figure 1 with 4 supplements
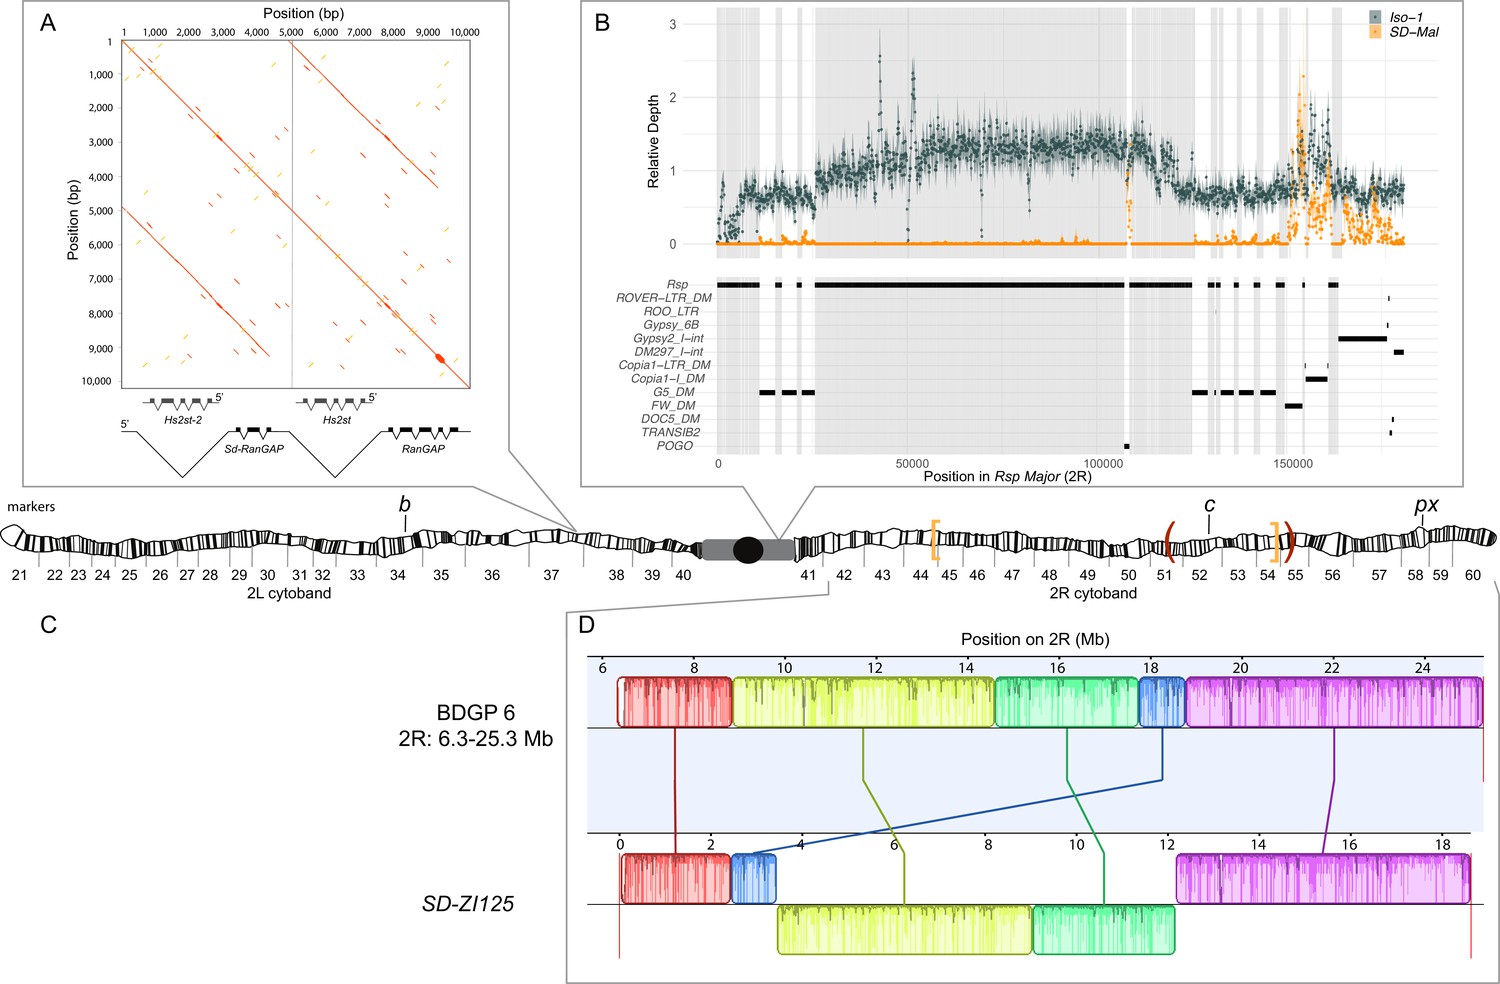
Map depicting the chromosomal features of the SD-Mal chromosome.
The schematic shows the cytogenetic map of chromosomes 2L and 2R (redrawn based on images in Lefevre, 1976) and the major features of the chromosome. (A) Dotplot showing that the Sd locus is a partial duplication of the gene RanGAP (in black), located at band 37D2-6. The gene Hs2st occurs in the first intron of RanGAP, and it is also duplicated in the Sd locus (Hs2st-2). (B) The Rsp-major locus is an array of tandem repeats located in the pericentric heterochromatin (band h39). Read mapping to a reference genome containing 2R pericentric heterochromatin (Iso1 strain, see Chang and Larracuente, 2019) shows that SD-Mal chromosomes do not have any Rsp repeats in the Rsp-major locus, consistent with being insensitive to distortion by Sd (Rspi) (orange, high relative coverage regions correspond to transposable element interspersed), in contrast with Iso-1, which is sensitive (Rsps). The tracks below indicate the presence of types of repetitive elements found at this locus. Black lines indicate the presence of a repeat type in the reference genome. Gray shading shows where Rsp repeats are in the reference genome. (C) Two paracentric, overlapping inversions constitute the In(2R)Mal arrangement shown on the schematic of polytene chromosomes: In(2R)51BC;55E (In(2R)Mal-p) in orange brackets and In(2R)44F;54E (In(2R)Mal-d) in red parentheses. Pericentromeric heterochromatin and the centromere are represented by a gray rectangle and black circle, respectively. (D) Our assembly based on long-read sequencing data provide the exact breakpoints of In(2R)Mal and confirms that the distal inversion (Dmel.r6, 2R:14,591,034–18,774,475) occurred first, and the proximal inversion (Dmel.r6, 2R:8,855,601–15,616,195) followed, overlapping ~1 Mb with the distal inversion. The colored rectangles correspond to locally collinear blocks of sequence with the height of lines within the block corresponding to average sequence conservation in the aligned region (Darling et al., 2010). Blocks below the center black line indicate regions that align in the reverse complement orientation. Vertical red lines indicate the end of the assembled chromosomes. Visible marker locations used for generating recombinants (b (34D1), c (52D1), and px (58E4-58E8)) are indicated on the cytogenetic map (Lefevre, 1976).
Figure 1—figure supplement 1
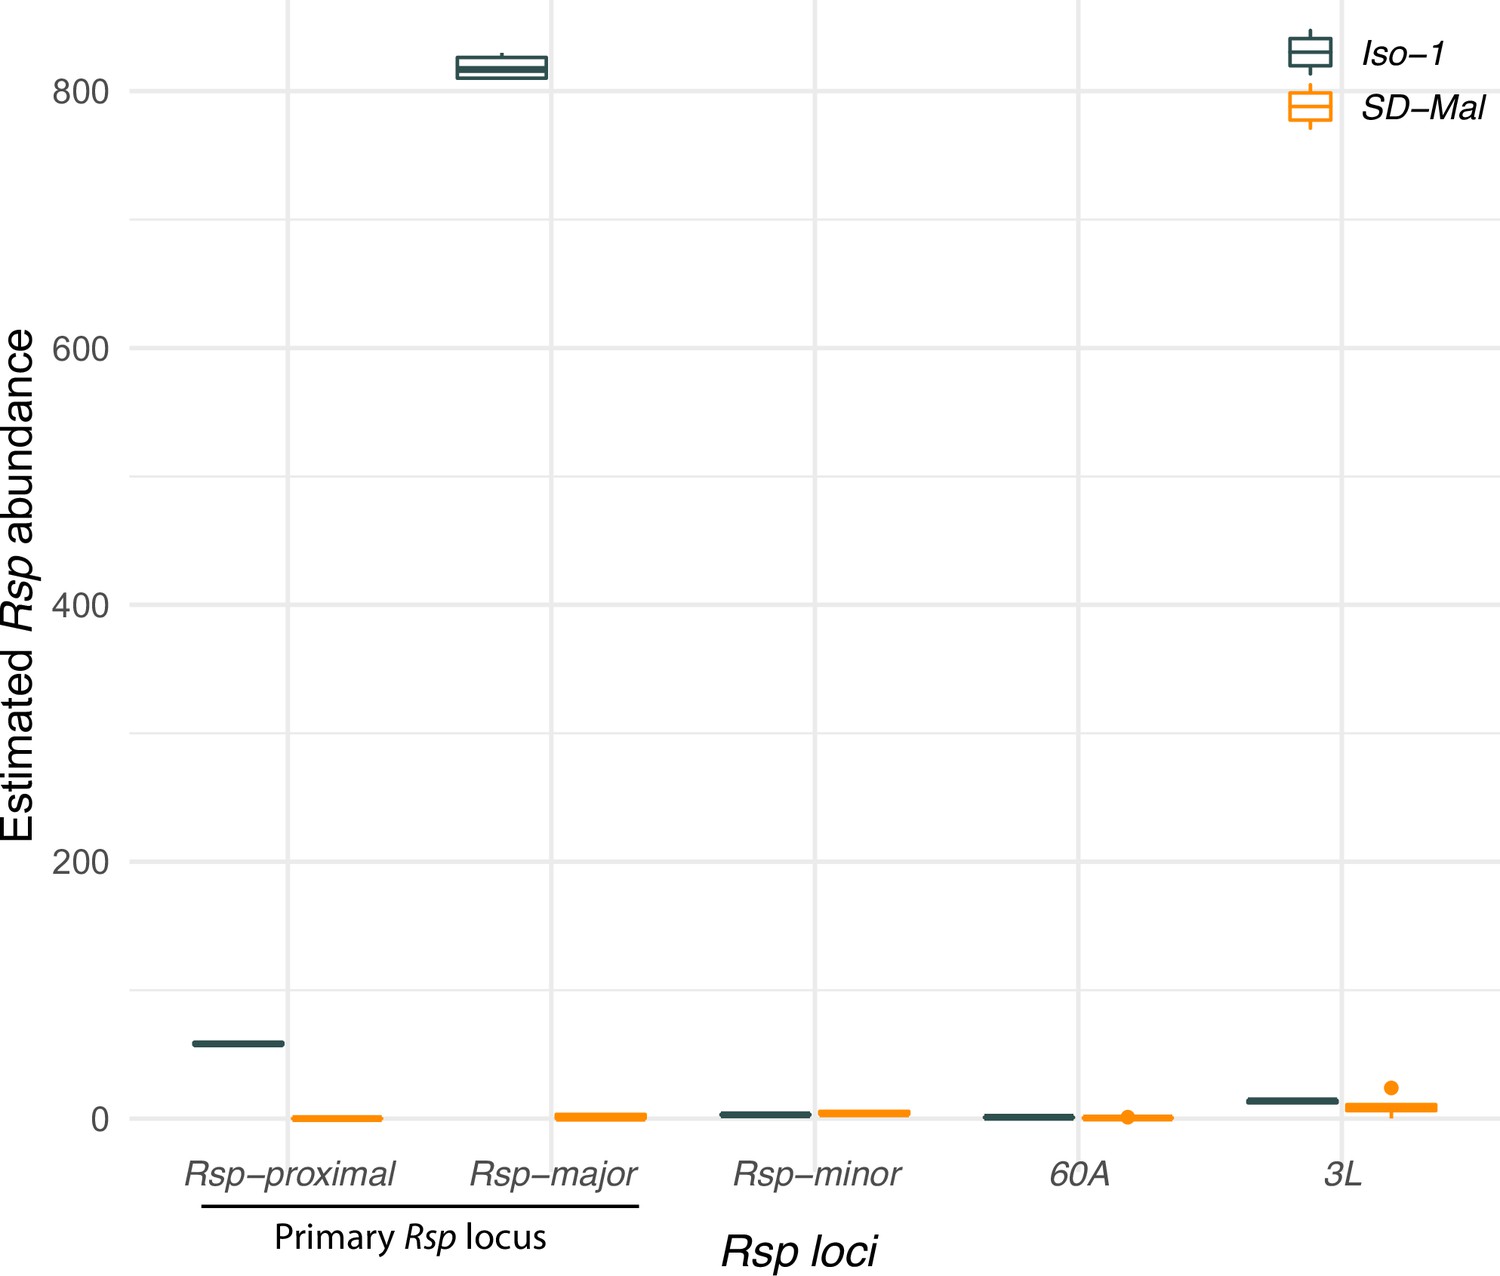
Estimated abundance of Rsp repeats at each Rsp locus in the reference Iso-1 genome and SD-Mal.
For each locus annotated in the reference Drosophila melanogaster genome (Khost et al., 2017), we plot estimated Rsp abundance as the sum of average depth of repeats at each locus normalized by average depth of chromosome 2 on the y-axis. SD-Mal has very few reads mapping to the primary Rsp locus (Rsp-proximal and Rsp-major), suggesting a complete deletion of the target of drive.
Figure 1—figure supplement 2
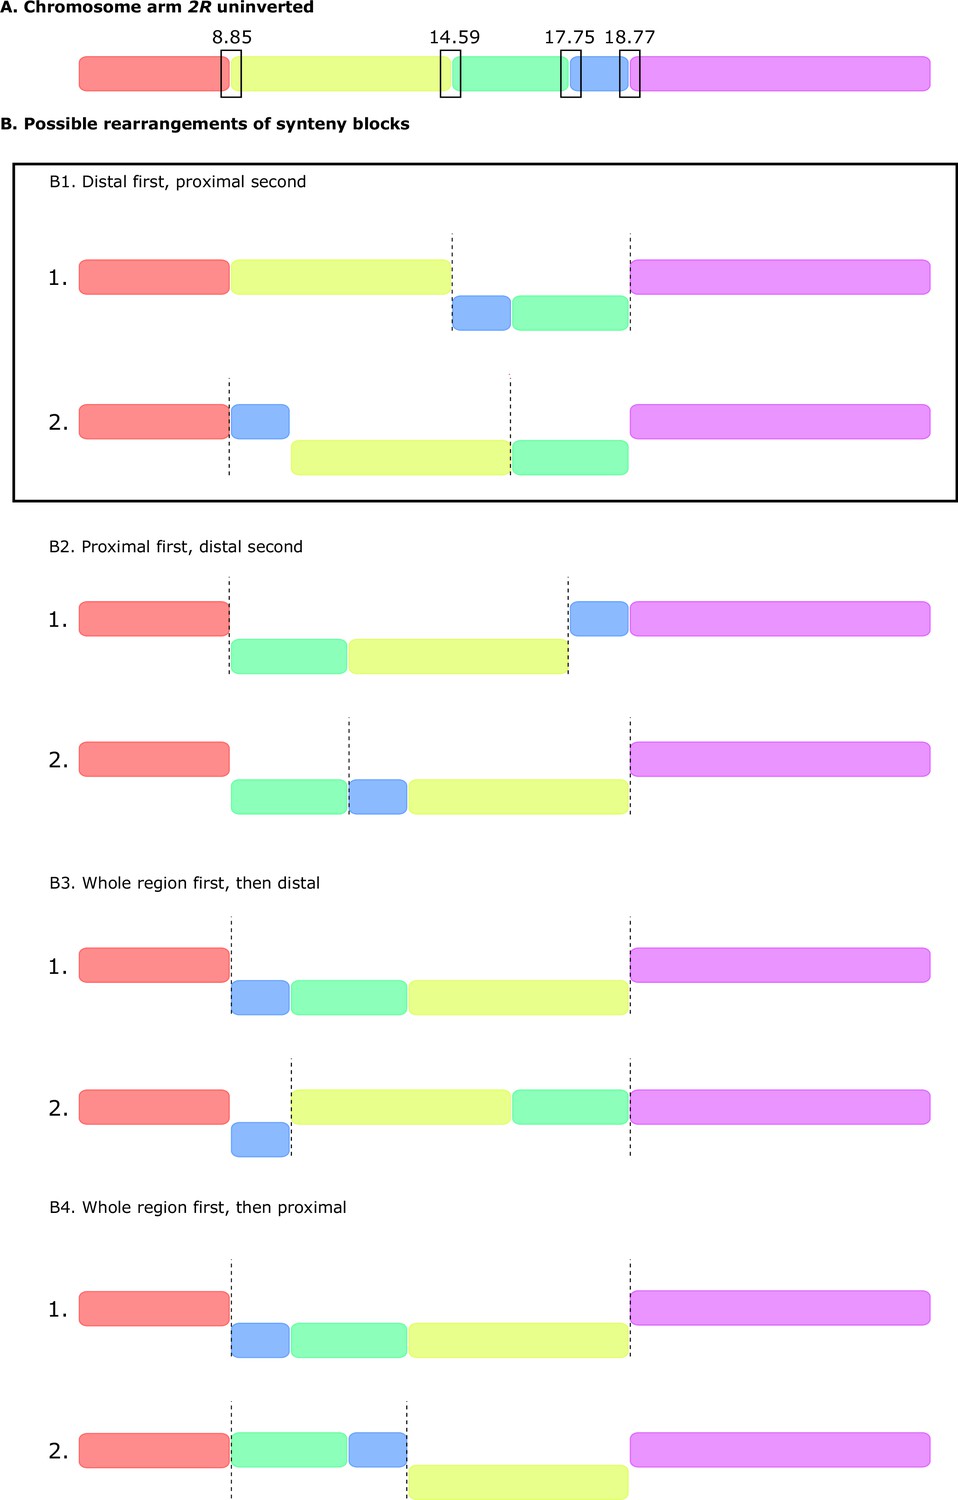
Possible rearrangements of synteny blocks to generate a double inversion.
(A) Schematics of uninverted chromosome arm 2R showing the location of the five synteny blocks defined by Mauve (Darling et al., 2010; Figure 1D). (B) Possible rearrangements between blocks that can generate a double, overlapping, paracentric inversion. (B1) Distal inversion first, then proximal inversion. (B2) Proximal inversion first, then distal. (B3) Whole region first, then distal. (B4) Whole region first, then proximal. Note that B1 (distal inversion first, then proximal), is the only scenario that matches what we observe in our SD-Mal chromosome assembly (Figure 1D).
Figure 1—figure supplement 3
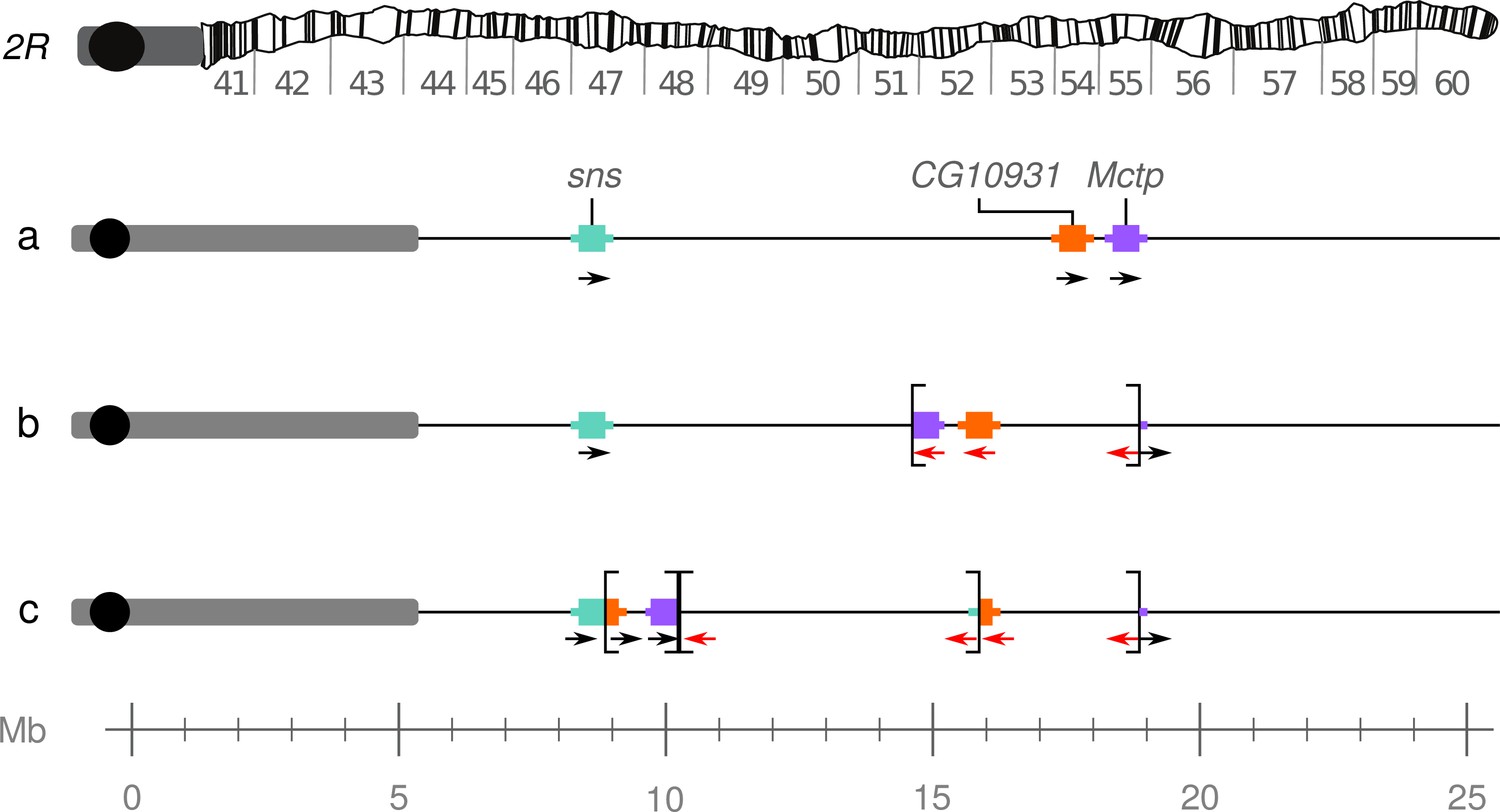
Model of the In(2R)Mal rearrangement.
(a) Wildtype arrangement of chromosome 2R. Pericentromeric heterochromatin and the centromere are represented by a gray rectangle and black circle, respectively. (b) In(2R)Mal-d: inversion of 4.18 Mb of 2R (2R:14,591,003–18,774,475), which disrupted the 3’ UTR of the Mctp gene (2R:18,761,758–18,774,824). (c) In(2R)Mal-p: Inversion of 6.76 Mb of 2R (2R:8,855,602–17,749,310), with 1.02 Mb overlapping with the now proximal segment of In(2R)Mal-d. This inversion disrupted the 3’ UTR of the sns gene (2R:8,798,489–8,856,091) and the CDS of the CG10931 gene (2R:17,748,935–17,750,136).
Figure 1—figure supplement 4
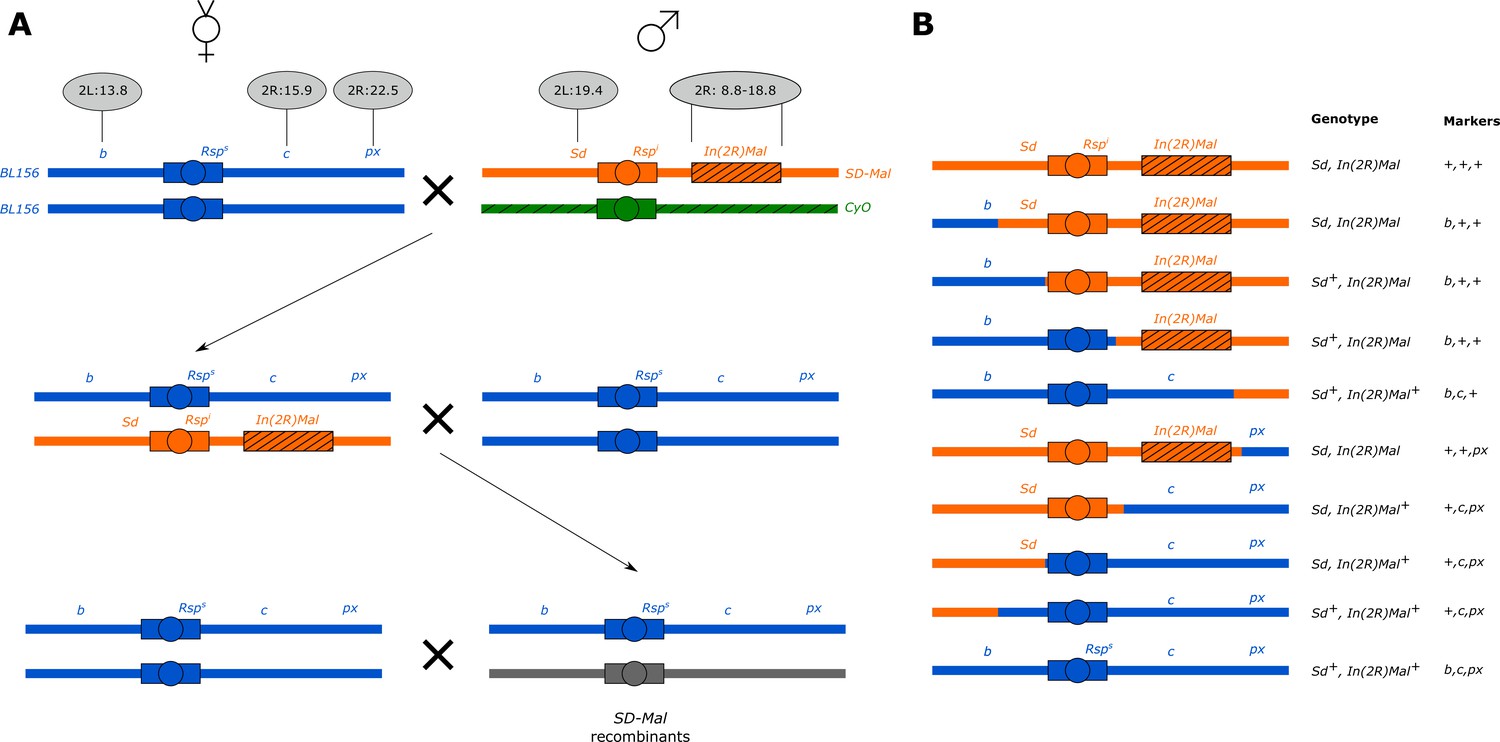
Crossing scheme to generate recombinants along SD-Mal.
(A) We crossed 8–10 b c px/b c px virgin females to 3–5 SD-ZI125 males, recovered SD-ZI125/b c px virgins, then backcrossed 8–10 of them to 3–5 b c px homozygous males. (B) We recovered three types of recombinant chromosomes from SD-ZI125/b c px x b c px/b c px crosses, attending to visible markers: b + +; + c px; and + + px, and crossed them back to virgin b c px females to measure the strength of segregation distortion reported on Table 2. We genotype the presence of the Sd locus duplication in the recombinants by PCR.
Figure 2 with 2 supplements

Diversity on SD-Mal chromosomes.
(A) Average pairwise nucleotide diversity per site (π) and (B) Tajima’s D estimates in non-overlapping 10-kb windows along chromosome 2 in Zambian SD-Mal chromosomes (n = 9, orange) and SD+ chromosomes from the same population, bearing the cosmopolitan inversions In(2L)t (n = 10, dark blue) and In(2R)NS (n = 10, light blue). Regions corresponding to pericentric heterochromatin are shaded in gray and the centromere location is marked with a black circle. SD-Mal chromosomes show a sharp decrease in nucleotide diversity and skewed frequency spectrum from the Sd locus (Sd-RanGAP, 2L:19.4 Mb) to ~2.9 Mb beyond the distal breakpoint of In(2R)Mal.
Figure 2—figure supplement 1
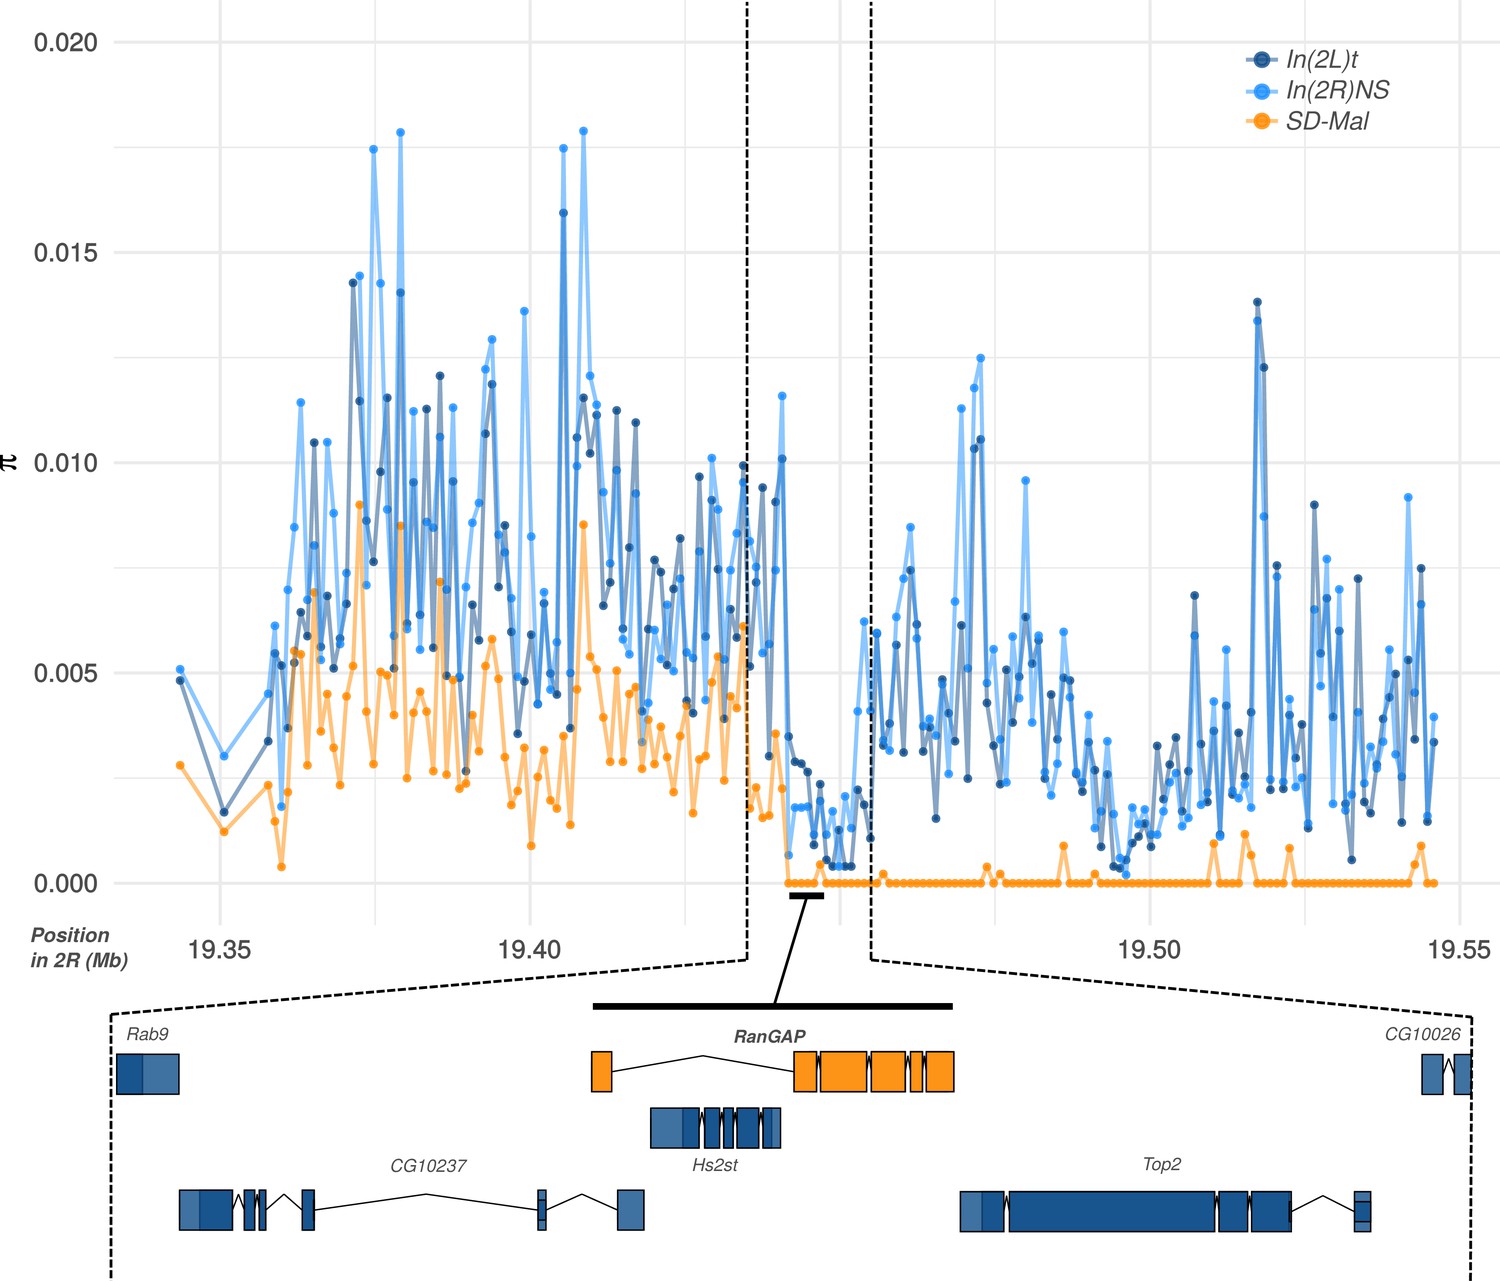
Diversity at the Sd-RanGAP locus on SD-Mal chromosomes.
Average pairwise nucleotide diversity per site (π) in non-overlapping, 1-kb windows, for SD+ and SD-Mal chromosomes, around the Sd-RanGAP locus.
Figure 2—figure supplement 2
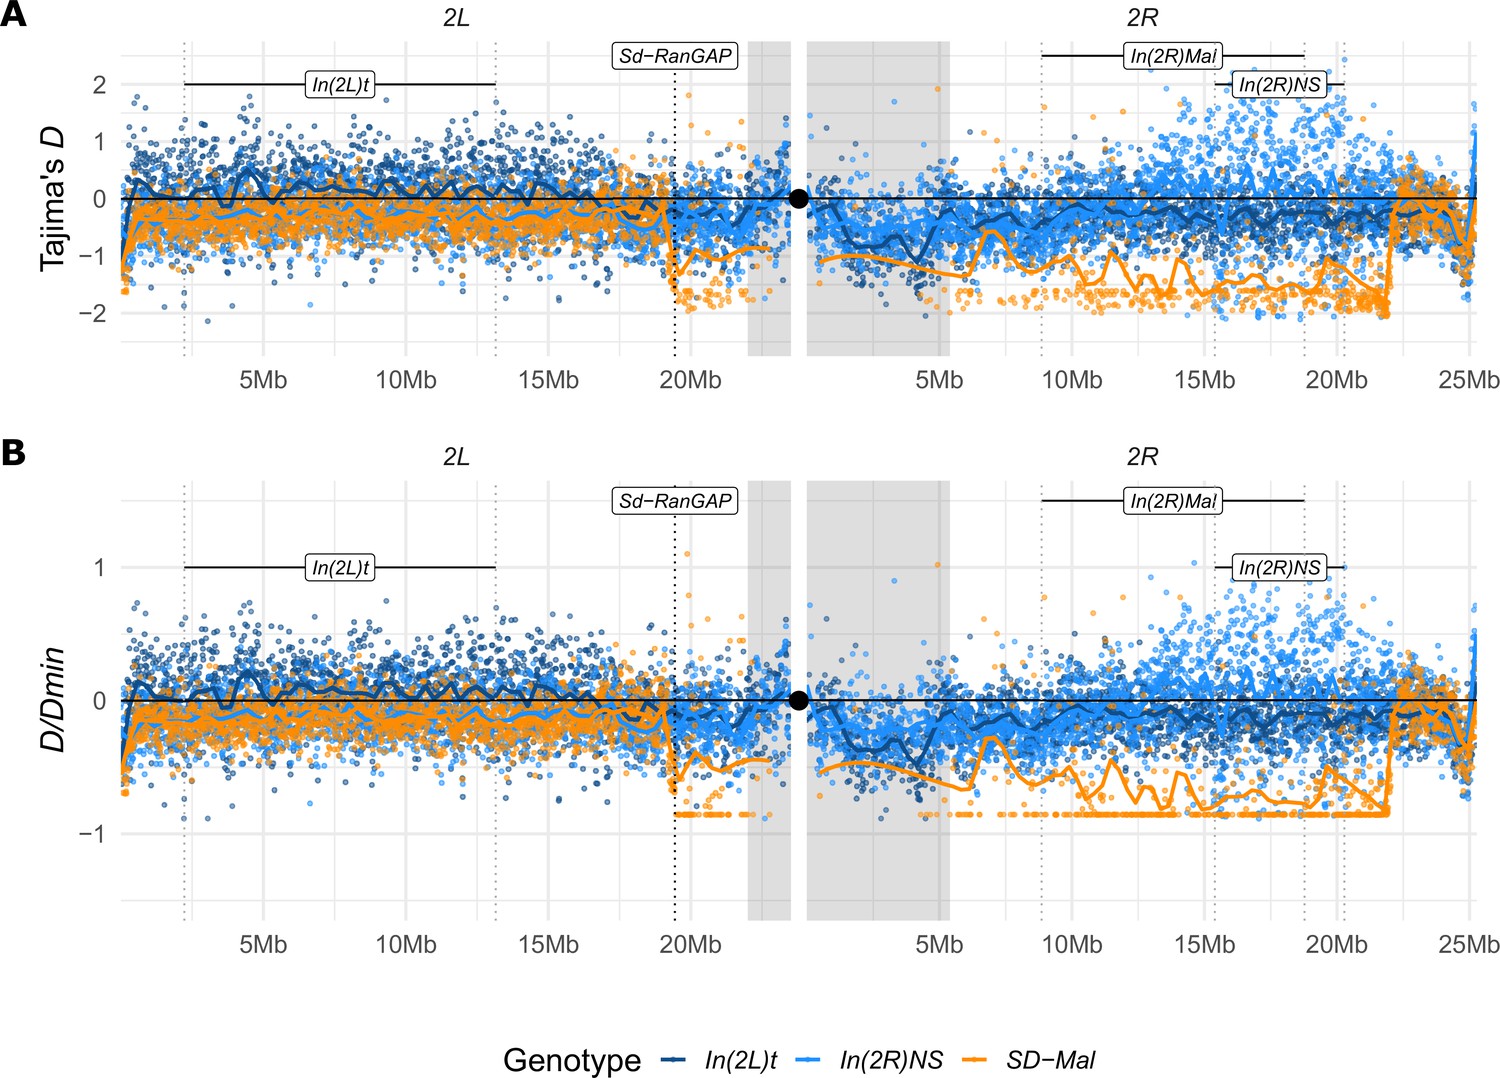
Tajima’s D estimates.
(A) Tajima’s D estimates in non-overlapping 10-kb windows along chromosome 2, in Zambian SD-Mal chromosomes (n = 9, orange) and SD+ chromosomes from the same population, bearing the cosmopolitan inversions In(2L)t (n = 10, dark blue) and In(2R)NS (n = 10, light blue). (B) To account for the differences in number of segregating sites between windows, we also estimated D/Dmin, that is, the ratio of D to its theoretical minimum Dmin, when all sites are singletons. Regions corresponding to pericentric heterochromatin are shaded in gray and the centromere location is marked with a black circle.
Figure 3

Differentiation between SD-Mal and wildtype chromosomes.
(A) Pairwise FST and (B) dXY per base pair in non-overlapping 10-kb windows along chromosome 2, between Zambian SD-Mal haplotypes (n = 9) and wildtype chromosomes from the same population, bearing the cosmopolitan inversions In(2L)t (n = 10) and In(2R)NS (n = 10). Regions corresponding to pericentric heterochromatin are shaded in gray and the centromere location is marked with a black circle.
Figure 4 with 1 supplement
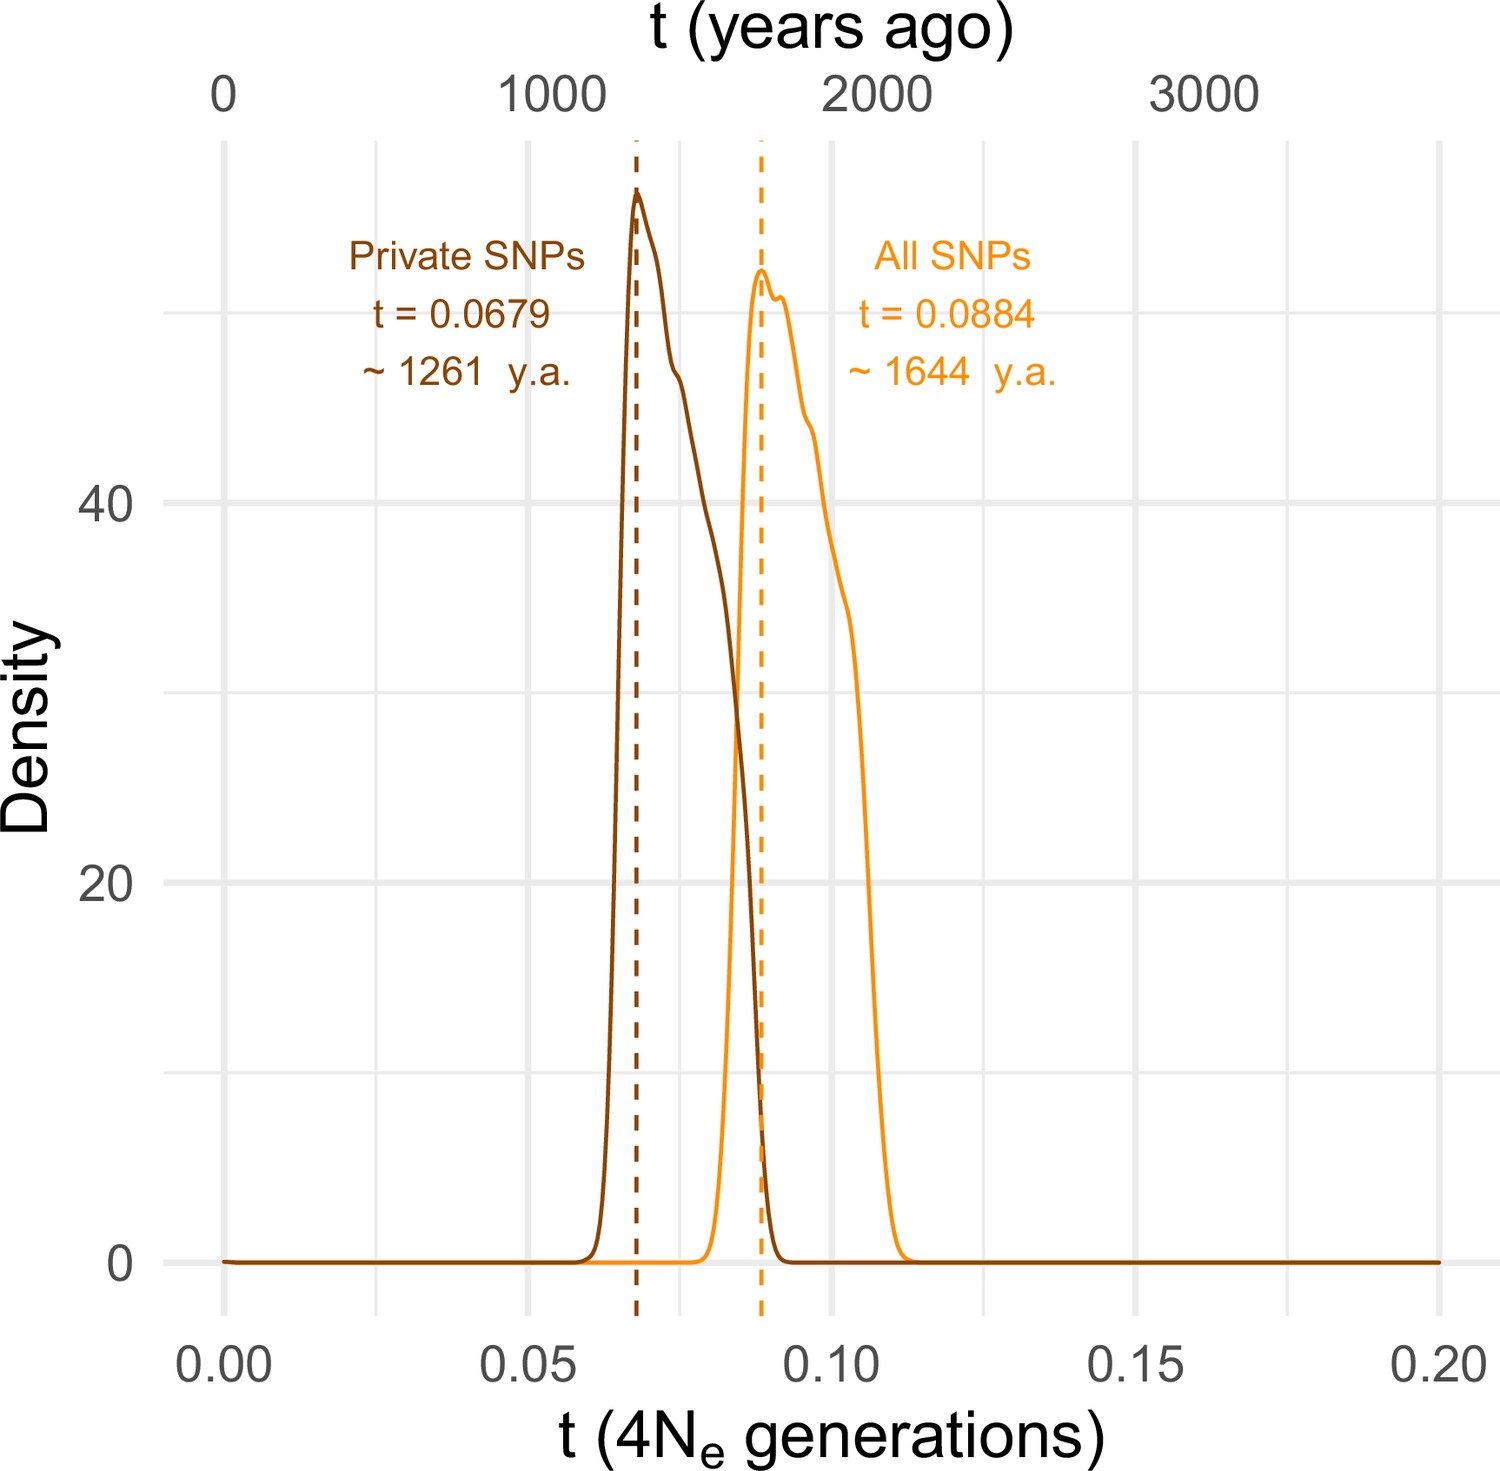
Estimating the time since the SD-Mal selective sweep.
Approximate Bayesian computation (ABC) estimates based on 10,000 posterior samples place the onset of the selective sweep between 0.0884 (95% CI 0.0837–0.1067) and 0.0679 (0.0647–0.0868) × 4Ne generations, that is, ~1261–1644 years ago, considering recent estimates of Ne in Zambia from Kapopoulou et al., 2018, frequency of SD-Mal in Zambia 1.47% and 10 generations per year. Estimates were done considering only In(2R)Mal, where crossing over is rare and only occurs between SD-Mal chromosomes, using all SNPs and excluding shared SNPs in order to account for gene conversion from SD+ chromosomes.
Figure 4—figure supplement 1
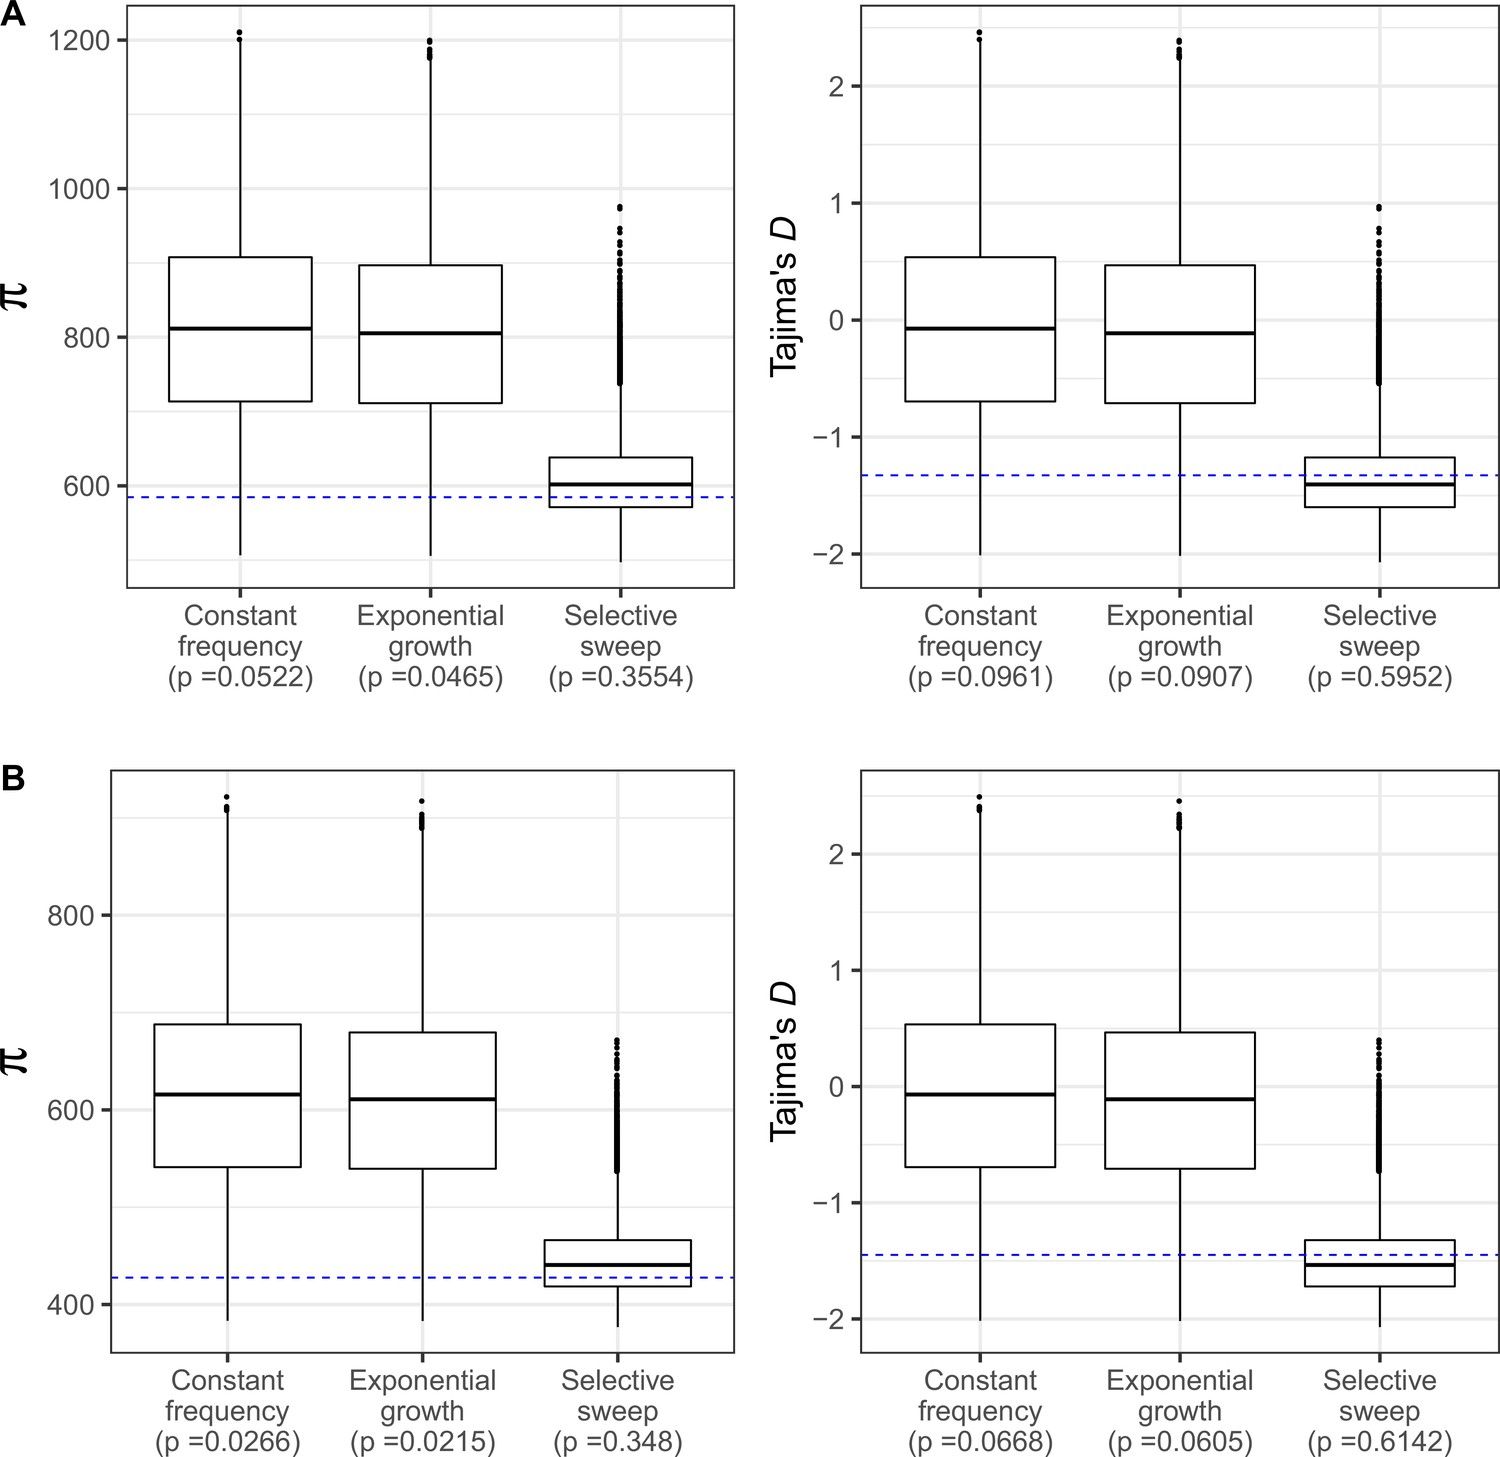
Neutral coalescent simulations under three demographic models.
(A) With S estimated using all SNPs in In(2R)Mal, and (B) excluding SNPs shared with SD+ chromosomes to account for gene conversion. Demographic models are: constant frequency of SD-Mal, exponential growth of SD-Mal, and a recent sweep and expansion model (absolute bottleneck at a time t, being t = 0.0884 4Ne generations for all SNPs and t = 0.0679 4Ne generations excluding shared SNPs, Figure 4). Blue horizontal line marks observed πIn2RMal (estimated for the entire region) and Tajima’s D in In(2R)Mal in Zambian SD chromosomes.
Figure 5
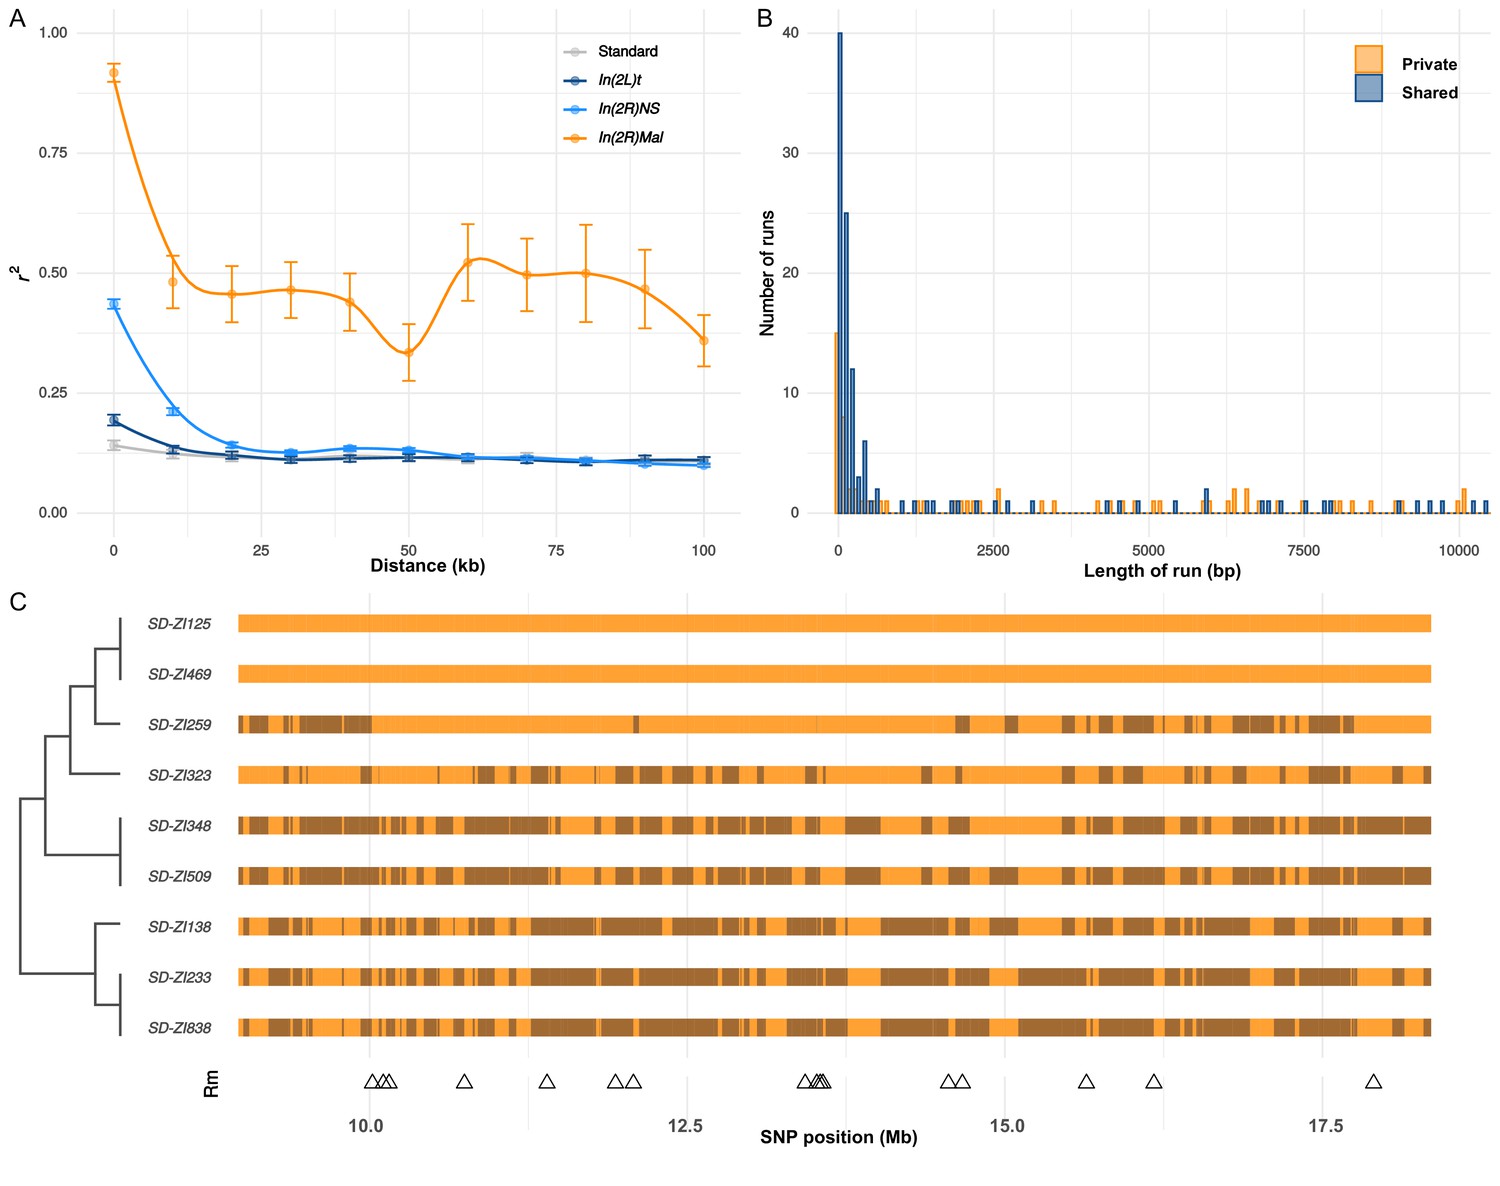
Recombination on SD-Mal haplotypes.
(A) Linkage disequilibrium (r2) as a function of distance in 10-kb windows, measured in In(2R)Mal (n = 9), In(2L)t (n = 10), In(2R)NS (n = 10), and the corresponding region of In(2R)Mal in a standard, uninverted 2R chromosome (n = 10). (B) Histogram of length of runs of SNPs in In(2R)Mal shows that a high proportion of shared SNPs concentrate in runs shorter than 1 kb. (C) Chromosomal configuration of the 338 non-singleton SNPs in nine different SD-Mal lines. Color coded for two states (same in light orange or different in dark orange) using SD-ZI125 as reference. Locations of minimal number of recombination events are labeled as triangles at the bottom. Maximum likelihood tree is displayed on the left.
Figure 6 with 3 supplements
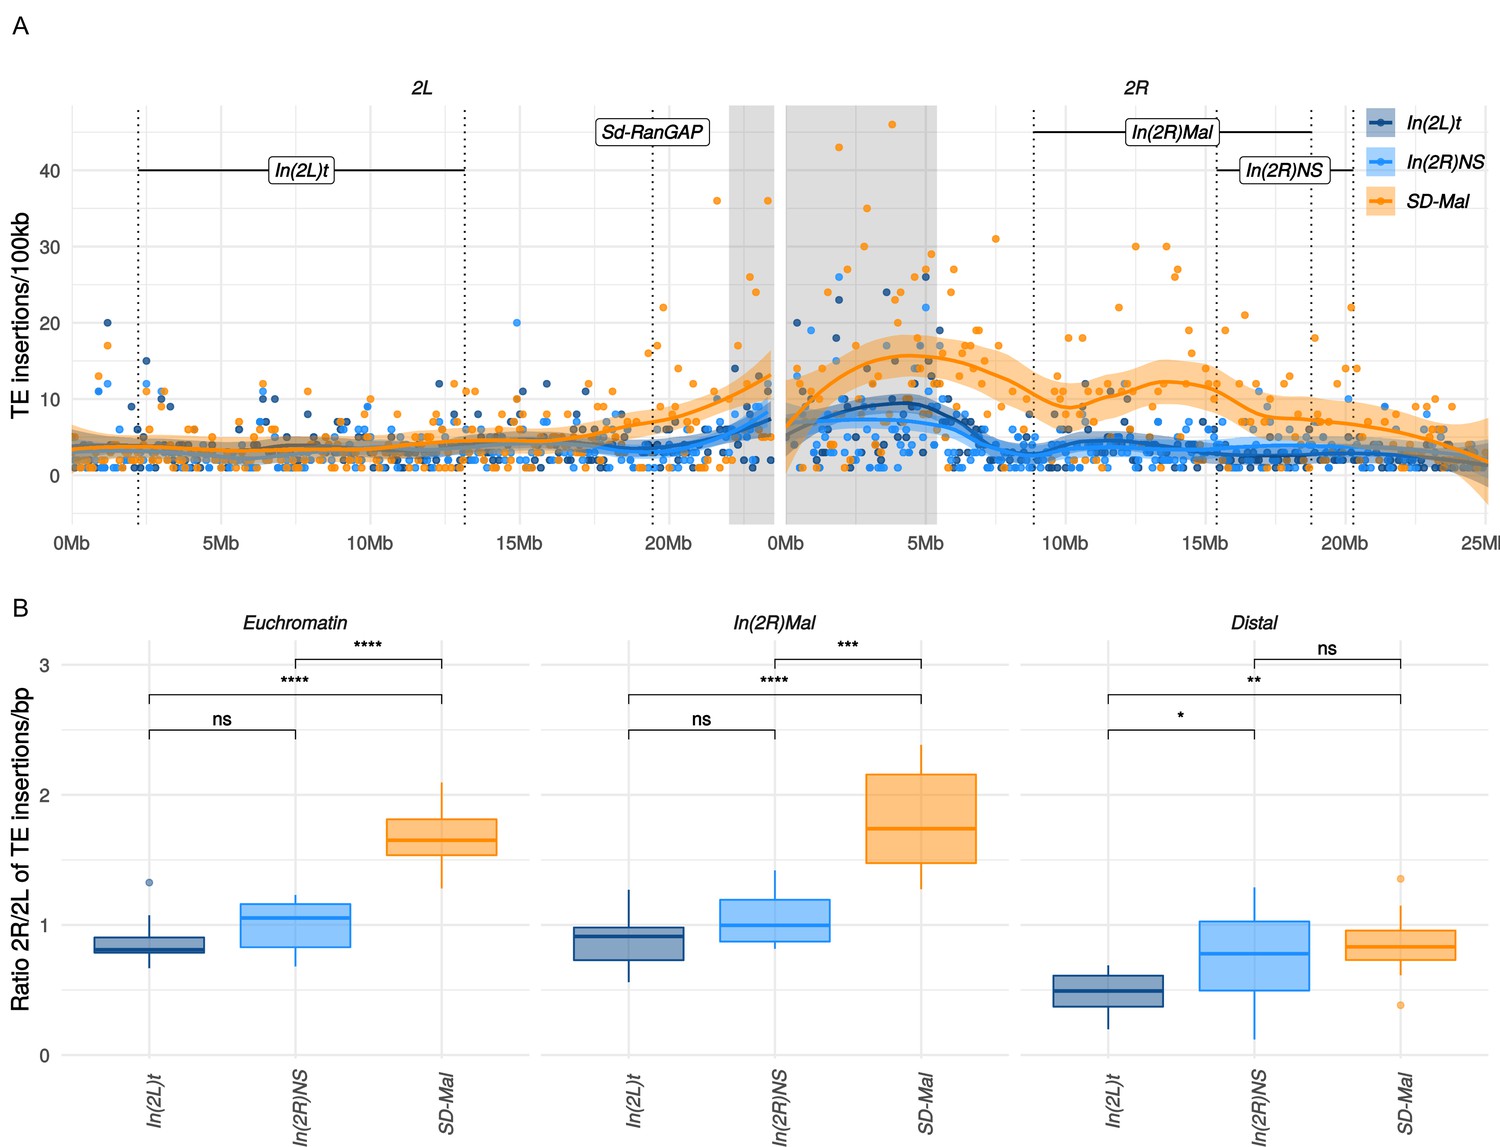
Transposable elements (TEs) on SD-Mal haplotypes.
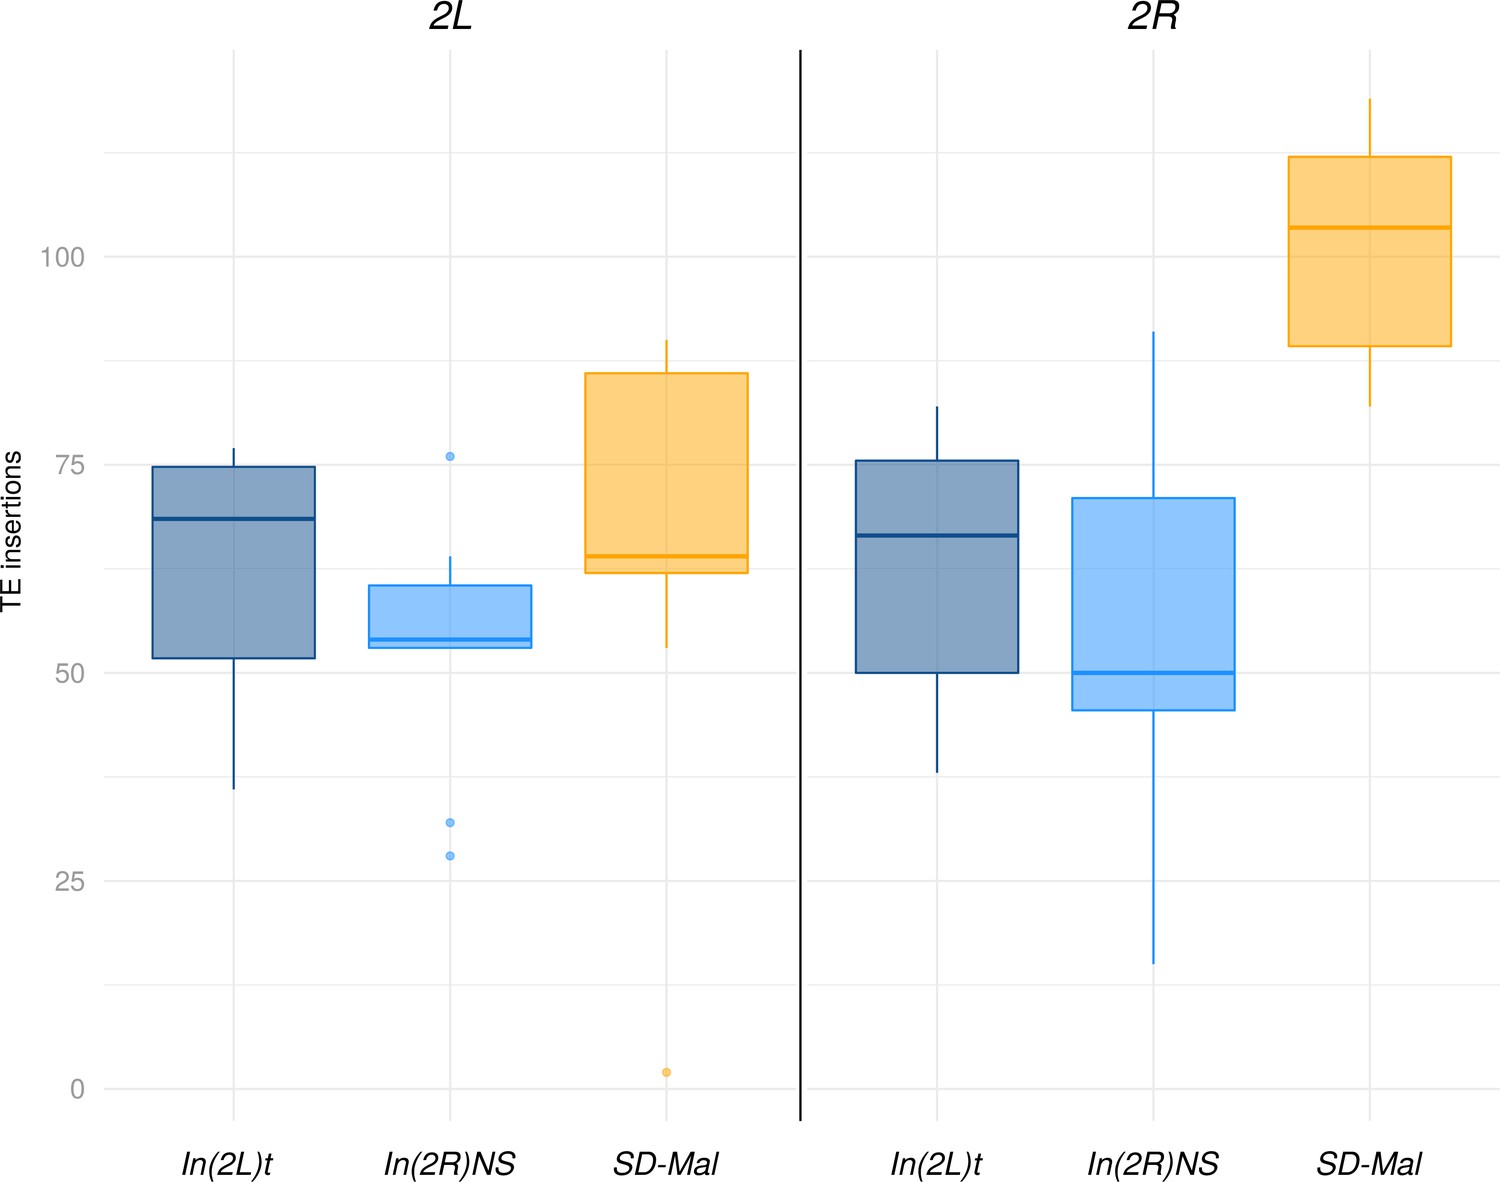
(A) Number of TE insertions per 100-kb windows along chromosome 2 in Zambian SD chromosomes (n = 9, orange) and wildtype chromosomes from the same population, bearing the cosmopolitan inversions In(2L)t (n = 10, dark blue) and In(2R)NS (n = 10, light blue). (B) Ratio of the number of insertions in the euchromatin of 2R to 2L per library. The relative enrichment in TEs in 2R of SD-Mal haplotypes is mostly due to an increase of TE insertions in non-recombining regions of the chromosome. Asterisks denote significance, p-values estimated by a Kruskal-Wallis test (threshold for significance p = 0.05).
Figure 6—figure supplement 1
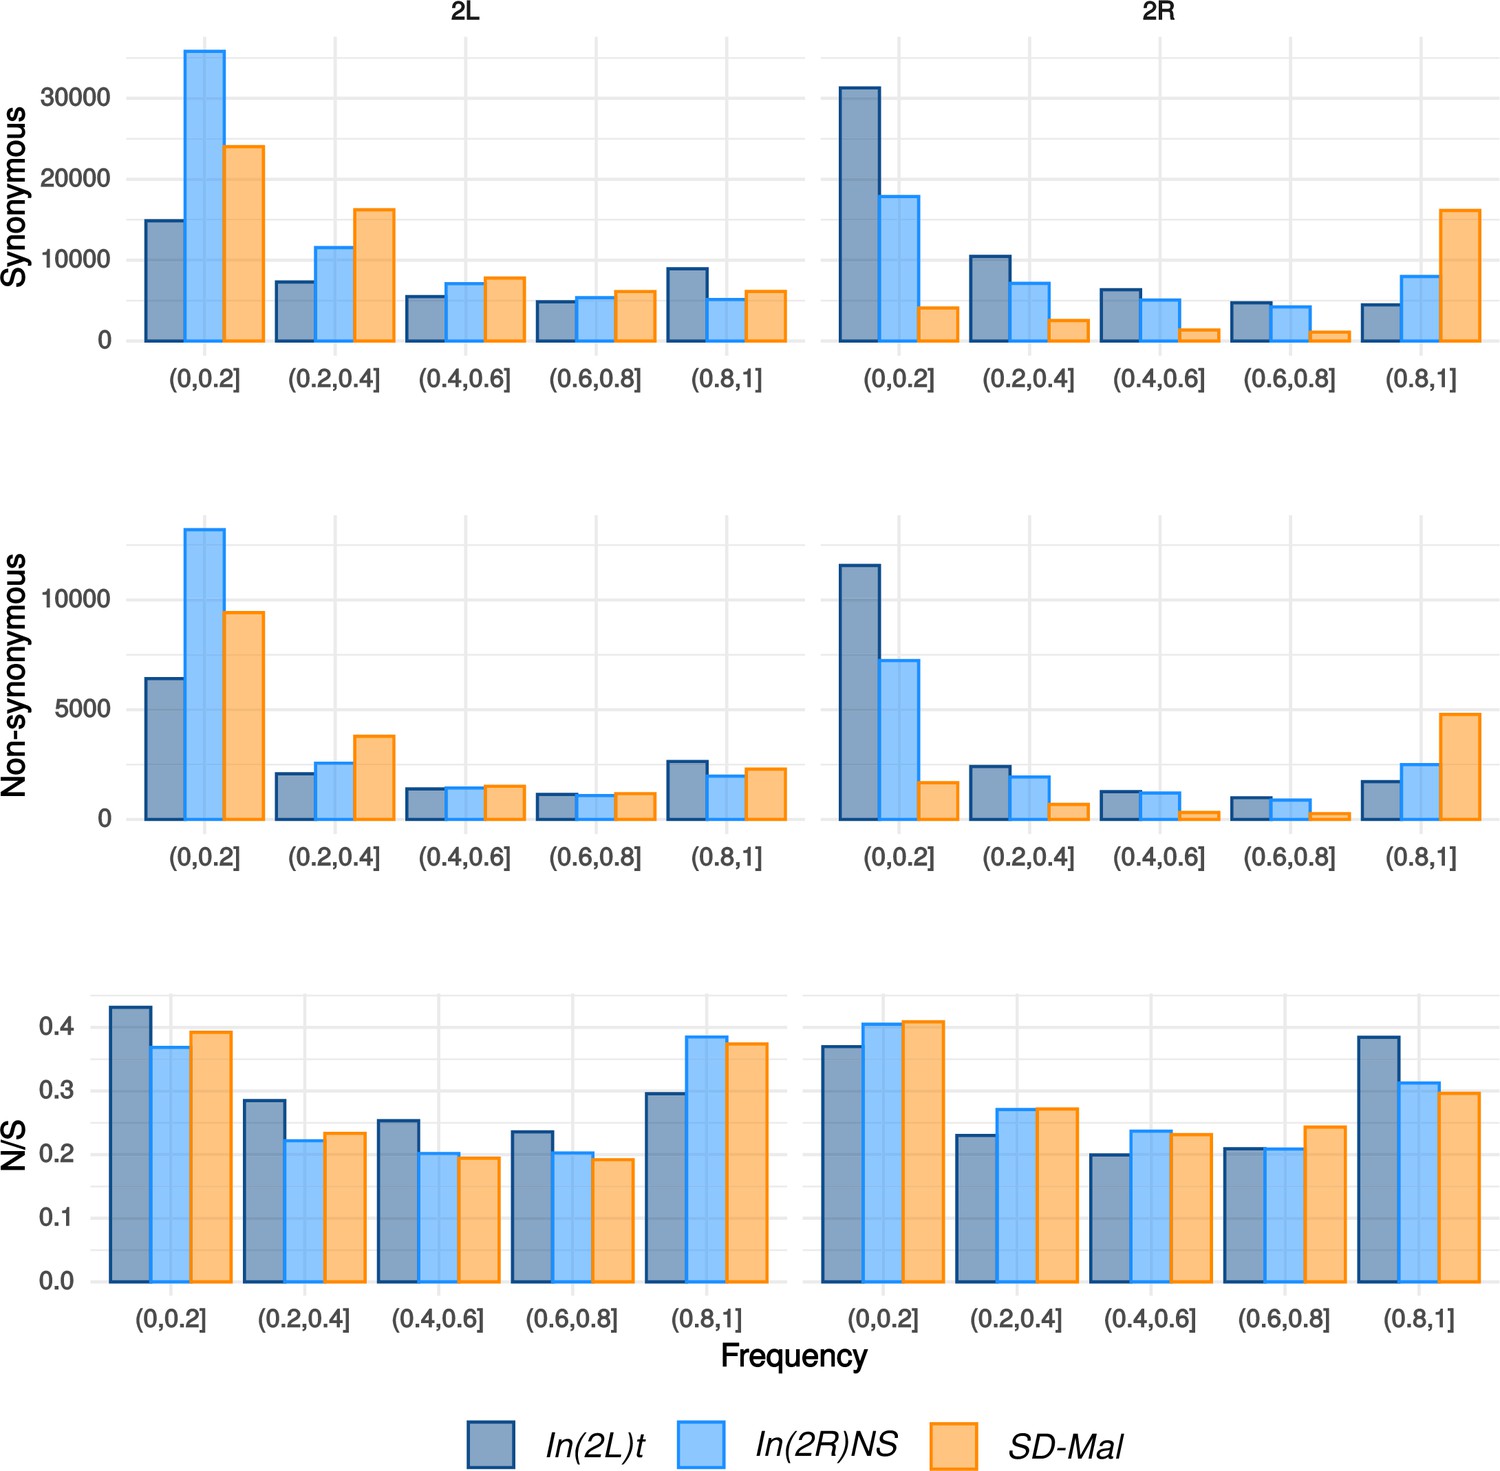
Frequency spectra of synonymous and non-synonymous SNPs.
Frequency spectra of synonymous and non-synonymous SNPs in the In(2R)Mal chromosome region in Zambian SD chromosomes (n = 9, orange) and wildtype chromosomes from the same population, bearing the cosmopolitan inversions In(2L)t (n = 10, dark blue) and In(2R)NS (n = 10, light blue). N/S ratio for each of the frequency categories.
Figure 6—figure supplement 2
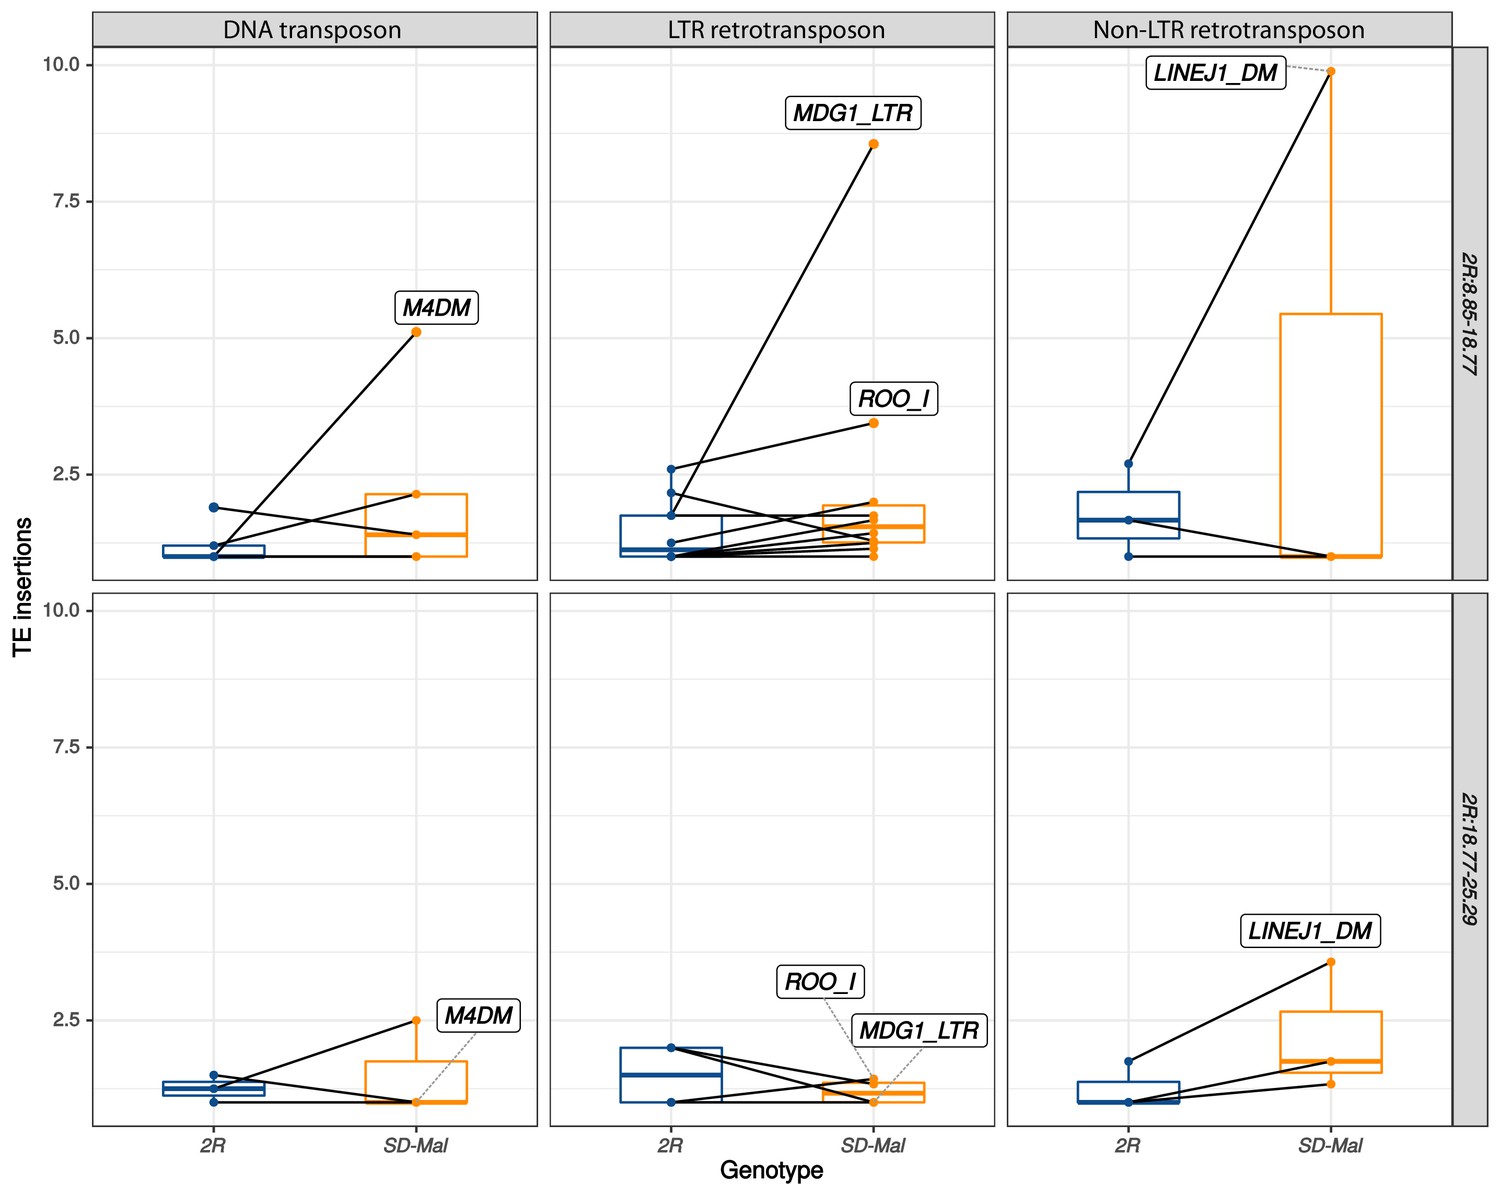
Number of insertions per transposable element (TE) family.
Number of insertions per TE family in SD-Mal (orange) compared to uninverted SD+ chromosome 2R (dark blue), both in In(2R)Mal (2R:8.85–18.77, top panel) and the region distal to it (2R:18.77–25.29, bottom panel). The families DNA/M4DM, LTR/MDG1, LTR/ROO_I, and Non-LTR/LINE are highly overrepresented in In(2R)Mal.
Figure 6—figure supplement 3
Abundance of transposable elements (TEs) in downsampled libraries.
Abundance of TEs in down sampled (3M reads, 75 bp) libraries for Zambian SD chromosomes (n = 9, orange) and SD+ chromosomes from the same population, bearing the cosmopolitan inversions In(2L)t (n = 10, dark blue) and In(2R)NS (n = 10, light blue).
Tables
Table 1
Frequency of recombinants along SD-Mal chromosomes vs. wildtype (OreR) chromosomes.
| Cross | N | n | nR (b–c) | nR (c–px) | d (b–c) | d (c–px) |
|---|---|---|---|---|---|---|
| OreR/b c px x b c px/b c px | 15 | 1,716 | 418 | 372 | 26.62 | 23.21 |
| SD-Mal/b c px x b c px/b c px | 11 | 1,820 | 211 | 32 | 11.81 | 1.76 |
-
N, number of crosses; n, total progeny scored; nR, number of recombinants, d, genetic distance in cM, Kosambi-corrected.
Table 2
Strength of segregation distortion in recombinants of SD-ZI125.
| Genotype | Markers | N | n | ±SE | k | ±SE | k* | ±SE | p-value (k* = 0.5) | |
|---|---|---|---|---|---|---|---|---|---|---|
| 1 | Sd In(2R)Mal | + + + and b + + | 112 | 90.3 | 6.03 | 0.99 | 0.00 | 0.98 | 0.00 | <0.0001 |
| 2 | Sd In(2R)Mal | + + px | 71 | 118.8 | 9.48 | 0.97 | 0.01 | 0.96 | 0.01 | <0.0001 |
| 3 | Sd In(2R)Mal+ | + c px | 19 | 147.6 | 14.39 | 0.54 | 0.01 | 0.51 | 0.01 | 0.3082 |
| 4 | Sd+ In(2R)Mal | b + + | 24 | 124.8 | 10.31 | 0.68 | 0.02 | 0.55 | 0.03 | 0.0572 |
| 5 | Sd+ In(2R)Mal+ | + c px | 65 | 120.4 | 8.32 | 0.53 | 0.01 | 0.51 | 0.01 | 0.3586 |
-
Chromosome 2 markers are black (b), curved (c), and plexus (px). N, number of crosses; n, average number of progeny from the crosses; SE, standard error; k, average proportion of progeny inheriting the recombinant SDr chromosome from SDr/b c px males; k*, average proportion of progeny inheriting the partial SDr chromosome from SDr/b c px males, corrected for viability. p-values reported by a single sample t-test with a null hypothesis of k* = 0.5, as expected for Mendelian segregation. b + + flies were PCR-genotyped for the presence (row 1) or absence (row 4) of Sd-RanGAP.
Table 3
Nucleotide diversity (π) on SD-Mal and SD+ chromosomes.
| π ( ± st. dev.) | p-value | ||||||
|---|---|---|---|---|---|---|---|
| Chr. | Region | SD+ | SD-Mal | SD+ × f | SD-Mal vs. SD+ | SD-Mal vs. SD+*f | |
| 1 | 2L | Distal to Sd-RanGAP | 1.03E-02 | 1.03E-02 | 1.52E-04 | 0.5727 | 0.00E + 00 |
| (±3.01E-03) | (±3.09E-03) | (±4.43E-05) | |||||
| 2 | 2L | Proximal to Sd-RanGAP | 4.44E-03 | 9.39E-05 | 6.52E-05 | 5.84E-90 | 0.0027 |
| (±2.75E-03) | (±1.66E-04) | (±4.04E-05) | |||||
| 3 | 2R | In(2R)Mal | 8.94E-03 | 7.97E-05 | 1.31E-04 | 0.00E + 00 | 1.42E-33 |
| (±2.95E-03) | (±1.18E-04) | (±4.33E-05) | |||||
| 4 | 2L-2R | SD-Mal supergene | 6.42E-03 | 7.98E-05 | 9.43E-05 | 0.00E + 00 | 2.60E-06 |
| (±4.03E-03) | (±1.32E-04) | (±5.92E-05) | |||||
-
Average nucleotide diversity (π) per site and empirical standard deviation estimated in 10-kb windows along chromosome 2, for SD+, SD-Mal, and SD+ scaled by the estimated frequency of SD-Mal chromosomes (SD+× f, where f = 1.47%). Outside of the linked region (row 1), πSD-Mal ~ πSD+. Inside of the linked region (rows 2–4), πSD-Mal < πSD+; even after scaling πSD+ by the frequency of SD-Mal in the population, πSD-Mal < πSD+× f. Due to non-independence of SNPs in non-recombining regions, we also estimated variance in π based on Charlesworth and Charlesworth, 2010; which is 5.30E-05 for In(2R)Mal and 6.27E-05 for the entire SD-Mal supergene. p-values reported by paired t-test between 10-kb windows.
Table 4
Synonymous and non-synonymous SNPs.
| Genotype | N | S | N/S | Fold change | p-value | |
|---|---|---|---|---|---|---|
| All SNPs | SD-Mal | 79 | 114 | 0.69 | 2.27 | <0.0001 |
| SD+ | 10,470 | 34,301 | 0.31 | |||
| Private SNPs | SD-Mal | 61 | 55 | 1.11 | 3.10 | <0.0001 |
| SD+ | 6782 | 18,938 | 0.36 | |||
| Shared SNPs | SD-Mal | 18 | 59 | 0.31 | 1.27 | 0.3722 |
| SD+ | 3688 | 15,363 | 0.24 |
-
Counts of non-synonymous (N) and synonymous (S) SNPs in the In(2R)Mal region of SD-Mal chromosomes, and the equivalent region of uninverted, SD+ chromosomes. N/S ratio per genotype, fold-change of N/S ratios between SD-Mal and SD+. p-values reported by Pearson’s χ2 test of independence.
Additional files
-
Supplementary file 1
Illumina data used in this paper, including those from Lack et al., 2016.
List of NCBI SRA accession numbers, genotype, number of reads, and estimated coverage for each line (Sheet 1). Per-chromosome depth of the SD-Mal lines sequenced in this paper (Sheet 2).
- https://cdn.elifesciences.org/articles/78981/elife-78981-supp1-v3.xls
-
Supplementary file 2
Measures of drive strength of +,+,px chromosomes in b c px/b c px x + + px/b c px crosses (see Figure 1—figure supplement 4): number of male and female b c px and + + px progeny; n, total progeny; k, average proportion of progeny inheriting the + + px chromosome; w, relative viability of + + px chromosomes; k*, average proportion of progeny inheriting the + + px chromosome, corrected for viability.
Genotypes (where BL156 or SD means consistent with either of those parental alleles): Sd (2L:19.44); inferred from visible markers and double checked with primers in Presgraves et al., 2009; In(2R)Mal distal breakpoint (2R:18.77; inferred from visible markers and double checked with primers in Supplementary file 4), sano (2R:18.87; inferred from molecular markers, primers in the Materials and methods section); CG15666 (2R:21.34; inferred from molecular markers, primers in the Materials and methods section) and px (2R:22.49; inferred from visible markers).
- https://cdn.elifesciences.org/articles/78981/elife-78981-supp2-v3.xlsx
-
Supplementary file 3
Number and density (SNPs/Mb) of private and shared SNPs in In(2R)Mal-p, In(2R)Mal-d and their overlapping area (inverted twice).
- https://cdn.elifesciences.org/articles/78981/elife-78981-supp3-v3.xls
-
Supplementary file 4
Sequence and coordinates of primers used to validate In(2R)Mal breakpoints.
- https://cdn.elifesciences.org/articles/78981/elife-78981-supp4-v3.xls
-
Supplementary file 5
Results of screening for the Sd-RanGAP duplication, In(2R)Mal, In(2R)NS, and In(2L)t inversions in DPGP3 dataset (Lack et al., 2016), and comparison with the most recent inversion calls (http://johnpool.net/Updated_Inversions.xls, last accessed 07/13/2020).
- https://cdn.elifesciences.org/articles/78981/elife-78981-supp5-v3.xls
-
Supplementary file 6
Average nucleotide diversity (π) per nucleotide and empirical standard deviation estimated in 10 kb windows along chromosome 2, for SD+, SD-Mal and SD+ scaled by the estimated frequency of SD-Mal chromosomes (SD+ × f; f = 1.47%); with repetitive elements masked (Sheet 1) and excluding SD-ZI138 (Sheet 2).
- https://cdn.elifesciences.org/articles/78981/elife-78981-supp6-v3.xls
-
MDAR checklist
- https://cdn.elifesciences.org/articles/78981/elife-78981-mdarchecklist1-v3.docx
Download links
A two-part list of links to download the article, or parts of the article, in various formats.
Downloads (link to download the article as PDF)
Open citations (links to open the citations from this article in various online reference manager services)
Cite this article (links to download the citations from this article in formats compatible with various reference manager tools)
Epistatic selection on a selfish Segregation Distorter supergene – drive, recombination, and genetic load
eLife 11:e78981.
https://doi.org/10.7554/eLife.78981


