Dynamic regulation of inter-organelle communication by ubiquitylation controls skeletal muscle development and disease onset
- Division of Genetics, Department of Medicine, Brigham and Women’s Hospital, Harvard Medical School, United States
- Proteomics Platform, Broad Institute of MIT and Harvard, United States
- Department of Pharmacology and Molecular Sciences, Johns Hopkins University School of Medicine, United States
- Department of Biological Chemistry and Molecular Pharmacology, Harvard Medical School, United States
- Department of Biology, Concordia University of Edmonton, Canada
- Faculty of Health and Medical Sciences, Centre of Medical Research, Harry Perkins Institute of Medical Research, University of Western Australia, Australia
- Division of Genetics, Boston Children’s Hospital, Harvard Medical School, United States
- Department of Anesthesiology, Brigham and Women’s Hospital, Harvard Medical School, United States
- Department of Anatomy and Cell Biology, McGill University, Canada
Figures
Figure 1 with 1 supplement
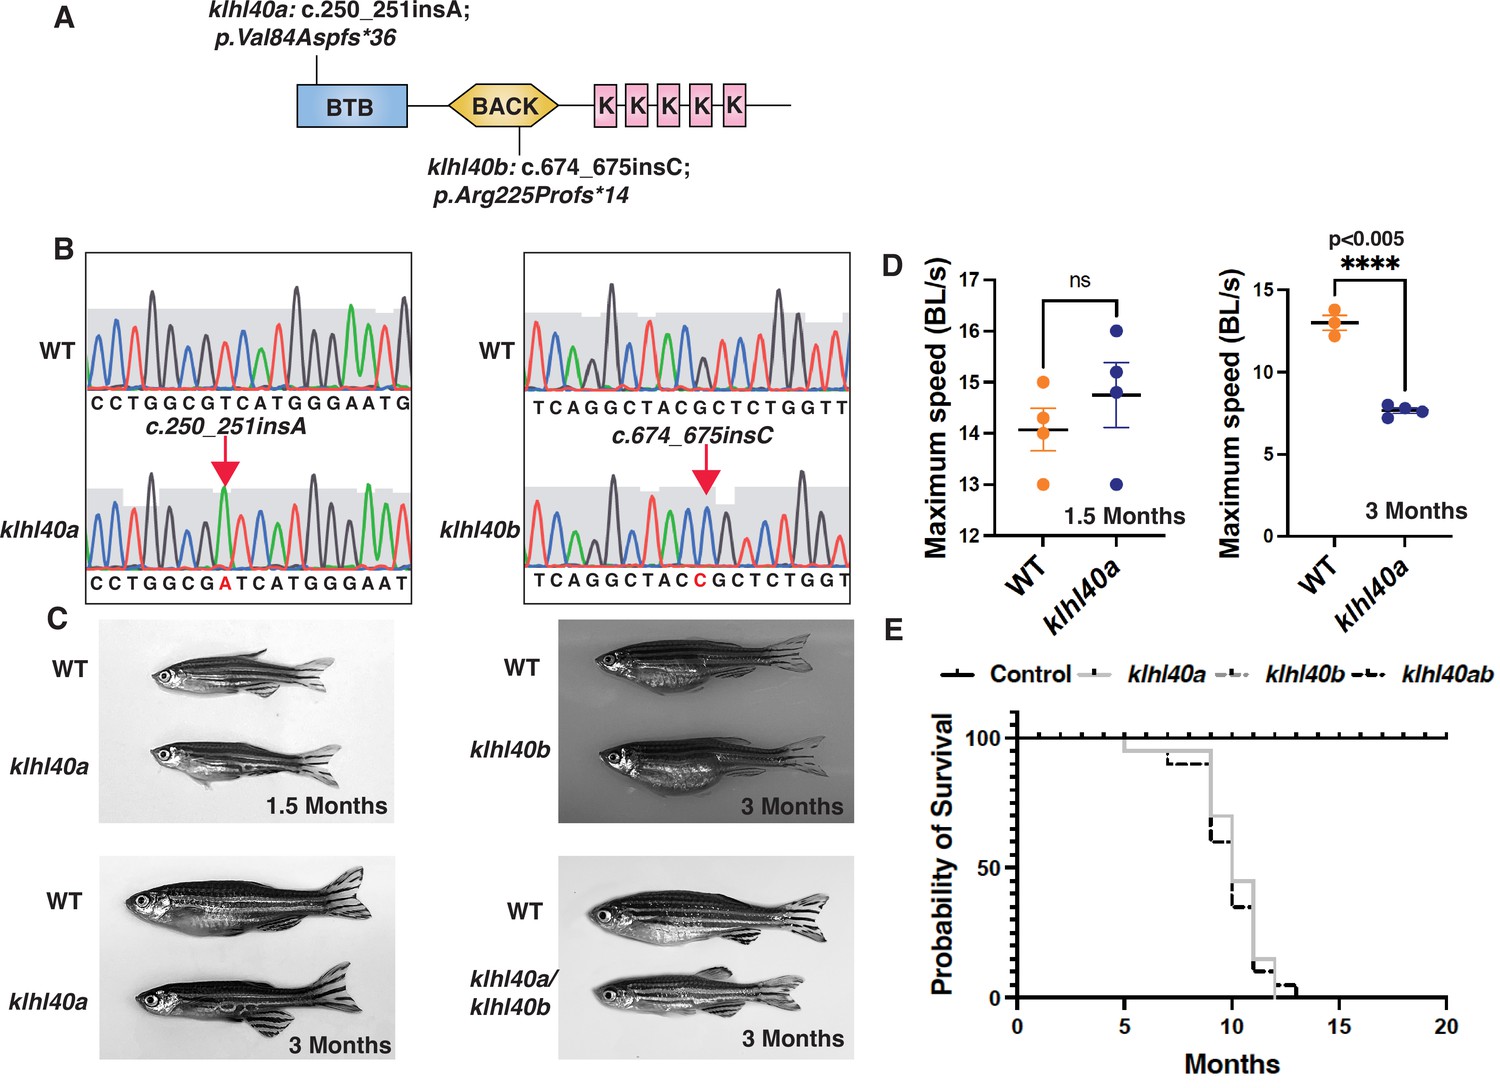
klhl40 is essential for vertebrate skeletal muscle development.
(A) Schematic diagram depicting the position of CRISPR-mediated mutant alleles and truncated proteins on the Kelch protein domain in klhl40abwg200 and klhl40bbwg202 knockout zebrafish. CRISPR-induced mutations in klhl40abwg200 and klhl40bbwg202 knockout zebrafish result in premature termination codons in BTB and BACK domain coding exons, respectively. (B) Sanger sequencing pherograms for control and klhl40a bwg200 and klhl40b bwg202 mutant zebrafish with an insertion of A in klhl40abwg200 and an insertion of C in klhl40bbwg202 coding regions. (C) Lateral view of the juvenile and adult zebrafish. klhl40a mutant zebrafish develop leaner bodies from transition to juvenile (1.5 months old) to the onset of the adult stage (3 months old) and exhibit reduced body length and body diameter. No obvious skeletal muscle phenotype is observed in the klhl40b allele compared to control (+/+) siblings. klhl40a/ klhl40b double mutant fish exhibit similar skeletal phenotype as observed in the klhl40a allele. (D) Endurance swimming behavior of klhl40a allele at juvenile state (1.5 months) and adult stage (3 months) (n=7–8). (E) The Kaplan-Meier survival curve of the different zebrafish groups was analyzed for 20 months (n=20 in each group). Data are mean ± S.E.M (unpaired t-test, parametric) for each experiment. Note: the survival curve of klhl40b mutant fish overlaps with the control fish.
Figure 1—figure supplement 1
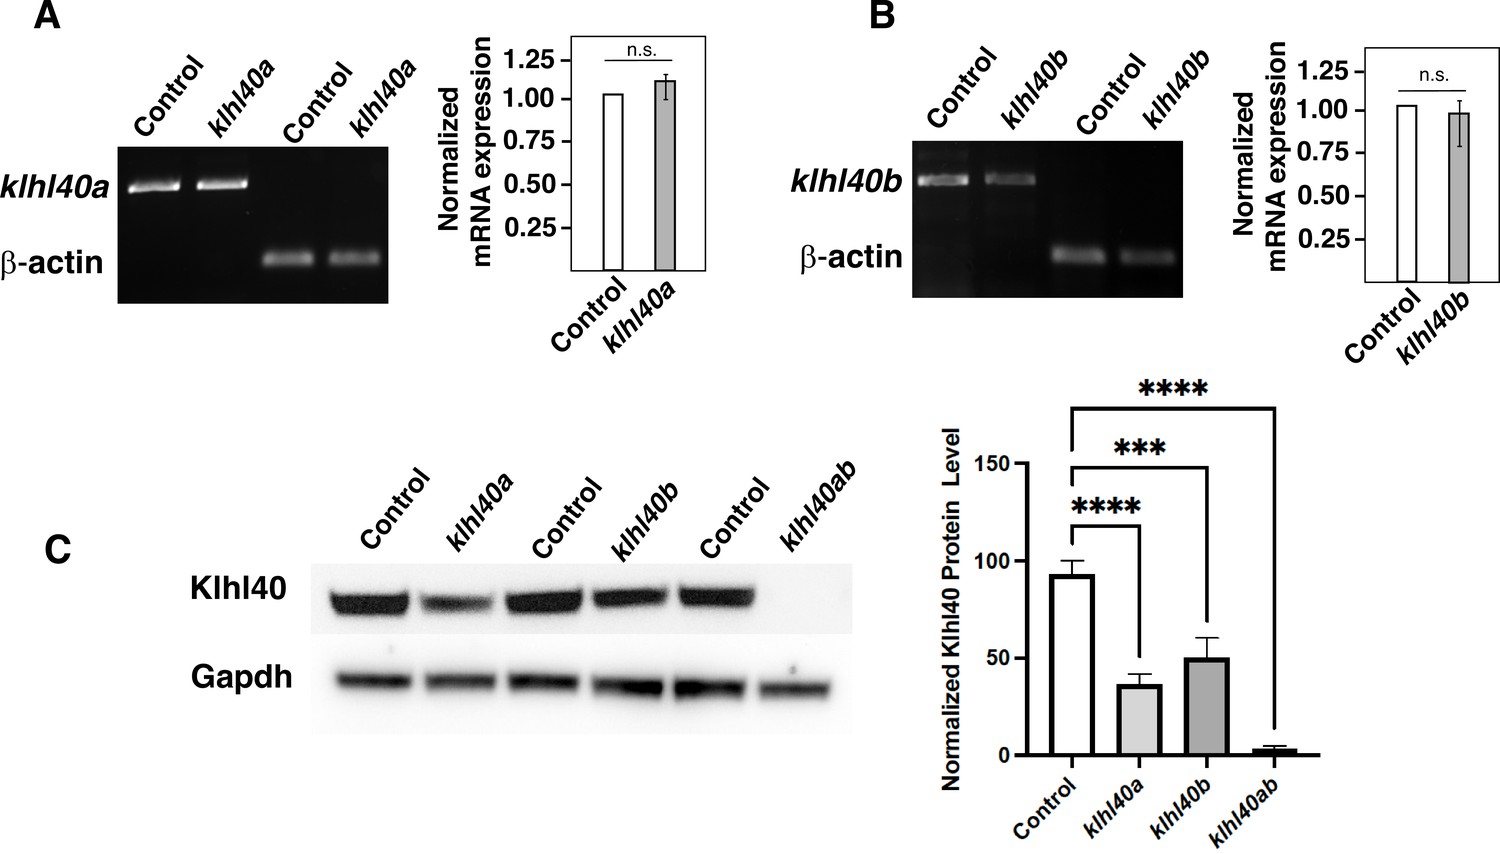
Quantification of KLHL40 mRNA and protein in klhl40abwg200 and klhl40bbwg202 alleles (3 months).
(A) RT-PCR analysis of control and klhl40abwg200 skeletal muscle (B) RT-PCR analysis of control and klhl40bbwg202 skeletal muscle. (C) Western blot analysis of protein extracts from control, klhl40abwg200, klhl40bbwg202, and klhl40abwg200/klhl40bbwg202 skeletal muscle.
-
Figure 1—figure supplement 1—source data 1
Raw DNA gel and immunoblots.
- https://cdn.elifesciences.org/articles/81966/elife-81966-fig1-figsupp1-data1-v2.zip
-
Figure 1—figure supplement 1—source data 2
Raw DNA gel and immunoblots.
- https://cdn.elifesciences.org/articles/81966/elife-81966-fig1-figsupp1-data2-v2.zip
-
Figure 1—figure supplement 1—source data 3
Raw DNA gel and immunoblots.
- https://cdn.elifesciences.org/articles/81966/elife-81966-fig1-figsupp1-data3-v2.zip
-
Figure 1—figure supplement 1—source data 4
Annotated gels.
- https://cdn.elifesciences.org/articles/81966/elife-81966-fig1-figsupp1-data4-v2.pdf
Figure 2 with 1 supplement
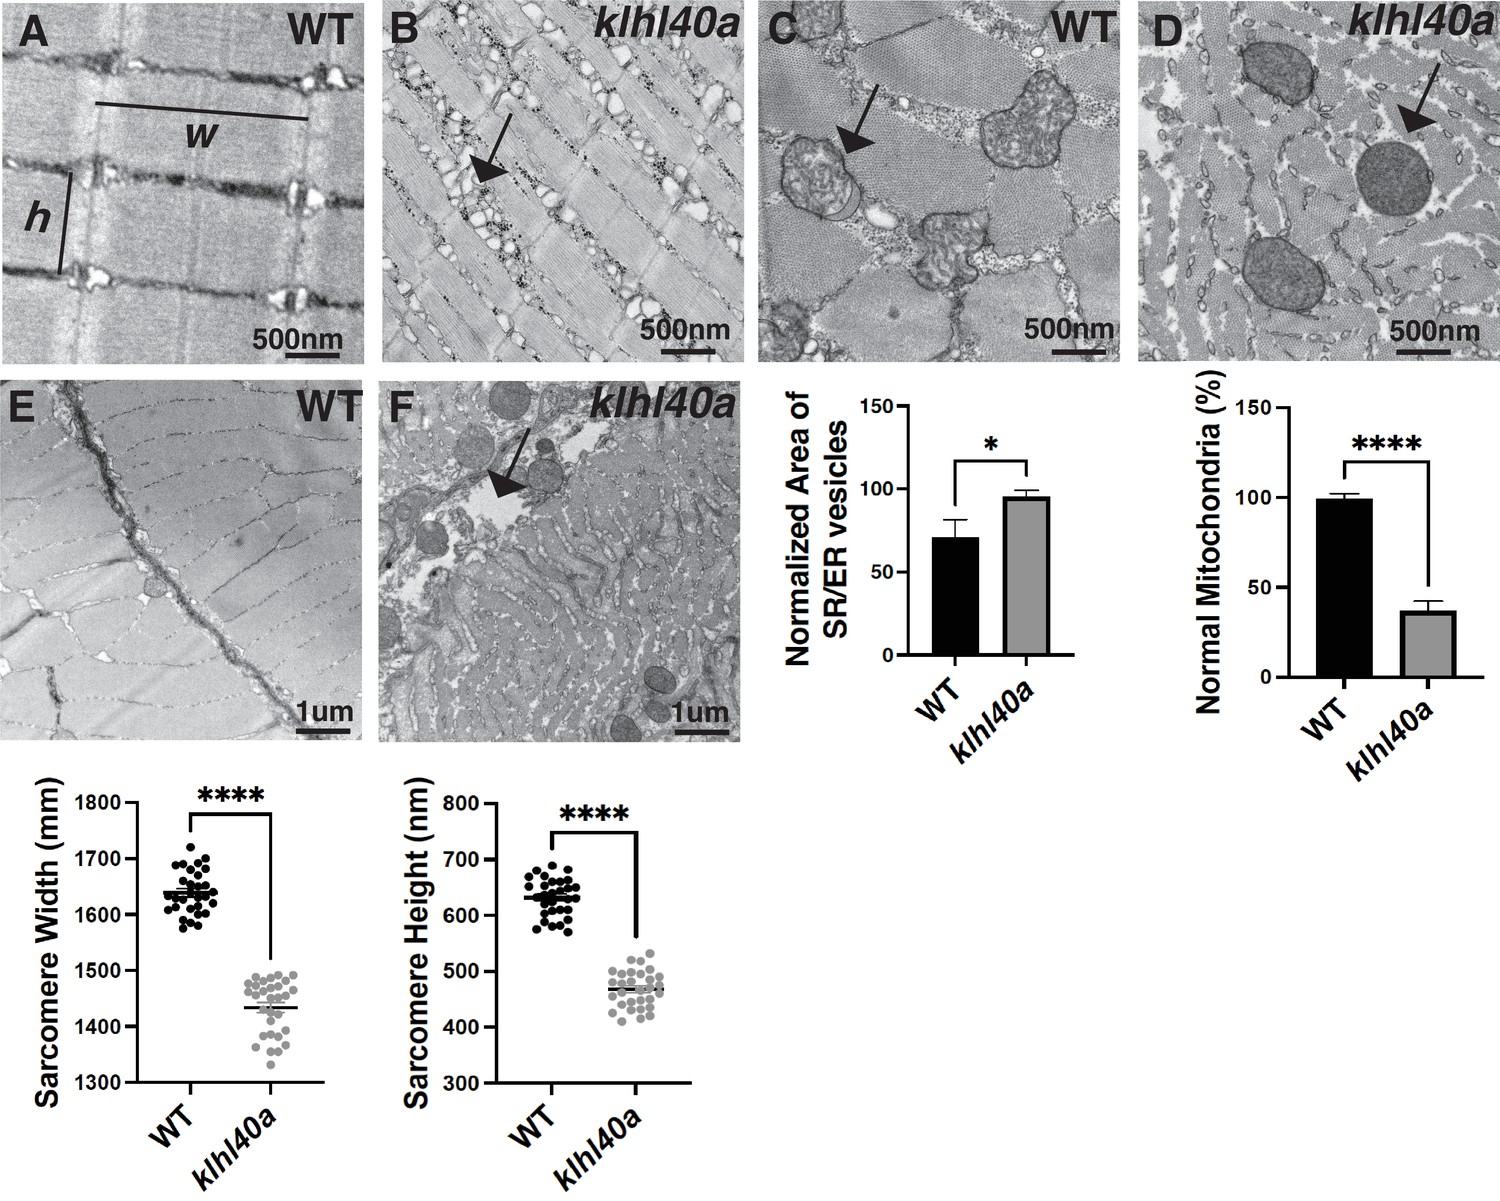
klhl40a allele displays reduced sarcomere size and abnormal membrane organelles in skeletal muscle.
Transmission electron microscopy (TEM) showing the ultrastructure of control (+/+) and klhl40a KO in 3 months animals. (A–B) Longitudinal muscle section of control and klhl40a KO mutant muscle showing accumulation of membranous structures in SR-ER region (arrow) and reduced sarcomere width (w) and height (h). (C–D) Cross-section view showing mitochondrial in klhl40a KO mutant muscle contain electron-dense matrix (arrow) compared to control muscle (normal mitochondria). (E–F) The longitudinal view of skeletal muscle shows structural damage to the extracellular matrix (arrow) in the klhl40a KO mutant compared to the control. Electron microscopy was performed in three different control and klhl40a KO mutant fish. N=150–175 sarcomeres analyzed in each sample for quantification. N=75–100 mitochondria and 200–250 triads analyzed in each sample for quantification of the ER. Data are mean ± S.E.M; with one-way analysis of variance (ANOVA) and Tukey’s HSD test (****p<0.001).
Figure 2—figure supplement 1
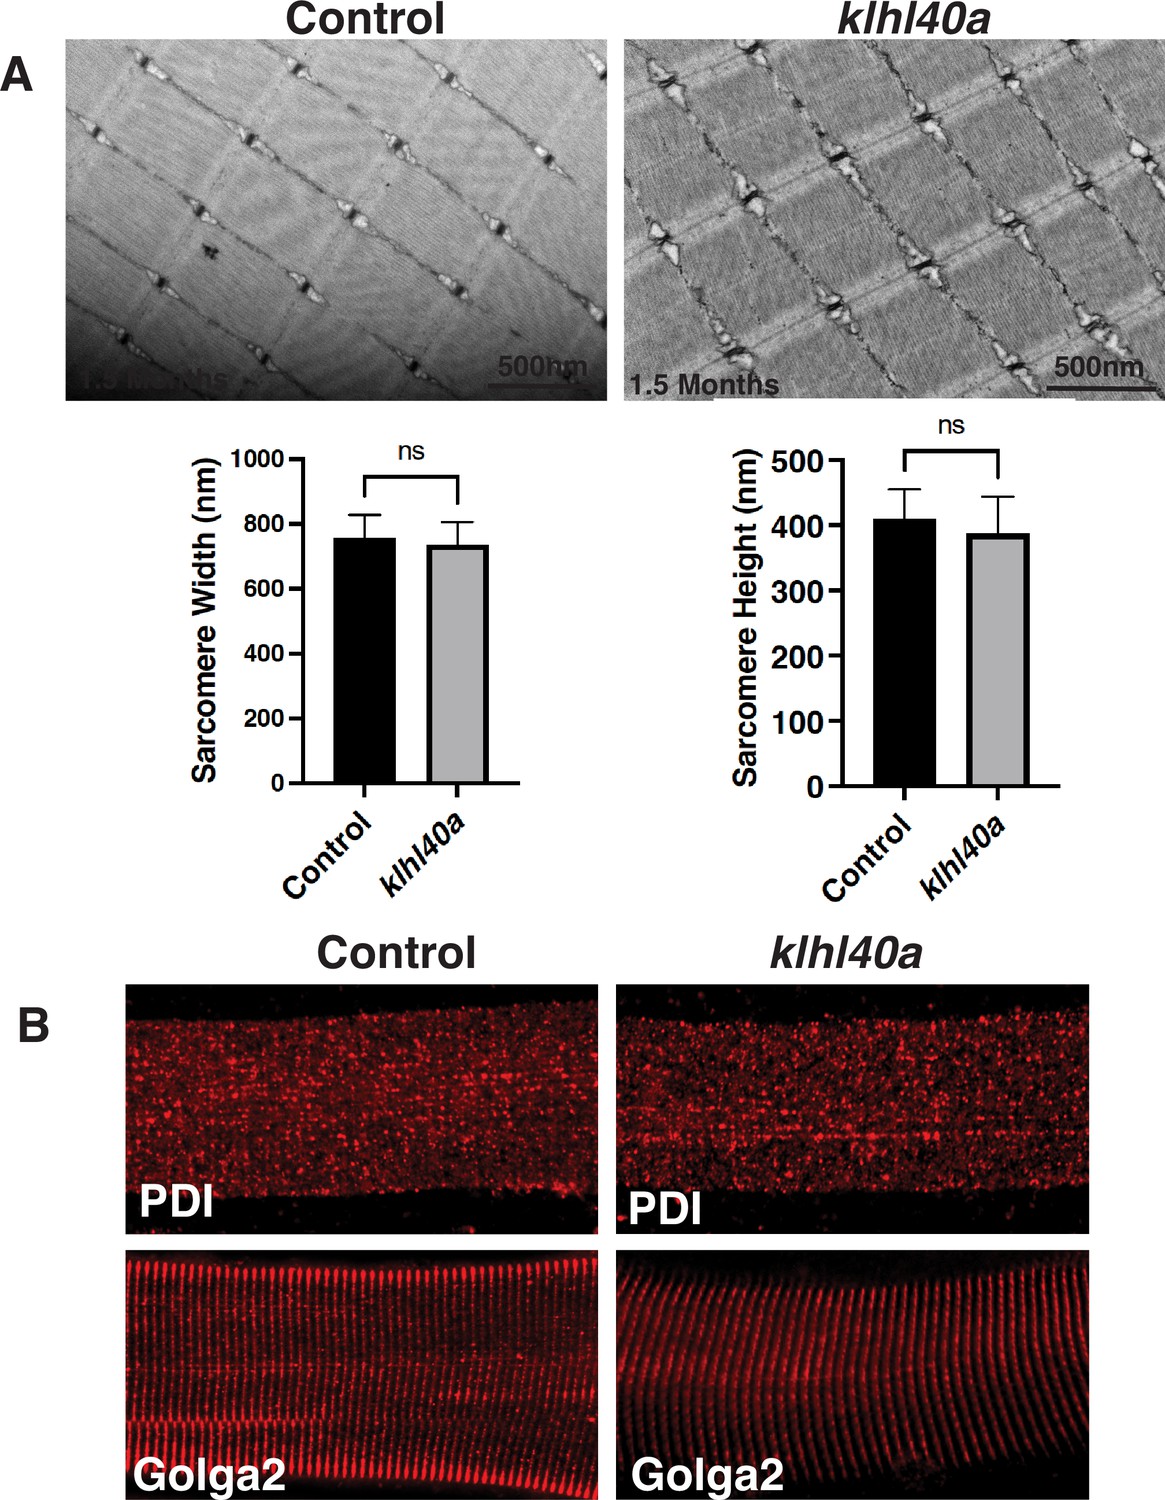
Skeletal muscle structure is not affected in Klhl40a deficiency at 1.5 months.
(A) Transmission electron microscopic images of the longitudinal skeletal muscle sections and quantification of the sarcomere size. N=150–175 sarcomeres were analyzed in each sample for quantification. Data are mean ± S.E.M; with one-way analysis of variance (ANOVA) and Tukey’s HSD test (****p<0.001). (B) Immunofluorescence of control and klhl40a mutant myofibers to visualize ER (PDI) and the Golgi (Golga2).
Figure 3 with 2 supplements
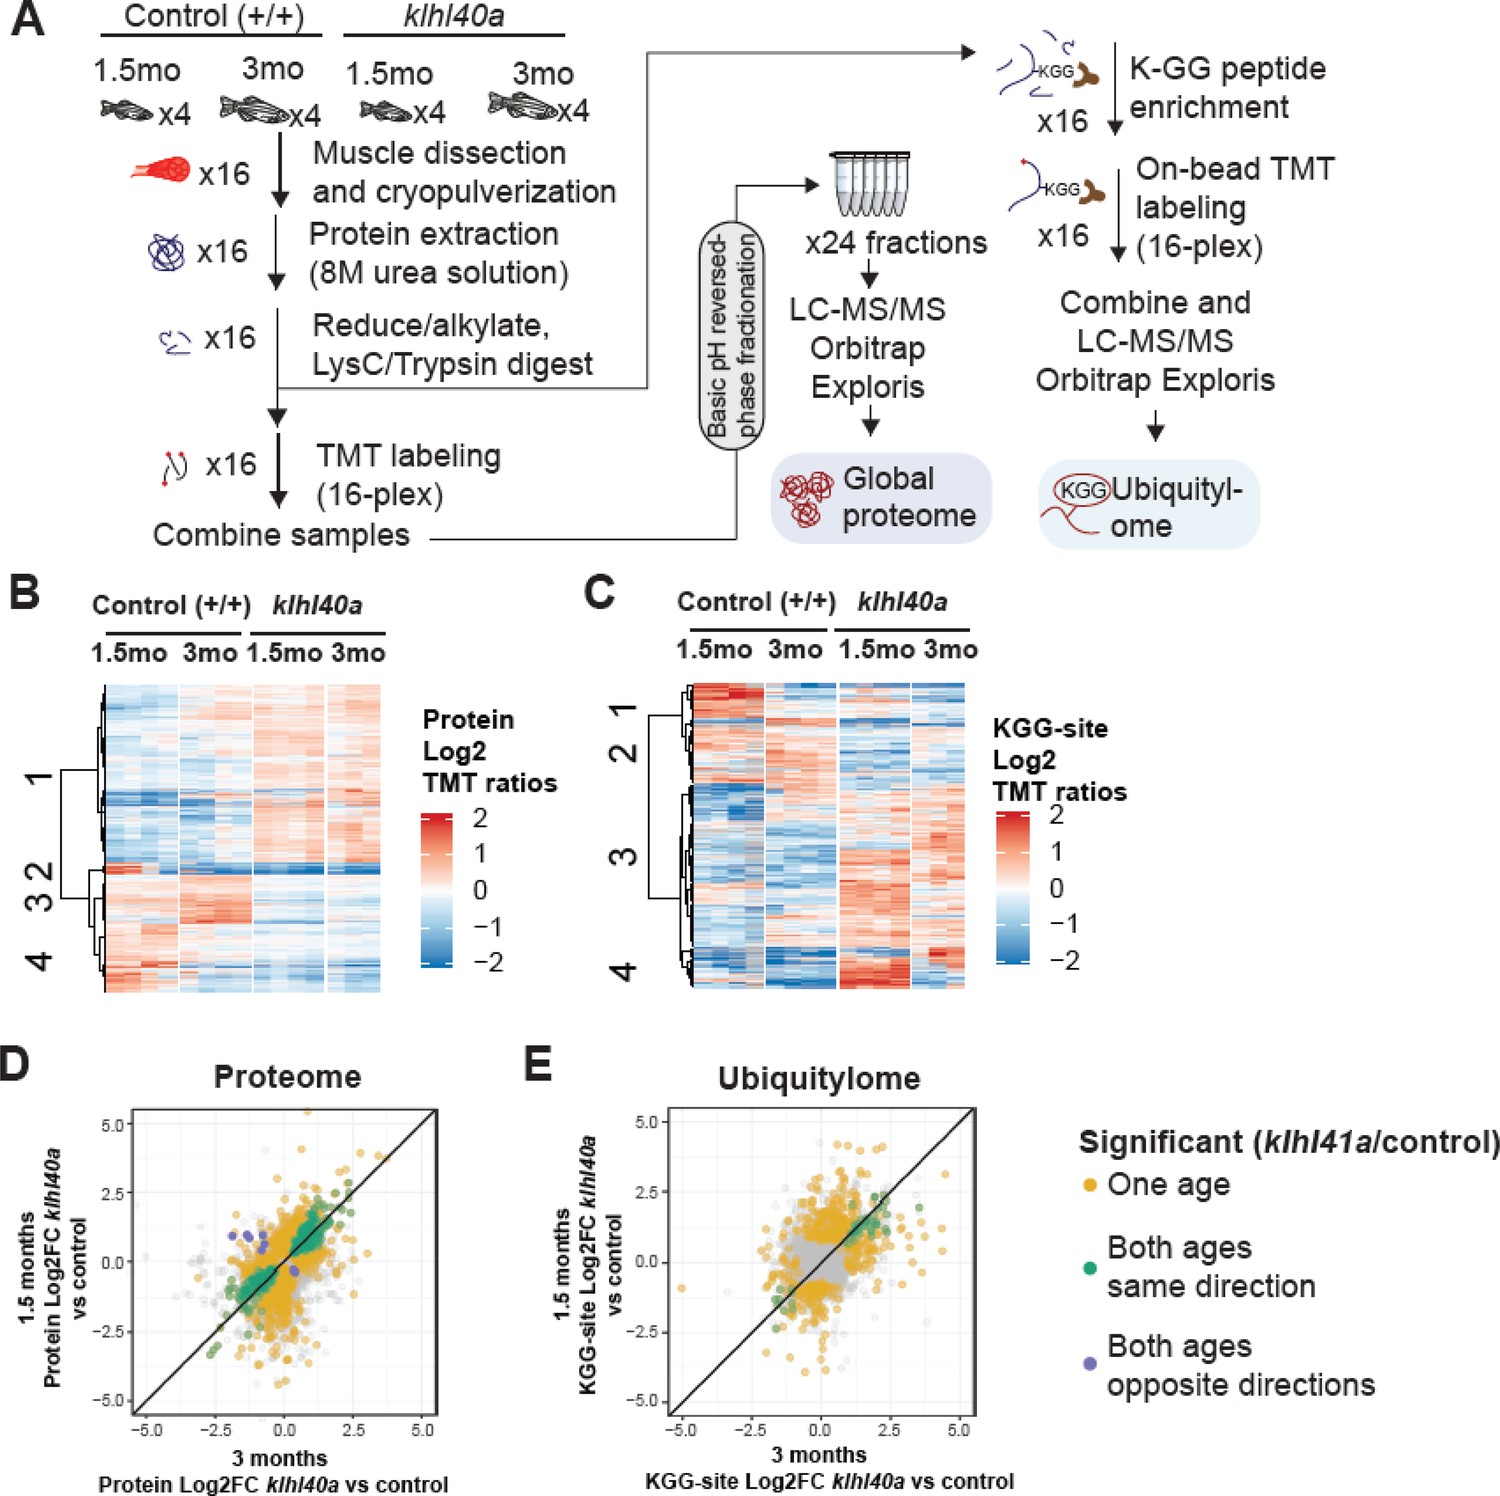
Proteome and ubiquitylome disruption by Klhl40a deficiency.
(A) Experimental workflow for proteome and ubiquitylome quantification in klhl40a allele. (B) Heatmap showing protein abundances (log2 TMT ratios) across experimental samples. Only proteins with a significant differential response between control and klhl40a KO samples are shown (adjusted P-value <0.05). Proteins (rows) were clustered to show abundance patterns across experimental groups. (C) Heatmap showing ubiquitin sites following trypsin digestion (KGG)-site abundances (log2 TMT ratios) across experimental samples. Only proteins with a significant differential response between control and klhl40a KO samples are shown (adjusted P-value <0.05). KGG sites (rows) were clustered to show abundance patterns across experimental groups. (D) Correlation of protein response to klhl40a KO across juvenile (1.5 months) and adult animals (3 months). Plots show log2 fold changes for proteins quantified at both ages. Proteins are colored if they show differential abundance (adjusted p-value <0.05) at one age only (yellow), both ages with the same direction (green), and both ages with opposite directions (purple). (E) Correlation of ubiquitylome response to klhl40a KO across juvenile (1.5 months) and adult animals (3 months). Plots show log2 fold-changes for KGG-sites quantified at both ages. KGG sites are colored if they show differential abundance (adjusted p-value <0.05) at one age only (yellow), both ages with the same direction (green), and both ages with opposite directions (purple).
Figure 3—figure supplement 1
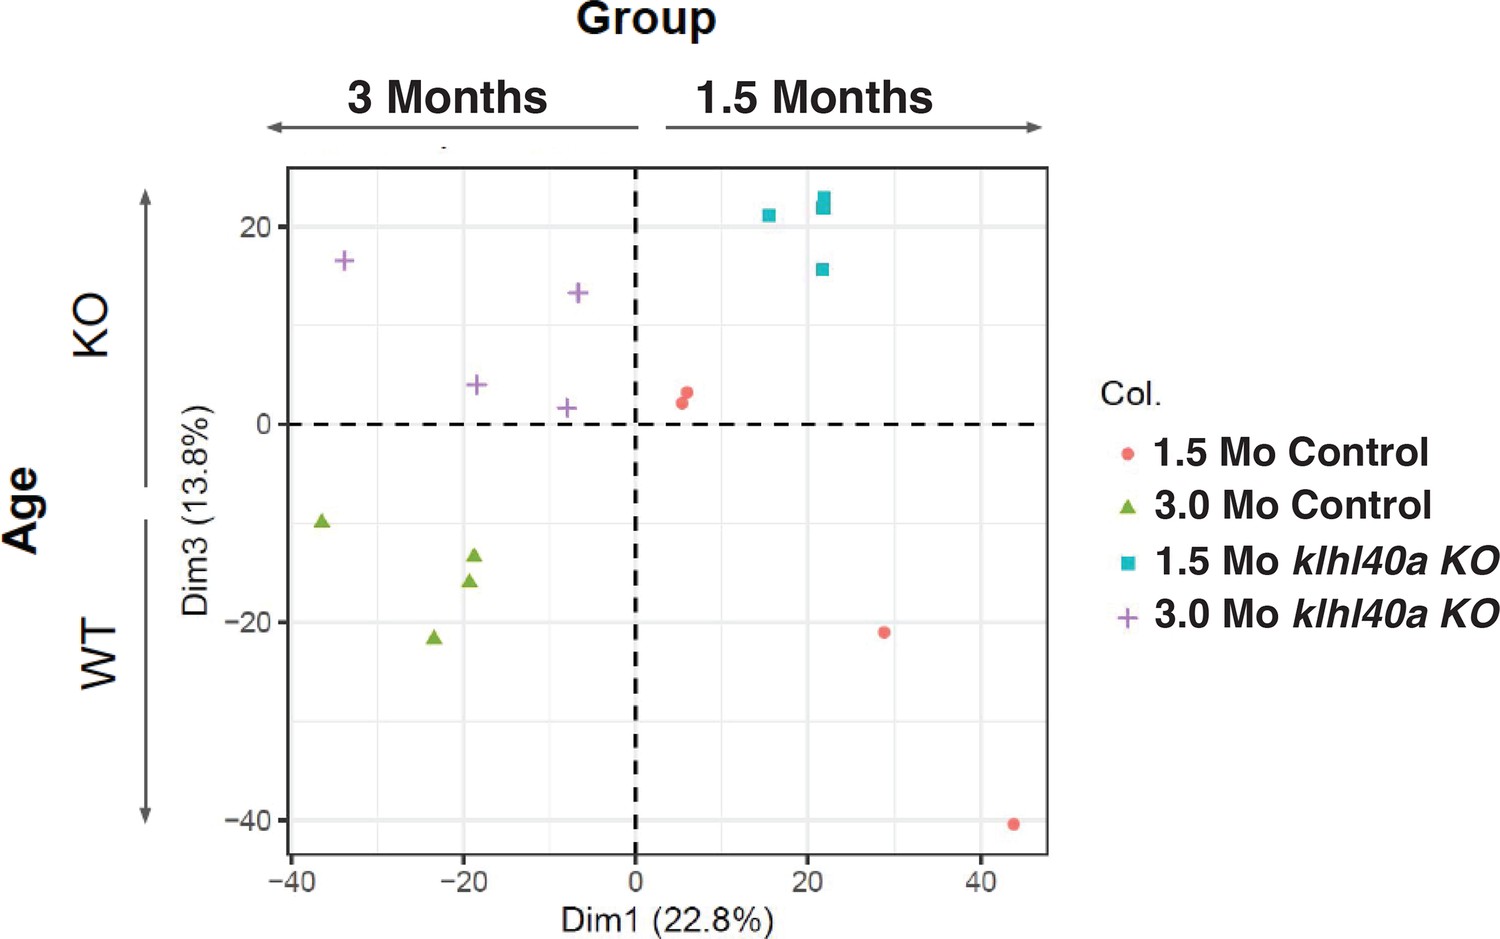
PCA plot of proteomics data shows clustering of normal and disease groups across ages.
Figure 3—figure supplement 2

Overlap of proteomics and transcriptome data.
Differential proteins identified between control and klhl40abwg200 mutants at 3 months were compared with differential RNA-seq data from control klhl40abwg200 mutant skeletal muscle tissue (3 months) by GeneVenn.
Figure 4 with 1 supplement
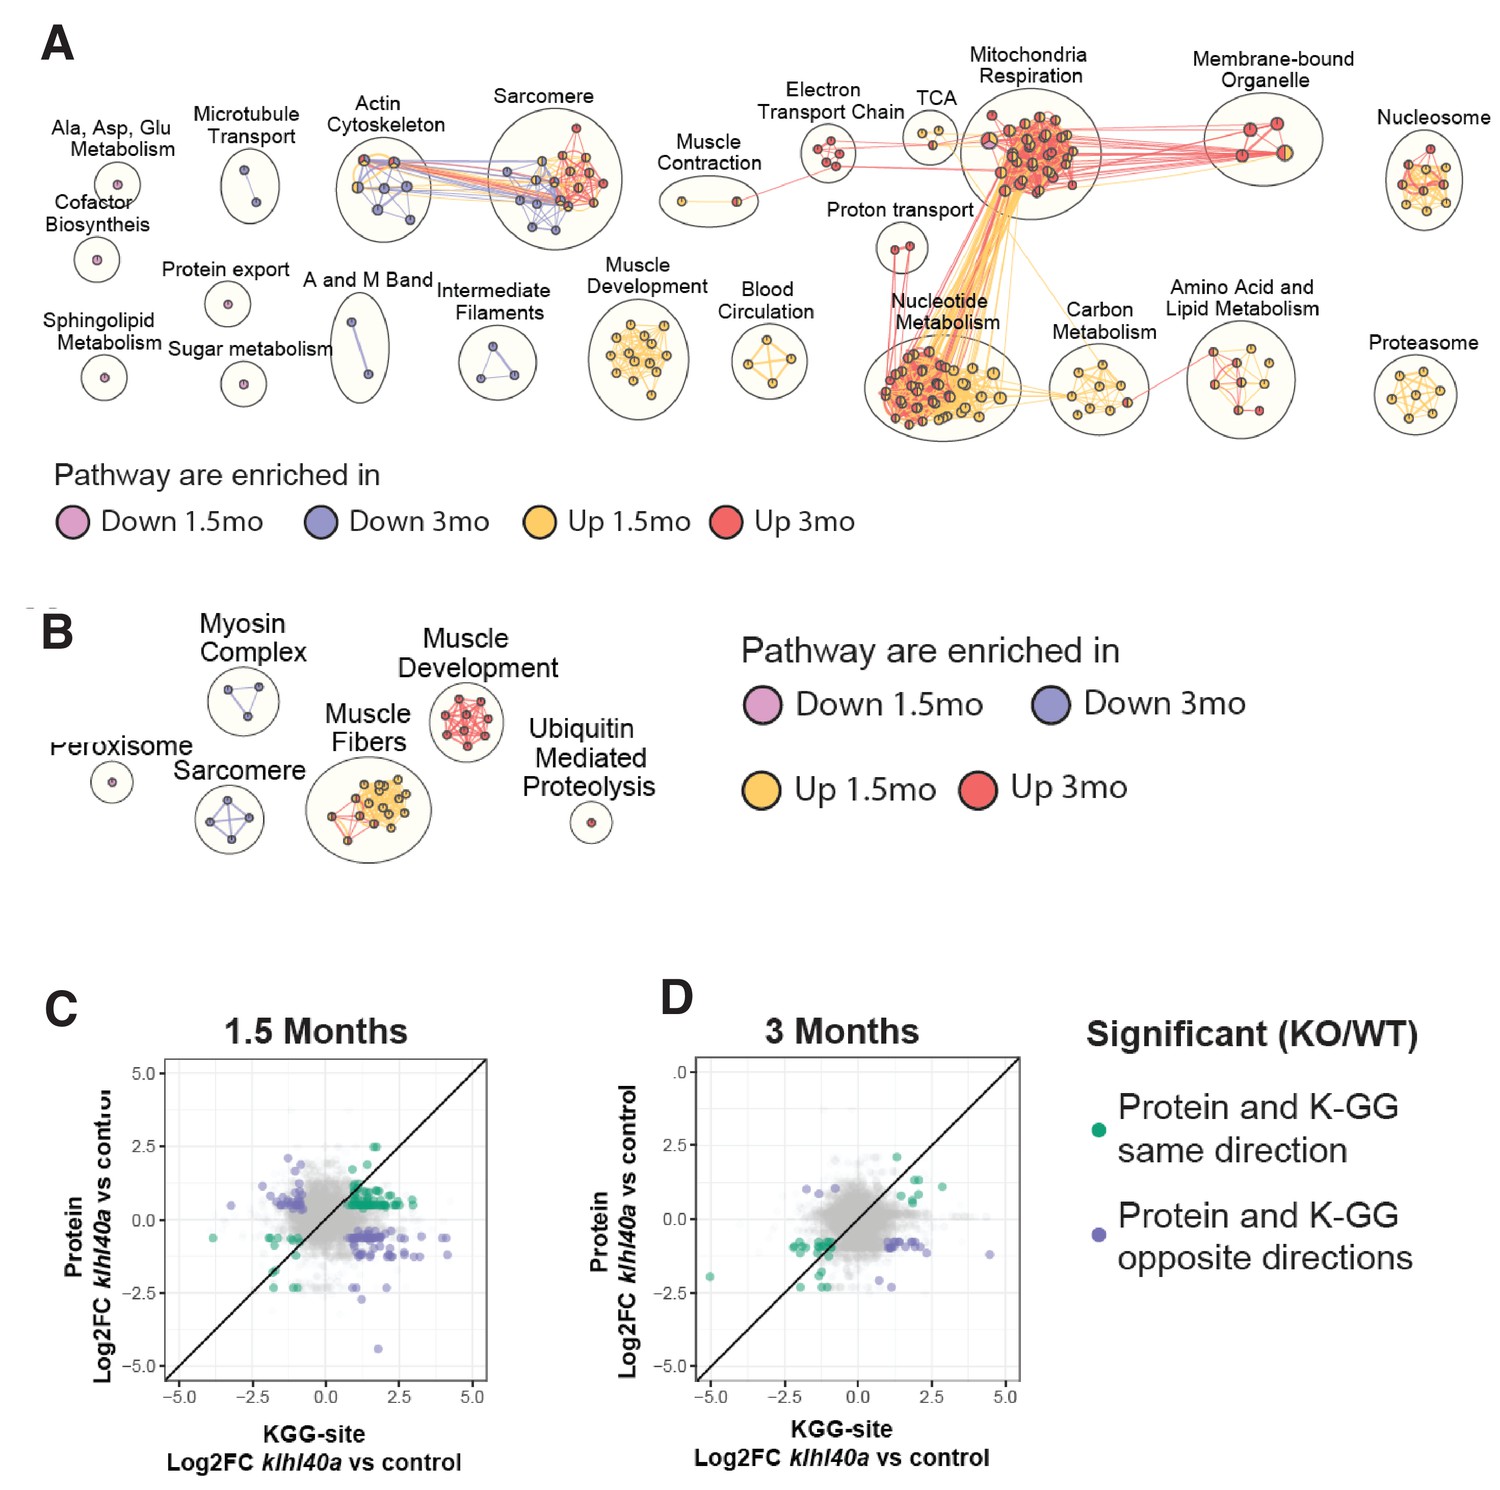
Pathways regulated by changes in proteome and ubiquitylome mediated by Klhl40a.
(A) Network visualization of pathway enrichment results from klhl40a KO differential proteins compared to controls. Nodes (circles) indicate pathways significantly enriched in proteins that increase at 1.5 months, decrease at 1.5 months, increase at 3 months, or decrease at 3 months. Edges (connections) show nodes with overlapping genes. Clusters of nodes summarize pathways with similar biological functions. (B) Network visualization of pathway enrichment results from klhl40a KO differential KGG-sites compared to control. Nodes (circles) indicate pathways significantly enriched in KGG sites that increase at 1.5 months, decrease at 1.5 months, increase at 3 months, or decrease at 3 months. Edges (connections) indicate nodes with overlapping genes. Clusters of nodes summarize pathways with similar biological functions. (C) Fold-changes of KGG-sites and their cognate protein in response to klhl40a KO in 1.5 months animals compared to controls. Data points are colored if both the KGG-site and the cognate protein show differential abundance in KO vs. (+/+) control and have the same direction (green) or opposite directions (purple). (D) Fold-changes of KGG-sites and their cognate protein in response to klhl40a KO in 3 months animals compared to controls. Data points are colored if both the KGG-site and the cognate protein show differential abundance in KO vs. (+/+) control and have the same direction (green) or opposite directions (purple).
Figure 4—figure supplement 1
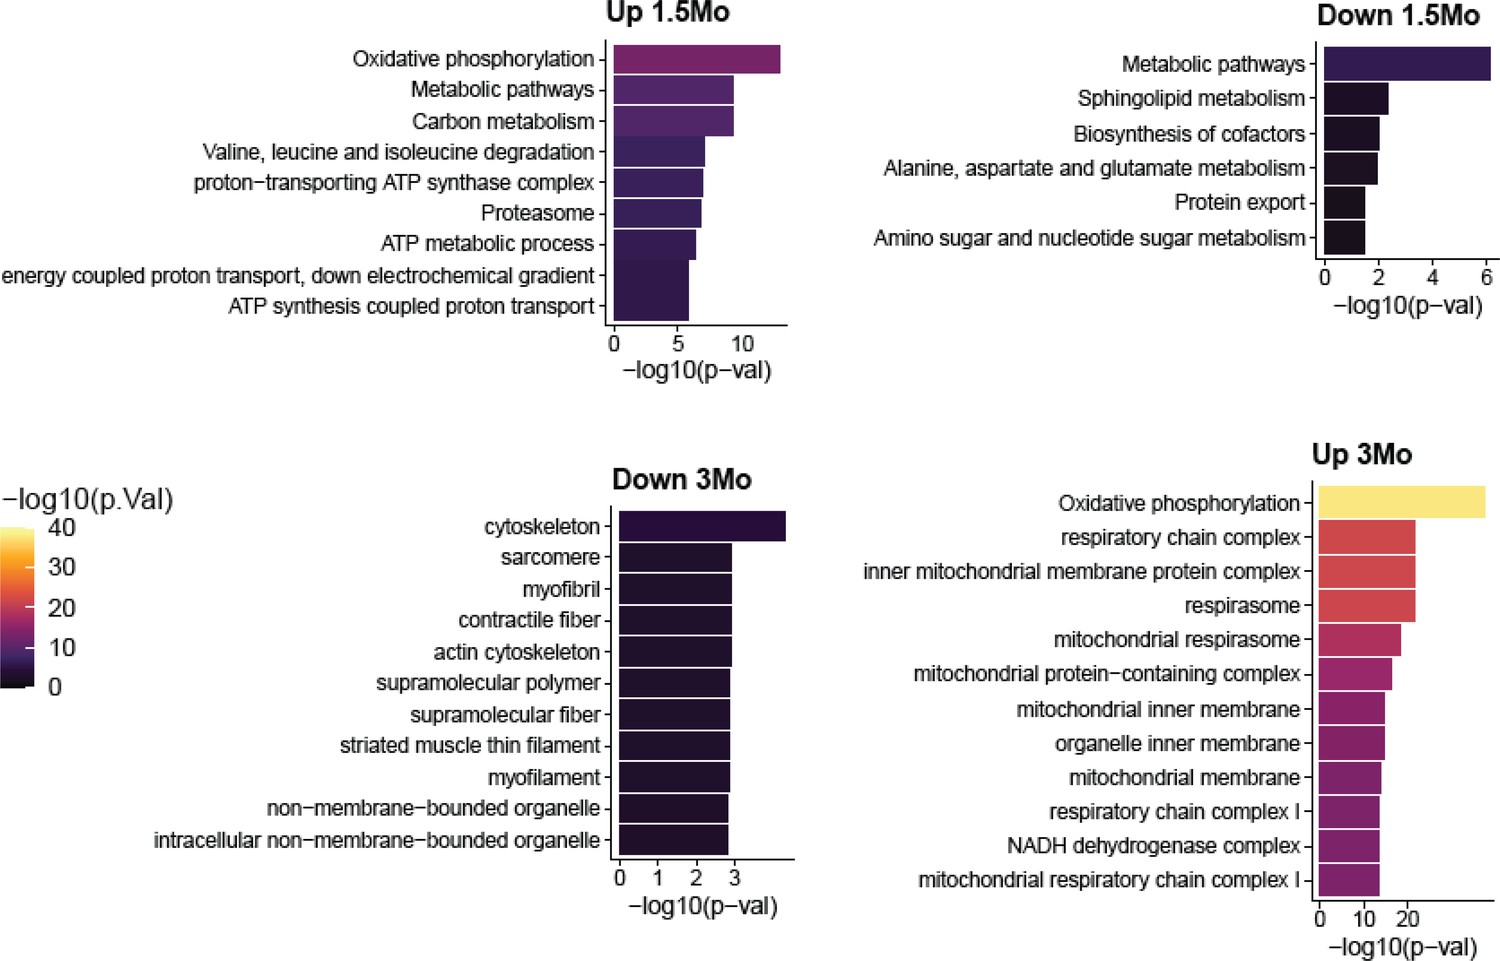
Top pathway enrichments in proteins that increase or decrease in klhl40a KO at 1.5 months and 3 months.
Up to 10 pathways per group are shown.
Figure 5
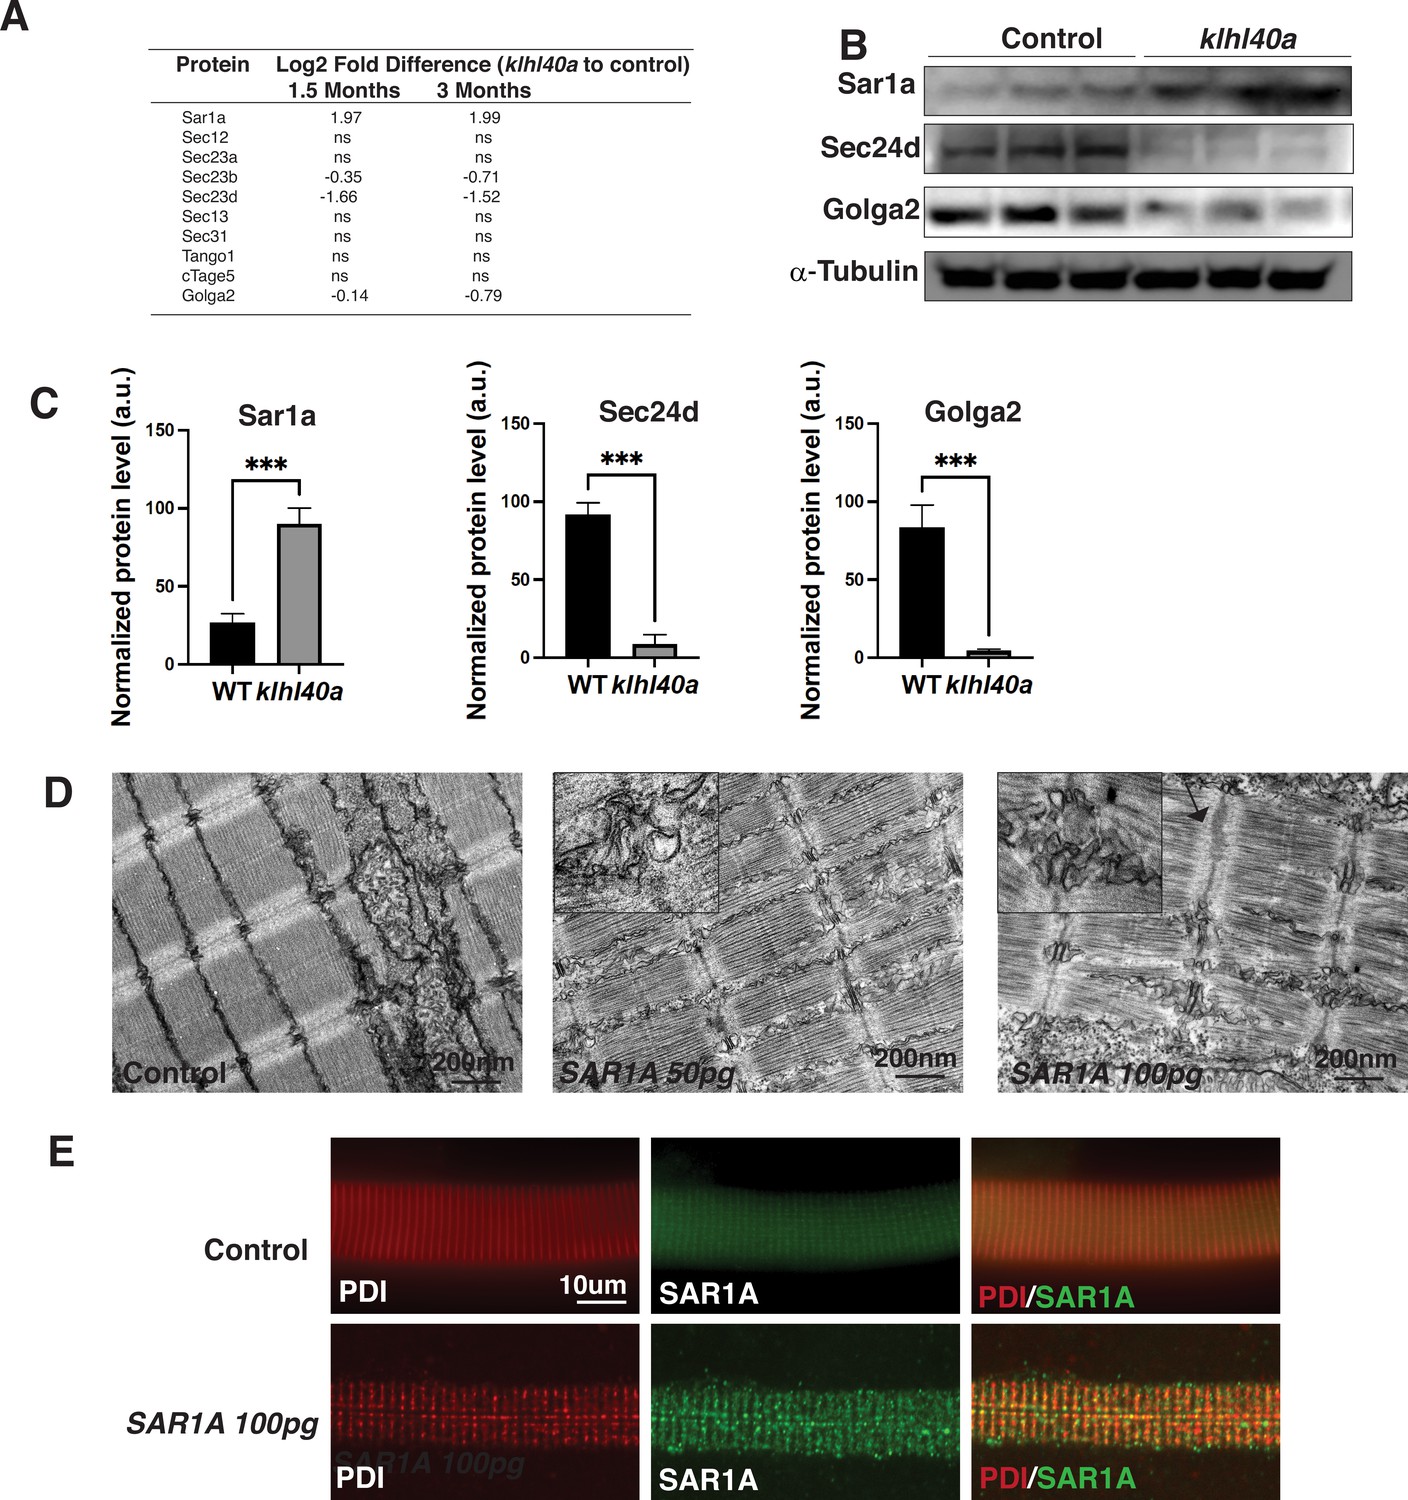
Klhl40a loss results in perturbation of the ER-Golgi vesicle trafficking through secretion-associated Ras GTPase (Sar1a).
(A) ER-Golgi vesicle trafficking proteins exhibit altered levels in klhl40a mutant muscle compared to control (+/+) in proteome analysis; ns indicates no significant difference (B) Western blot showing ER-exit site protein Sar1a is upregulated in klhl40a mutant muscle, and downstream COPII and Golgi proteins are downregulated in mutant muscle (3mo) (C) Quantification of the protein by Western blot in klhl40a and control zebrafish. N=3 in each group. Data are mean ± S.E.M; with one-way ANOVA and Tukey’s HSD test (****p<0.001). (D) Transmission electron microscopy (TEM) of zebrafish larva (4 dpf) with SAR1A mRNA overexpression demonstrating abnormal membrane structures in the SR-ER region. (E) Immunofluorescence of control and SAR1A overexpressing myofibers (5 dpf); n=25–30 myofibers in each group.
-
Figure 5—source data 1
Full unedited Sar1a immunoblot.
- https://cdn.elifesciences.org/articles/81966/elife-81966-fig5-data1-v2.zip
-
Figure 5—source data 2
Full unedited Sec24d immunoblot.
- https://cdn.elifesciences.org/articles/81966/elife-81966-fig5-data2-v2.zip
-
Figure 5—source data 3
Full unedited Golga2 immunoblot.
- https://cdn.elifesciences.org/articles/81966/elife-81966-fig5-data3-v2.zip
-
Figure 5—source data 4
Full unedited α-tubulin immunoblot.
- https://cdn.elifesciences.org/articles/81966/elife-81966-fig5-data4-v2.zip
-
Figure 5—source data 5
Annotated immunoblots.
- https://cdn.elifesciences.org/articles/81966/elife-81966-fig5-data5-v2.pdf
-
Figure 5—source data 6
Proteomic data for autophagy markers.
- https://cdn.elifesciences.org/articles/81966/elife-81966-fig5-data6-v2.xlsx
Figure 6 with 1 supplement
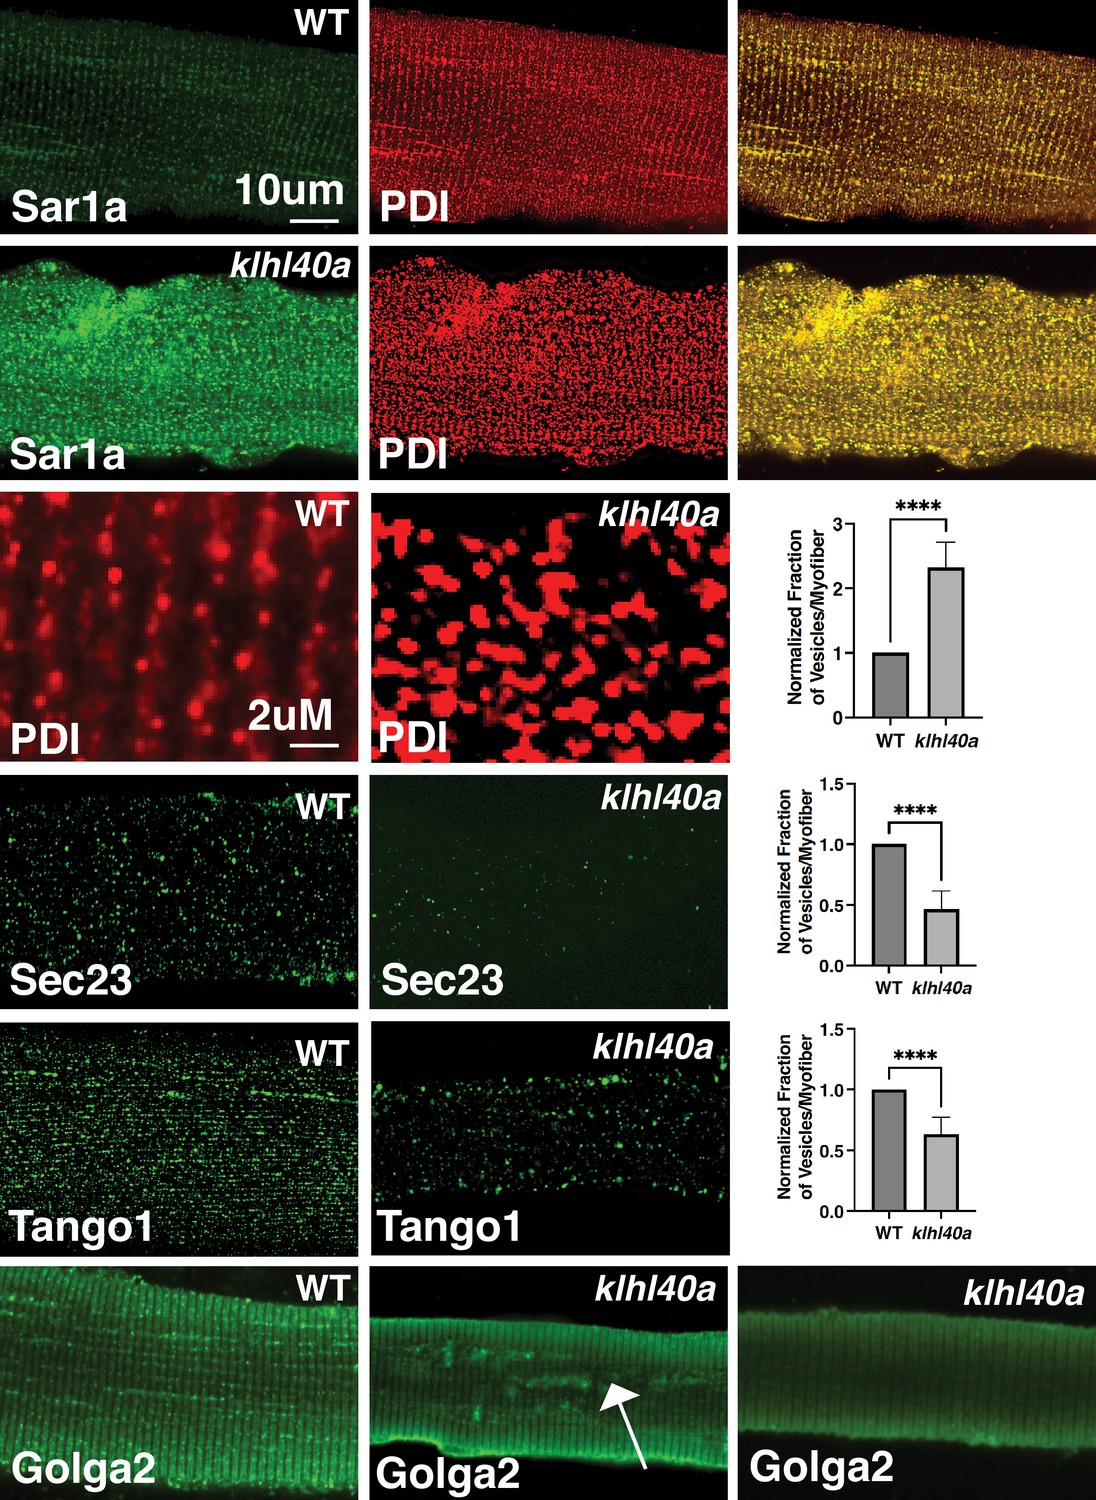
Morphological changes in vesicular trafficking compartments in Klhl40a deficient myofibers.
Sar1a is increased and co-localized with PDI in Klhl40a deficiency. The number of PDI-positive foci is also increased in the absence of Klhl40a. The fraction of Sec23 and Tango1 positive foci is decreased in klhl40a mutant myofibers. Disruption of the Golgi architecture was observed in a fraction of Klhl40a deficient myofibers. Data are mean ± S.E.M (unpaired t-test, parametric) for each quantification.
Figure 6—figure supplement 1
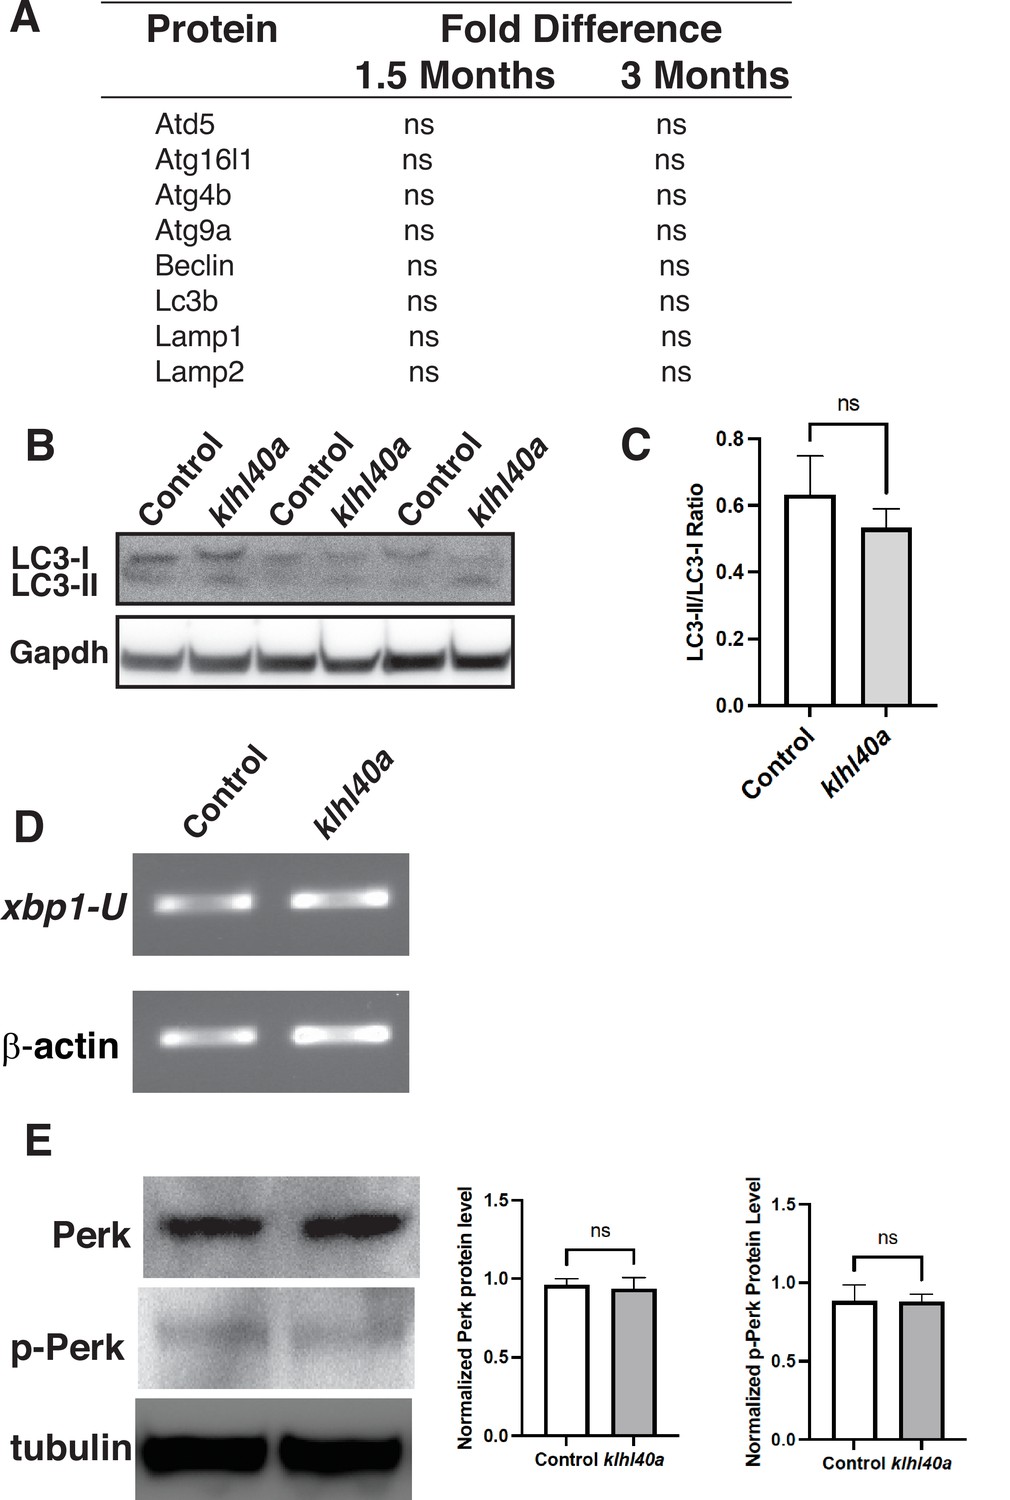
Klhl40a deficiency does not affect protein levels of autophagy markers in skeletal muscle.
(A) Examination of autophagy markers in the proteome of controls and klhl41a mutant skeletal muscle at 1.5 months and 3 months of age (ns: nonsignificant). (B) Western blot of control and klhl40a skeletal muscle extracts with LC3B antibody. (C) Quantification of the LC-II/LC-I ratio by Western blot analysis. (D) RT-PCR assay for xbp1 transcripts in control and klhl41a mutant skeletal muscle. (E) Western Blot and protein quantification of Perk and P-Perk in control and klhl41a mutant skeletal muscle. Data are mean ± S.E.M (unpaired t-test, parametric).
-
Figure 6—figure supplement 1—source data 1
Raw immunoblots.
- https://cdn.elifesciences.org/articles/81966/elife-81966-fig6-figsupp1-data1-v2.zip
-
Figure 6—figure supplement 1—source data 2
Raw immunoblots.
- https://cdn.elifesciences.org/articles/81966/elife-81966-fig6-figsupp1-data2-v2.zip
-
Figure 6—figure supplement 1—source data 3
Raw immunoblots.
- https://cdn.elifesciences.org/articles/81966/elife-81966-fig6-figsupp1-data3-v2.zip
-
Figure 6—figure supplement 1—source data 4
Raw immunoblots.
- https://cdn.elifesciences.org/articles/81966/elife-81966-fig6-figsupp1-data4-v2.zip
-
Figure 6—figure supplement 1—source data 5
Raw immunoblots.
- https://cdn.elifesciences.org/articles/81966/elife-81966-fig6-figsupp1-data5-v2.zip
-
Figure 6—figure supplement 1—source data 6
Raw immunoblots.
- https://cdn.elifesciences.org/articles/81966/elife-81966-fig6-figsupp1-data6-v2.zip
-
Figure 6—figure supplement 1—source data 7
Annotated gels.
- https://cdn.elifesciences.org/articles/81966/elife-81966-fig6-figsupp1-data7-v2.pdf
-
Figure 6—figure supplement 1—source data 8
Raw proteomics data for autophagy markers.
- https://cdn.elifesciences.org/articles/81966/elife-81966-fig6-figsupp1-data8-v2.xlsx
Figure 7 with 1 supplement
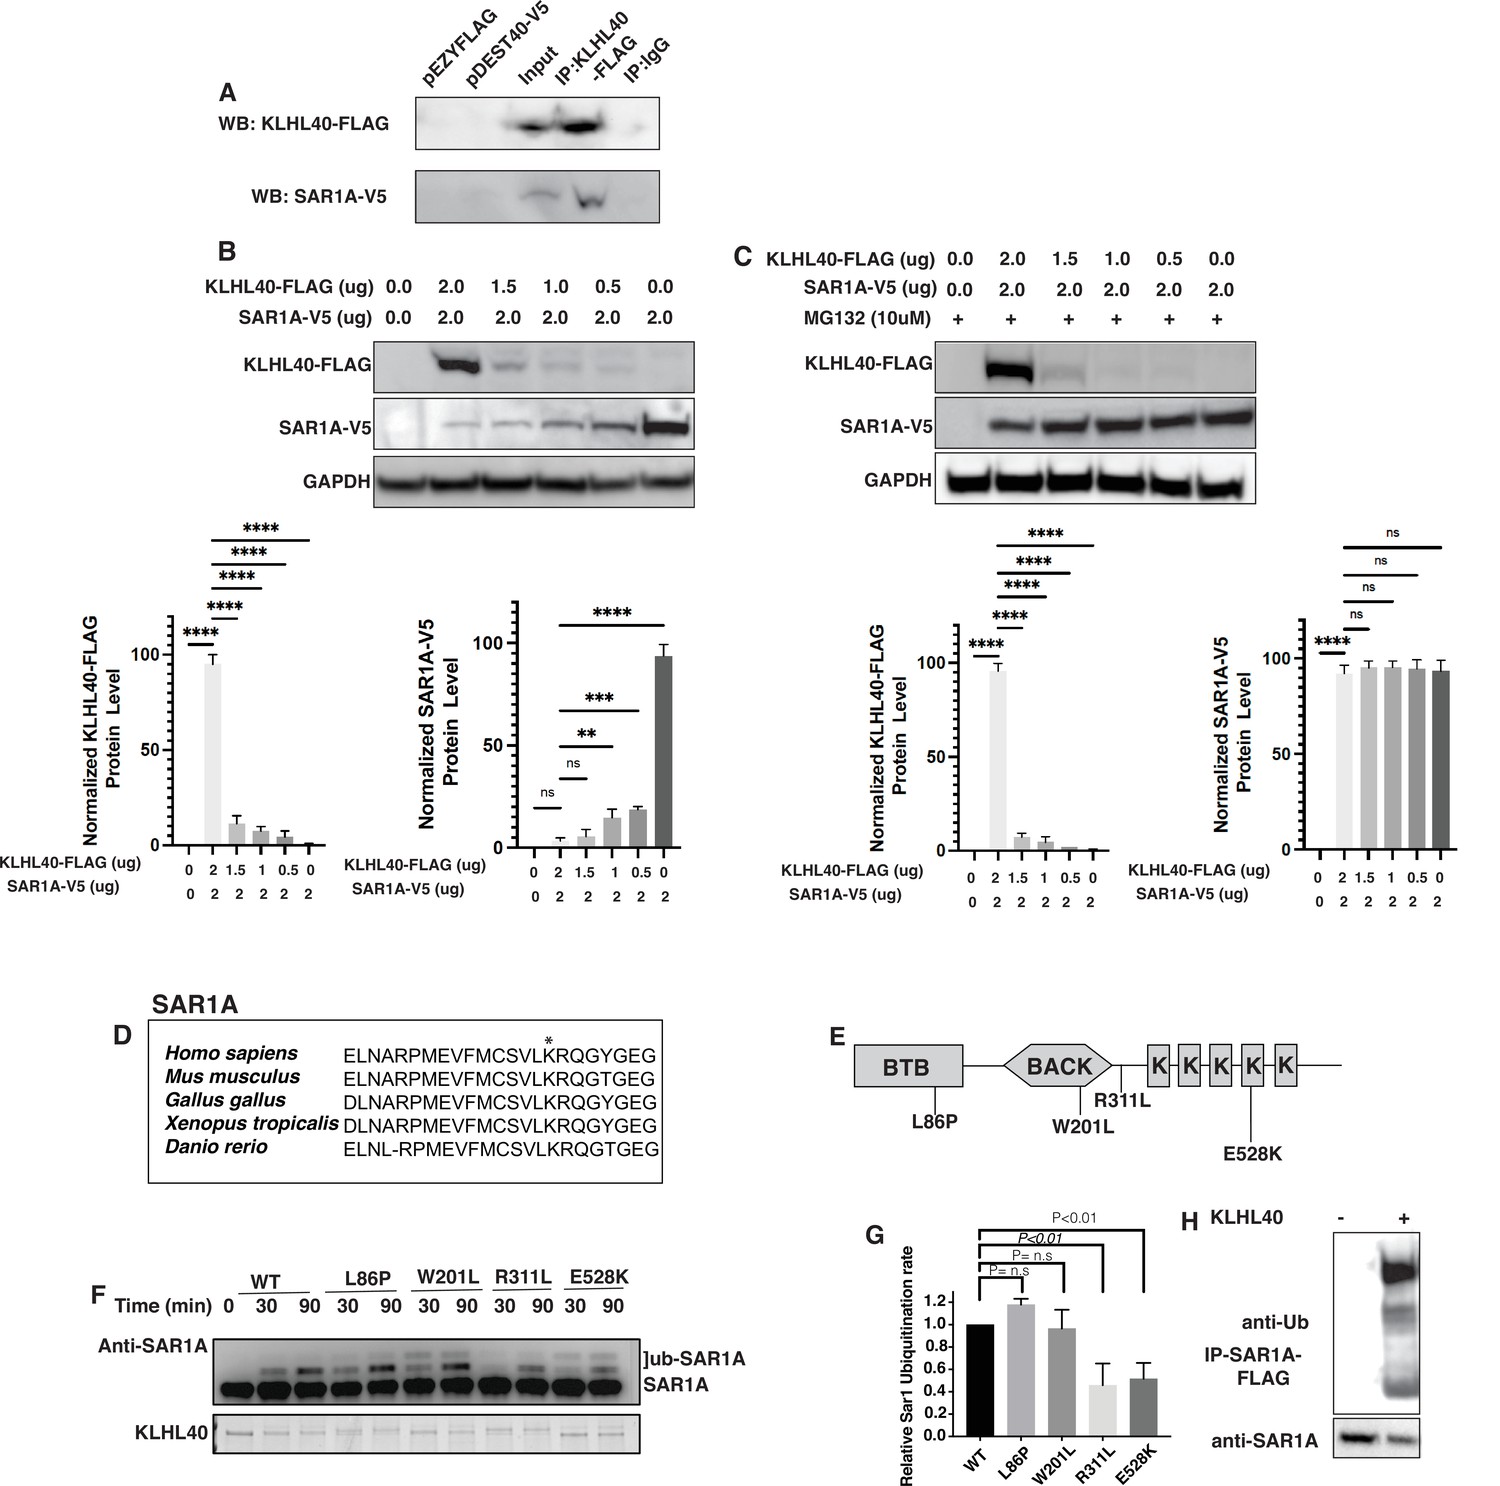
SAR1A is a direct ubiquitylation target of the KLHL40-CUL3 complex and is differently ubiquitylated by a disease-causing mutation in KLHL40.
(A) Coimmunoprecipitation in C2C12 cells showing KLHL40 directly interacts with SAR1A. (B) Co-overexpression of decreasing KLHL40-FLAG and constant SAR1A-V5 in C2C12 myoblasts demonstrates that KLHL40 is a regulator of Sar1A protein. (C) Co-overexpression of decreasing amounts of KLHL40-FLAG and constant amount of SAR1A-V5 in C2C12 myoblasts in the presence of UPS inhibitor MG132 increases the SAR1A protein levels in comparison to MG132- condition. (D) Alignment of the amino acid sequence of the SAR1A ubiquitylation site demonstrates high conservation in vertebrates (K182 in all species, marked by the asterisk). (E) Localization of different disease-causing variants in KLHL40 in the protein domains. (F) In vitro ubiquitylation of human SAR1A by CUL3 protein complex in the presence of wild-type and disease-causing KLHL40 proteins. (G) Quantifying the relative human SAR1A ubiquitylation by wild-type and disease-causing KLHL40-CUL3 complex. (H) Ubiquitylation of overexpressed SAR1A in the presence of KLHL40 in C2C12 myoblasts. Data are mean ± S.E.M; with one-way analysis of variance (ANOVA) with Dunnett’s multiple comparisons test and Brown-Forsythe test (****p<0.001; n.s. non significant) n=3.
-
Figure 7—source data 1
Full unedited 7A immunoblot with FLAG antibody.
- https://cdn.elifesciences.org/articles/81966/elife-81966-fig7-data1-v2.zip
-
Figure 7—source data 2
Full unedited 7A immunoblot with V5 antibody.
- https://cdn.elifesciences.org/articles/81966/elife-81966-fig7-data2-v2.zip
-
Figure 7—source data 3
Full unedited 7B immunoblot with FLAG antibody.
- https://cdn.elifesciences.org/articles/81966/elife-81966-fig7-data3-v2.zip
-
Figure 7—source data 4
Full unedited 7B immunoblot with V5 antibody.
- https://cdn.elifesciences.org/articles/81966/elife-81966-fig7-data4-v2.zip
-
Figure 7—source data 5
Full unedited 7B immunoblot with GAPDH antibody.
- https://cdn.elifesciences.org/articles/81966/elife-81966-fig7-data5-v2.zip
-
Figure 7—source data 6
Full unedited 7C immunoblot with FLAG antibody.
- https://cdn.elifesciences.org/articles/81966/elife-81966-fig7-data6-v2.zip
-
Figure 7—source data 7
Full unedited 7C immunoblot with V5 antibody.
- https://cdn.elifesciences.org/articles/81966/elife-81966-fig7-data7-v2.zip
-
Figure 7—source data 8
Full unedited 7C immunoblot with GAPDH antibody.
- https://cdn.elifesciences.org/articles/81966/elife-81966-fig7-data8-v2.zip
-
Figure 7—source data 9
Full unedited 7F immunoblot with SAR1A antibody.
- https://cdn.elifesciences.org/articles/81966/elife-81966-fig7-data9-v2.zip
-
Figure 7—source data 10
Full unedited 7F protein gel.
- https://cdn.elifesciences.org/articles/81966/elife-81966-fig7-data10-v2.zip
-
Figure 7—source data 11
Full unedited 7H immunoblot with FLAG antibody.
- https://cdn.elifesciences.org/articles/81966/elife-81966-fig7-data11-v2.zip
-
Figure 7—source data 12
Full unedited 7H immunoblot with SAR1A antibody.
- https://cdn.elifesciences.org/articles/81966/elife-81966-fig7-data12-v2.zip
-
Figure 7—source data 13
Annotated immunoblots and gel.
- https://cdn.elifesciences.org/articles/81966/elife-81966-fig7-data13-v2.pdf
Figure 7—figure supplement 1
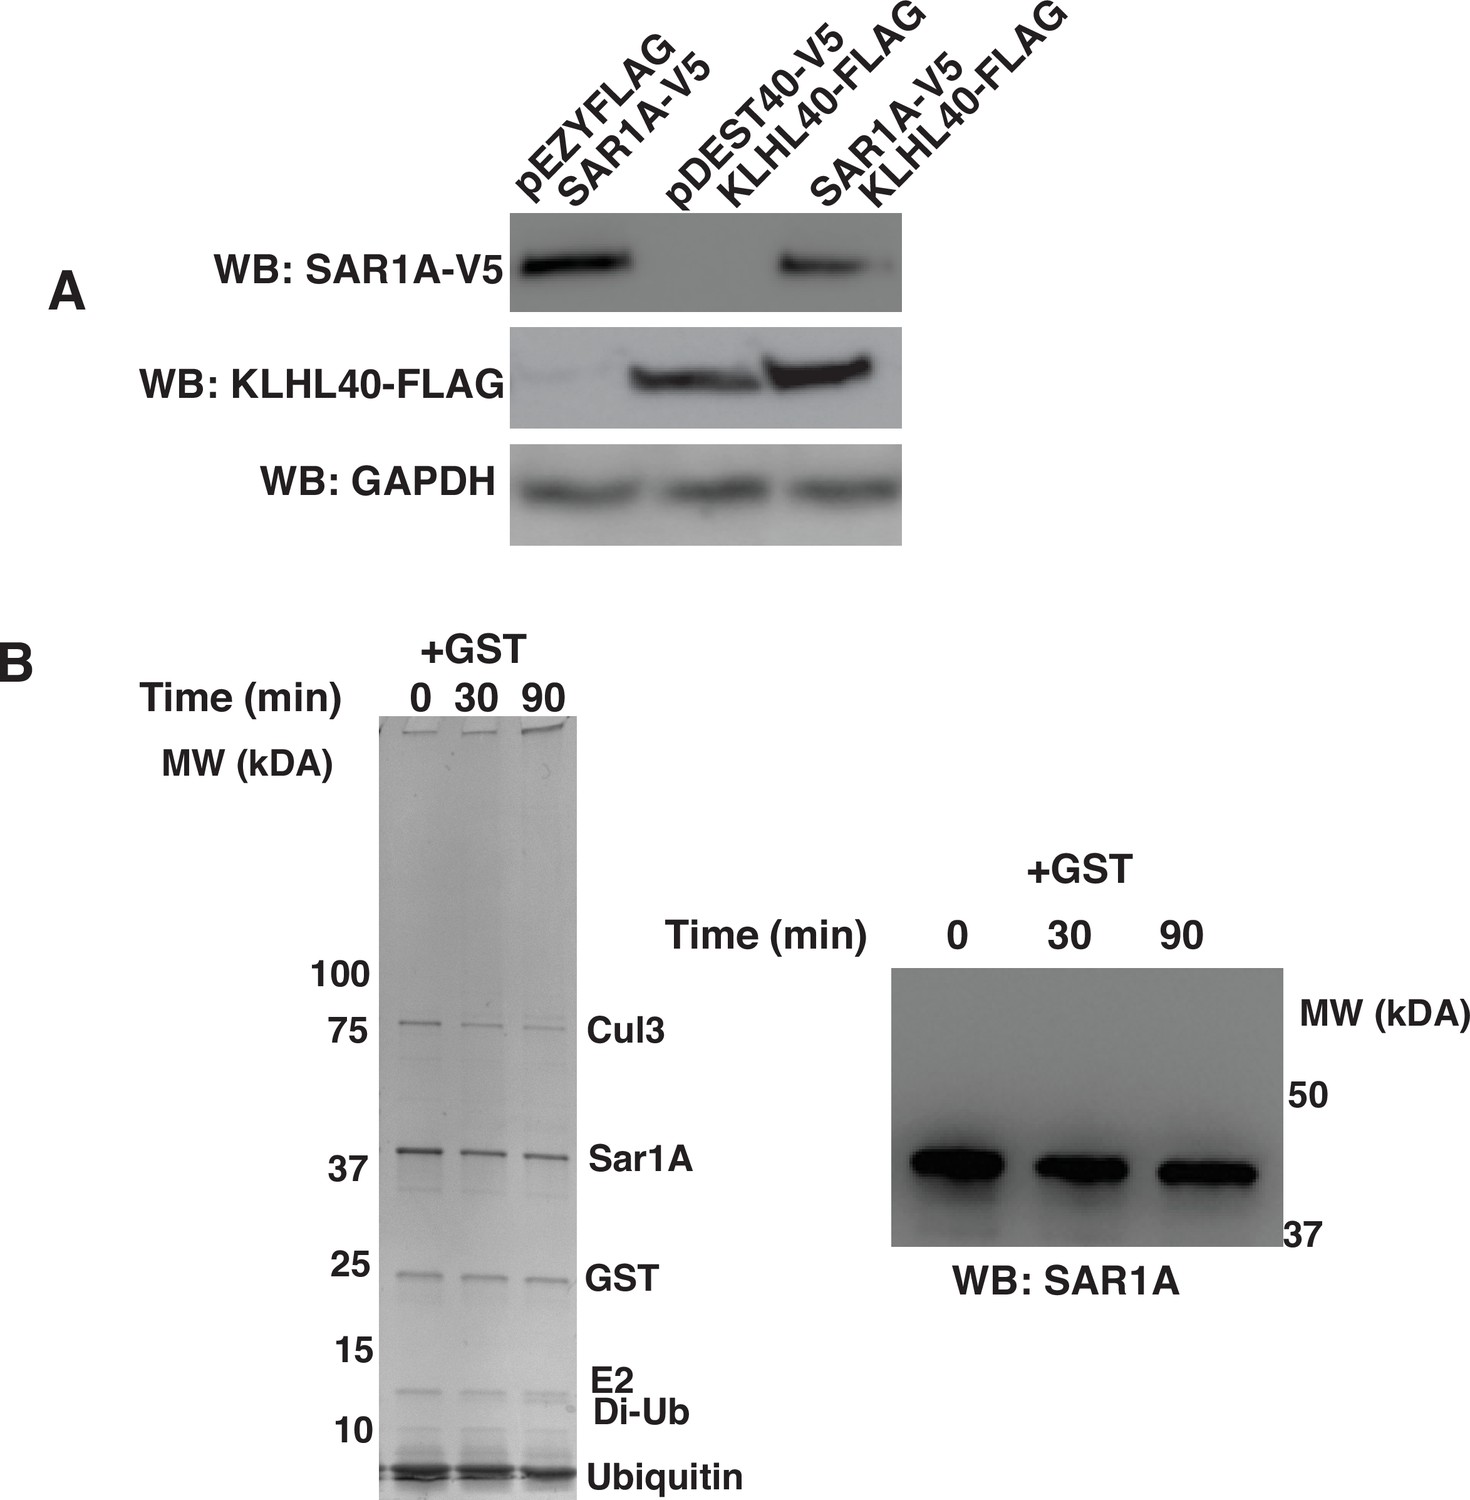
Specificity of SAR1A ubiquitylation and protein stability by KLHL40.
(A) Promoter competition analysis of KLHL40-FLAG and SAR1AV5 in C2C12 cells. (B) SAR1A is not ubiquitinylated in the presence of GST only (Left: Coomassie blue staining of SDS-PAGE of SAR1A ubiquitylation reaction; Right: Western blot of SAR1A ubiquitylation reaction in the presence of GST protein).
-
Figure 7—figure supplement 1—source data 1
Raw immunoblots.
- https://cdn.elifesciences.org/articles/81966/elife-81966-fig7-figsupp1-data1-v2.zip
-
Figure 7—figure supplement 1—source data 2
Raw immunoblots.
- https://cdn.elifesciences.org/articles/81966/elife-81966-fig7-figsupp1-data2-v2.zip
-
Figure 7—figure supplement 1—source data 3
Raw immunoblots.
- https://cdn.elifesciences.org/articles/81966/elife-81966-fig7-figsupp1-data3-v2.zip
-
Figure 7—figure supplement 1—source data 4
Raw immunoblots.
- https://cdn.elifesciences.org/articles/81966/elife-81966-fig7-figsupp1-data4-v2.zip
-
Figure 7—figure supplement 1—source data 5
Raw immunoblots.
- https://cdn.elifesciences.org/articles/81966/elife-81966-fig7-figsupp1-data5-v2.zip
-
Figure 7—figure supplement 1—source data 6
Annotated gels.
- https://cdn.elifesciences.org/articles/81966/elife-81966-fig7-figsupp1-data6-v2.pdf
Figure 8
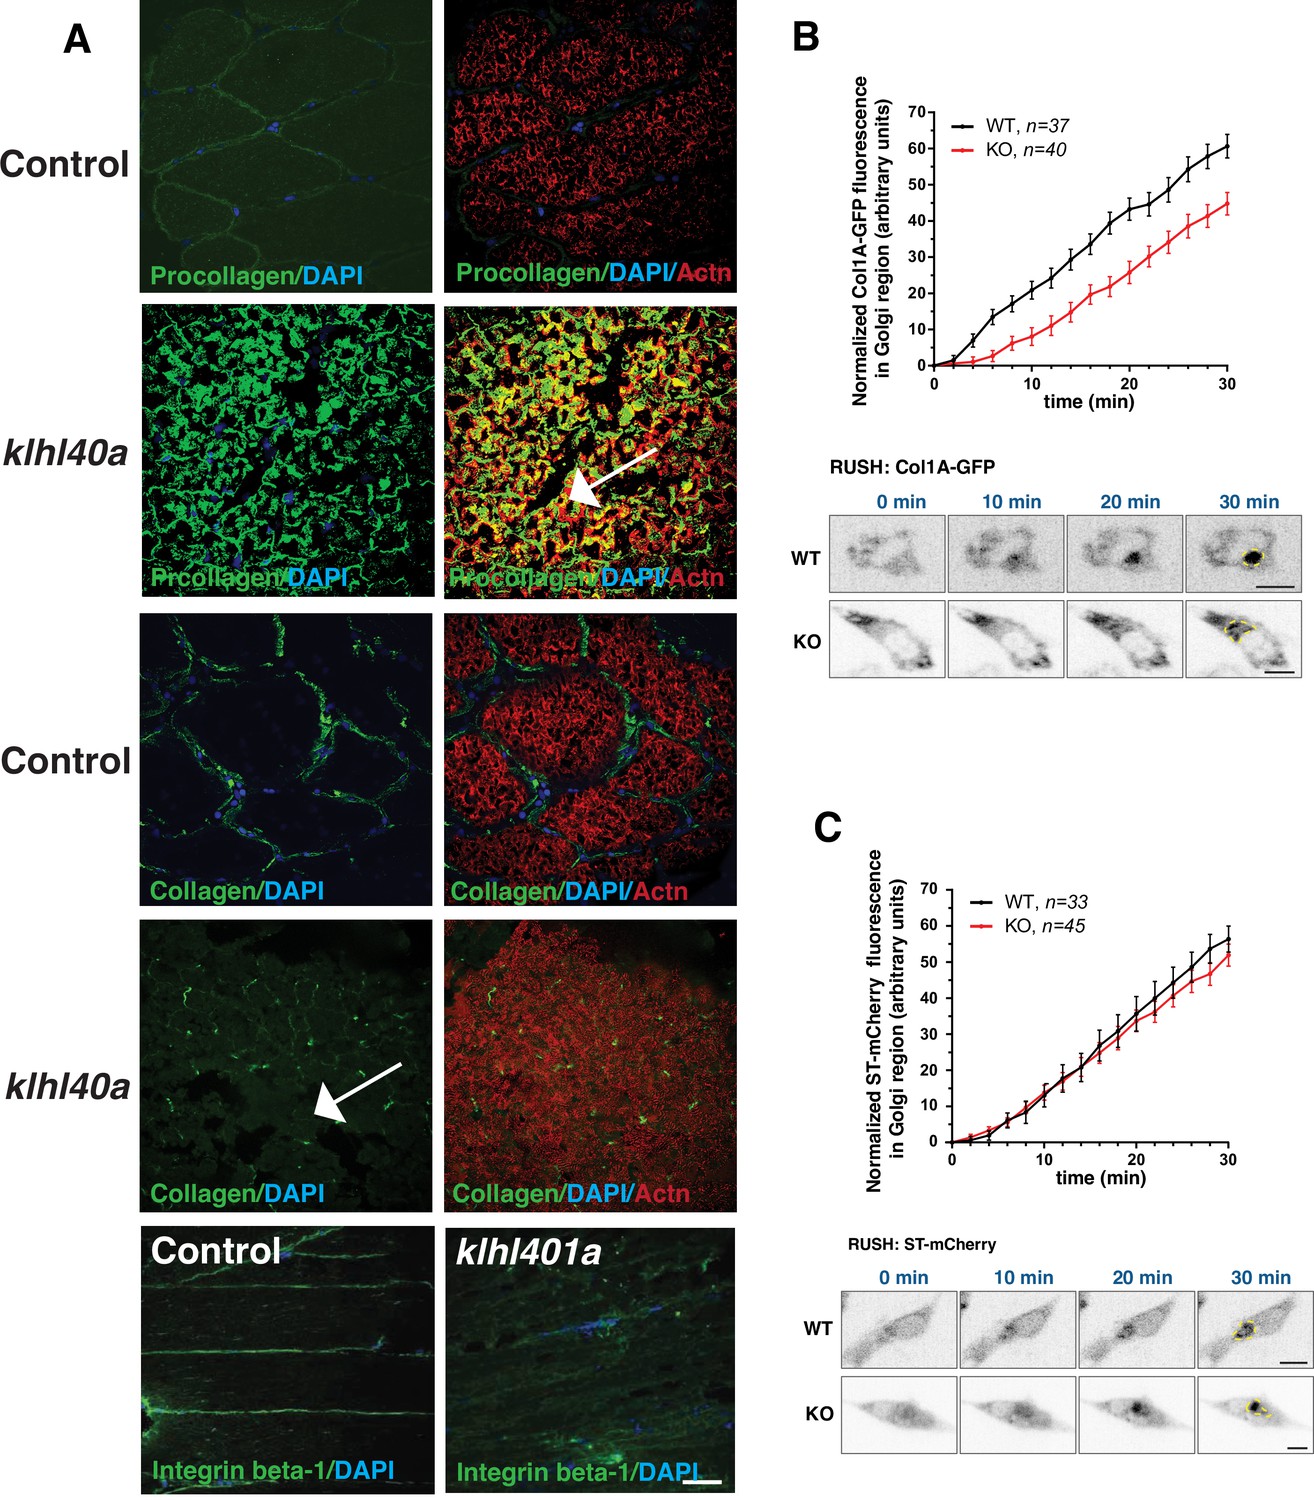
Abnormal ER-Golgi trafficking of procollagen contributes to reduced collagen in the extracellular matrix in Klhl40a deficiency.
(A) Immunofluorescence of control and klhl40a KO zebrafish muscle (3 months). Mutant muscle displays the intracellular accumulation of procollagen (as seen with co-labeling with sarcomeric α-actinin; white arrow) in klhl40a KO muscle compared to +/+control. Mutant muscle showed reduced levels of collagen compared to controls (white arrow). Integrinβ1 level is also reduced in the ECM in the mutant muscle. (B) Retention using selective hooks (RUSH) assay for ER-Golgi trafficking of procollagens and (C) sialyltransferase (ST) in control and KLHL40 knockout human myoblasts. The Golgi apparatus is marked with a yellow dashed line. N=33–45 cells in each group; data are mean ± S.E.M; and Tukey’s HSD test (p<0.01).
Figure 9 with 1 supplement
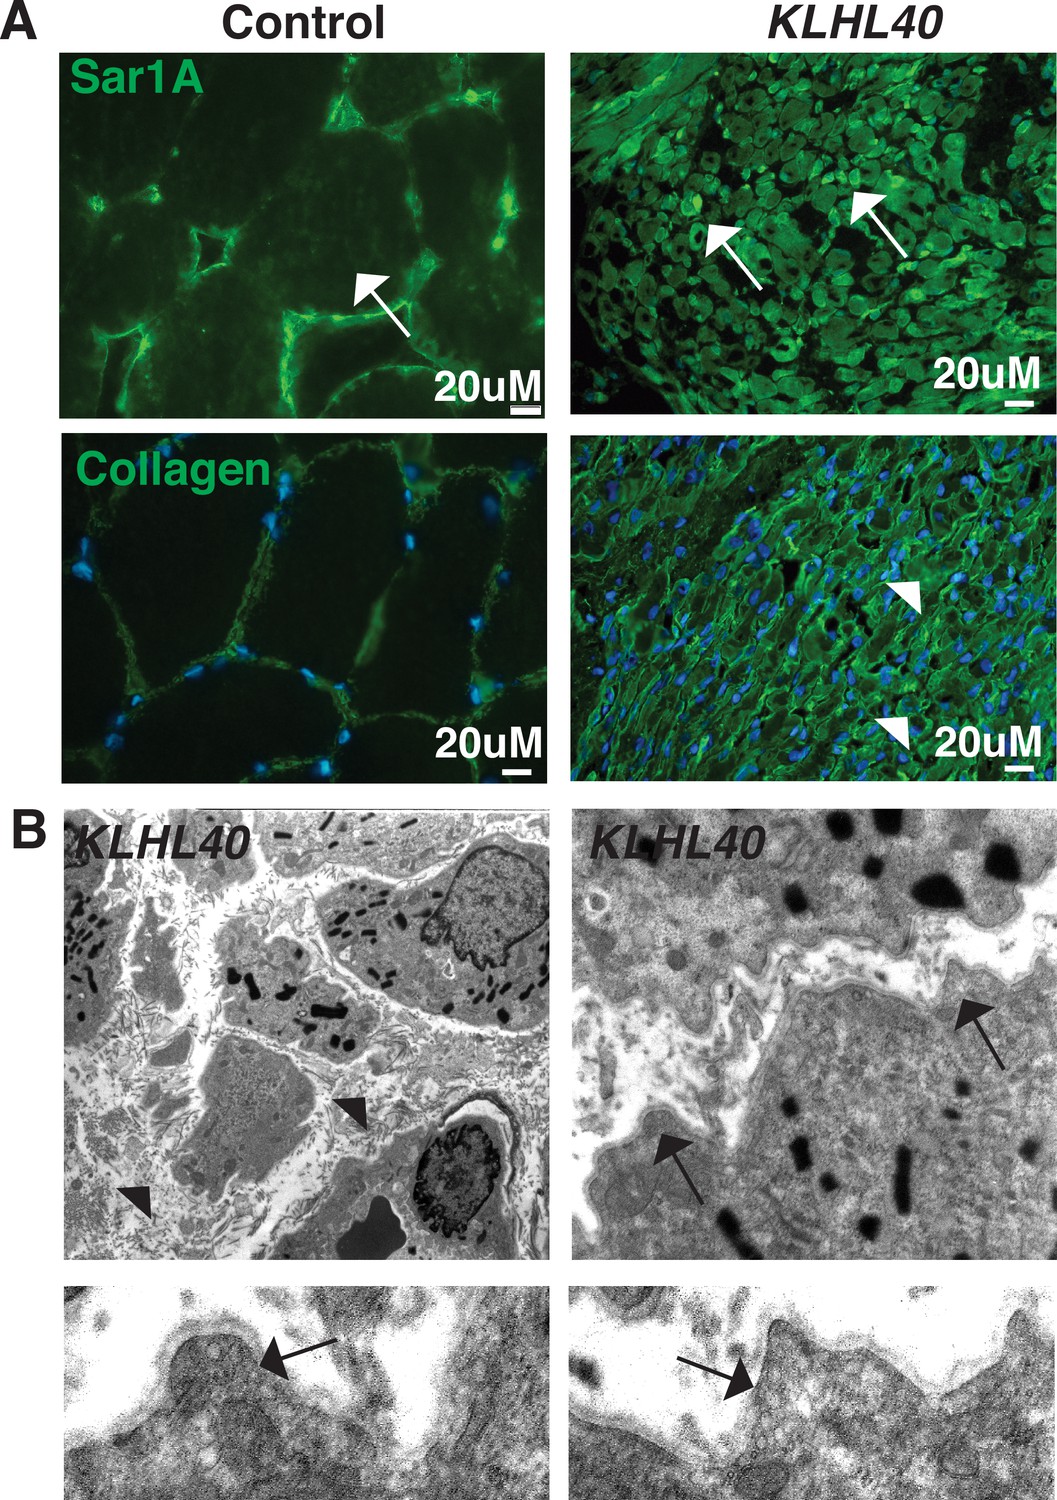
KLHL40-NM patients exhibit increased SAR1A protein and vesicle accumulation with ECM defects in skeletal muscle.
(A) Immunofluorescence in control and a KLHL40 patient muscle biopsy showing increased SAR1A protein in the patient muscle (white arrows). Moreover, collagen accumulation is seen in the patient muscle (white arrowhead). (B) Transmission electron microscopy of KLHL40 patient muscle showed vesicle accumulation (arrows) and disorganized and damaged extracellular matrix between myofibers (arrows).
Figure 9—figure supplement 1

Sar1A protein level is not affected in centronuclear myopathy.
(A–B) Quantification of SAR1A protein levels in centronuclear myopathy patients and control (Control-H). Wild-type (Control-Z) and klhl40a zebrafish skeletal muscle extracts were used as controls. N=3 technical replicates; data are mean ± S.E.M; and Tukey’s HSD test (****p<0.001, ns; nonsignificant).
-
Figure 9—figure supplement 1—source data 1
Raw immunoblots.
- https://cdn.elifesciences.org/articles/81966/elife-81966-fig9-figsupp1-data1-v2.zip
-
Figure 9—figure supplement 1—source data 2
Raw immunoblots.
- https://cdn.elifesciences.org/articles/81966/elife-81966-fig9-figsupp1-data2-v2.zip
-
Figure 9—figure supplement 1—source data 3
Annotated gels.
- https://cdn.elifesciences.org/articles/81966/elife-81966-fig9-figsupp1-data3-v2.zip
Additional files
-
Supplementary file 1
Differential Proteome expression during disease onset and progression in normal and klhl40abwg200 KO at 1.5 months and 3 months.
- https://cdn.elifesciences.org/articles/81966/elife-81966-supp1-v2.xlsx
-
Supplementary file 2
Differential Proteome and ubiquitylome changes during disease onset and progression in normal and klhl40abwg200 KO at 1.5 months and 3 months.
- https://cdn.elifesciences.org/articles/81966/elife-81966-supp2-v2.xlsx
-
Supplementary file 3
Differential transcriptome expression in normal and klhl40abwg200 at 3 months.
- https://cdn.elifesciences.org/articles/81966/elife-81966-supp3-v2.xlsx
-
Supplementary file 4
Cluster of enriched pathways by proteome and ubiquitylome analysis at 1.5 months and 3 months.
- https://cdn.elifesciences.org/articles/81966/elife-81966-supp4-v2.xlsx
-
Supplementary file 5
Gene and KGG-site clusters changed during transition from 1.5 months to 3 months identified by hierarchal clustering.
- https://cdn.elifesciences.org/articles/81966/elife-81966-supp5-v2.xlsx
-
Supplementary file 6
Significant changes in proteome in opposite direction at 1.5 months and 3 months.
- https://cdn.elifesciences.org/articles/81966/elife-81966-supp6-v2.xlsx
-
Supplementary file 7
Significant changes in proteome in the same direction at 1.5 months and 3 months.
- https://cdn.elifesciences.org/articles/81966/elife-81966-supp7-v2.xlsx
-
Supplementary file 8
Proteome and ubiquitylome correlation in the same direction at 1.5 months.
- https://cdn.elifesciences.org/articles/81966/elife-81966-supp8-v2.xlsx
-
Supplementary file 9
Proteome and ubiquitylome correlation in different direction at 1.5 months.
- https://cdn.elifesciences.org/articles/81966/elife-81966-supp9-v2.xlsx
-
Supplementary file 10
Sequences of the sgRNA target sites and primers sequences (5’–3’) to clone sgRNAs for creating klhl40 zebrafish lines.
- https://cdn.elifesciences.org/articles/81966/elife-81966-supp10-v2.docx
-
MDAR checklist
- https://cdn.elifesciences.org/articles/81966/elife-81966-mdarchecklist1-v2.pdf
Download links
A two-part list of links to download the article, or parts of the article, in various formats.
Downloads (link to download the article as PDF)
Open citations (links to open the citations from this article in various online reference manager services)
Cite this article (links to download the citations from this article in formats compatible with various reference manager tools)
Dynamic regulation of inter-organelle communication by ubiquitylation controls skeletal muscle development and disease onset
eLife 12:e81966.
https://doi.org/10.7554/eLife.81966


