Imprinted Dlk1 dosage as a size determinant of the mammalian pituitary gland
- Department of Medical and Molecular Genetics, Faculty of Life Sciences and Medicine, King’s College London, United Kingdom
- Centre for Craniofacial and Regenerative Biology, Faculty of Dentistry, Oral and Craniofacial Sciences, King's College London, United Kingdom
- MRC Centre for Transplantation, Peter Gorer Department of Immunobiology, School of Immunology & Microbial Sciences, King’s College London, United Kingdom
- Centre for Endocrinology, William Harvey Research Institute, Barts and the London School of Medicine and Dentistry, Queen Mary University of London, United Kingdom
Figures
Figure 1
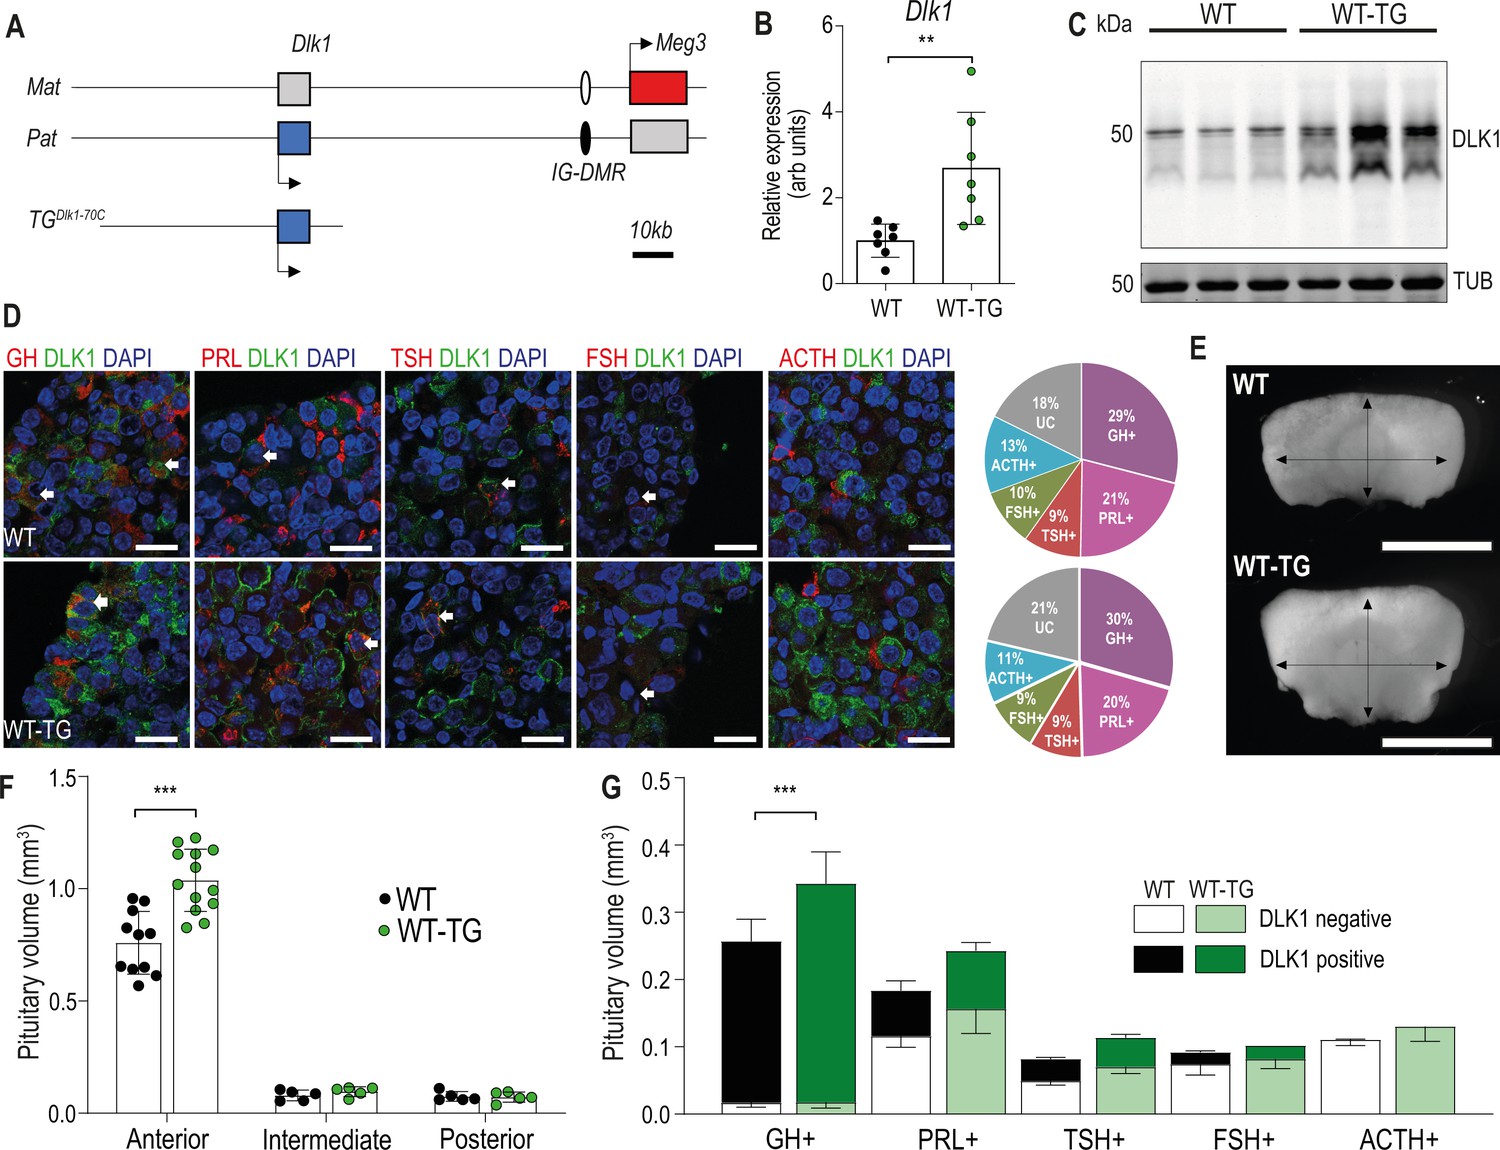
Increasing the expression dosage of Dlk1 causes pituitary hyperplasia.
(A) Schematic of part of the imprinted region on mouse chromosome 12 that contains the Dlk1 and Meg3 genes. Dlk1 is expressed (blue box) from the paternally-inherited chromosome, Meg3 from the maternally-inherited chromosome (red box). This expression pattern is established and maintained by an intergenic differentially methylated region (IG-DMR) which is paternally methylated (black oval) and maternally unmethylated (white oval). The TGDlk1-70C transgene used in this study contains the whole Dlk1 gene within ~70 kb of surrounding DNA, but does not contain the IG-DMR and is not imprinted. (B) RT-qPCR for Dlk1 in whole pituitary from 12-week-old female hemizygous TGDlk1-70C transgenic (WT-TG) mice and wild-type (WT) littermates. Dlk1 expression is 2.7 x higher in transgenic animals, **p<0.01 compared by Mann-Whitney U test, n=7 per genotype. Bar shows mean +/-SD. (C) Western blots of extracts from whole pituitary of 12-week female WT and WT-TG mice. Alpha tubulin (TUB) is used as a loading control. Full-length and membrane bound isoforms at 50–60 kDa. (D) Fluorescence immunohistochemistry for DLK1 and pituitary hormones at 12 week. DLK1 in the adult AP is detected in all hormone-producing cells except corticotrophs; GH = somatotrophs, PRL = lactotrophs, TSH = thyrotrophs, FSH = gonadotrophs; ACTH = corticotrophs. Scale bar = 20 µm. Note some membrane localisation of DLK1. White arrows indicate co-expression. Proportion of hormone-labelled cells was quantified between mice of each genotype and shown as a pie chart on the right, UC = unclassified cell type. (E) Whole pituitary glands from adult WT-TG mice appear larger than those from WT littermates. Light field image of 12-week female glands, scale bar = 1 mm. (F) Anterior pituitary volume, but not intermediate lobe or posterior pituitary volume is increased in WT-TG animals compared to WT littermates. Twelve-week-old females, n=12/13 animals per genotype, compared by two-way ANOVA with Sidak’s post-hoc multiple comparison test, *** p<0.001. (G) Overall cell proportion was not changed but absolute volume of hormone-producing cells was altered by Dlk1 dosage (data shown in Supplementary file 1a). Groups are compared by two-way ANOVA and differ significantly according to genotype (p=0.0009); genotypes are compared for each cell type Sidak’s multiple comparison test – WT and WT-TG animals have a significantly different proportion of GH-producing cells (*** p<0.001). (F) and (G) bars show mean values +/-SD.
-
Figure 1—source data 1
Zipped Excel file containing raw data used to generate graphs in Figure 1.
Figure 1B. RT-qPCR data for Dlk1 expression from whole pituitary gland at 12 weeks, females. Normalised to mean WT = 1, with B-actin as housekeeping gene. Figure 1D&G. Raw and proportional volumes of adult pituitary cell types in WT and WT-TG. Figure 1. Pituitary volumes in WT and WT-TG adult pituitary glands.
- https://cdn.elifesciences.org/articles/84092/elife-84092-fig1-data1-v2.zip
-
Figure 1—source data 2
Zipped file containing source data for Figure 1C – gels with cropped bands highlighted and original gel images.
- https://cdn.elifesciences.org/articles/84092/elife-84092-fig1-data2-v2.zip
Figure 2
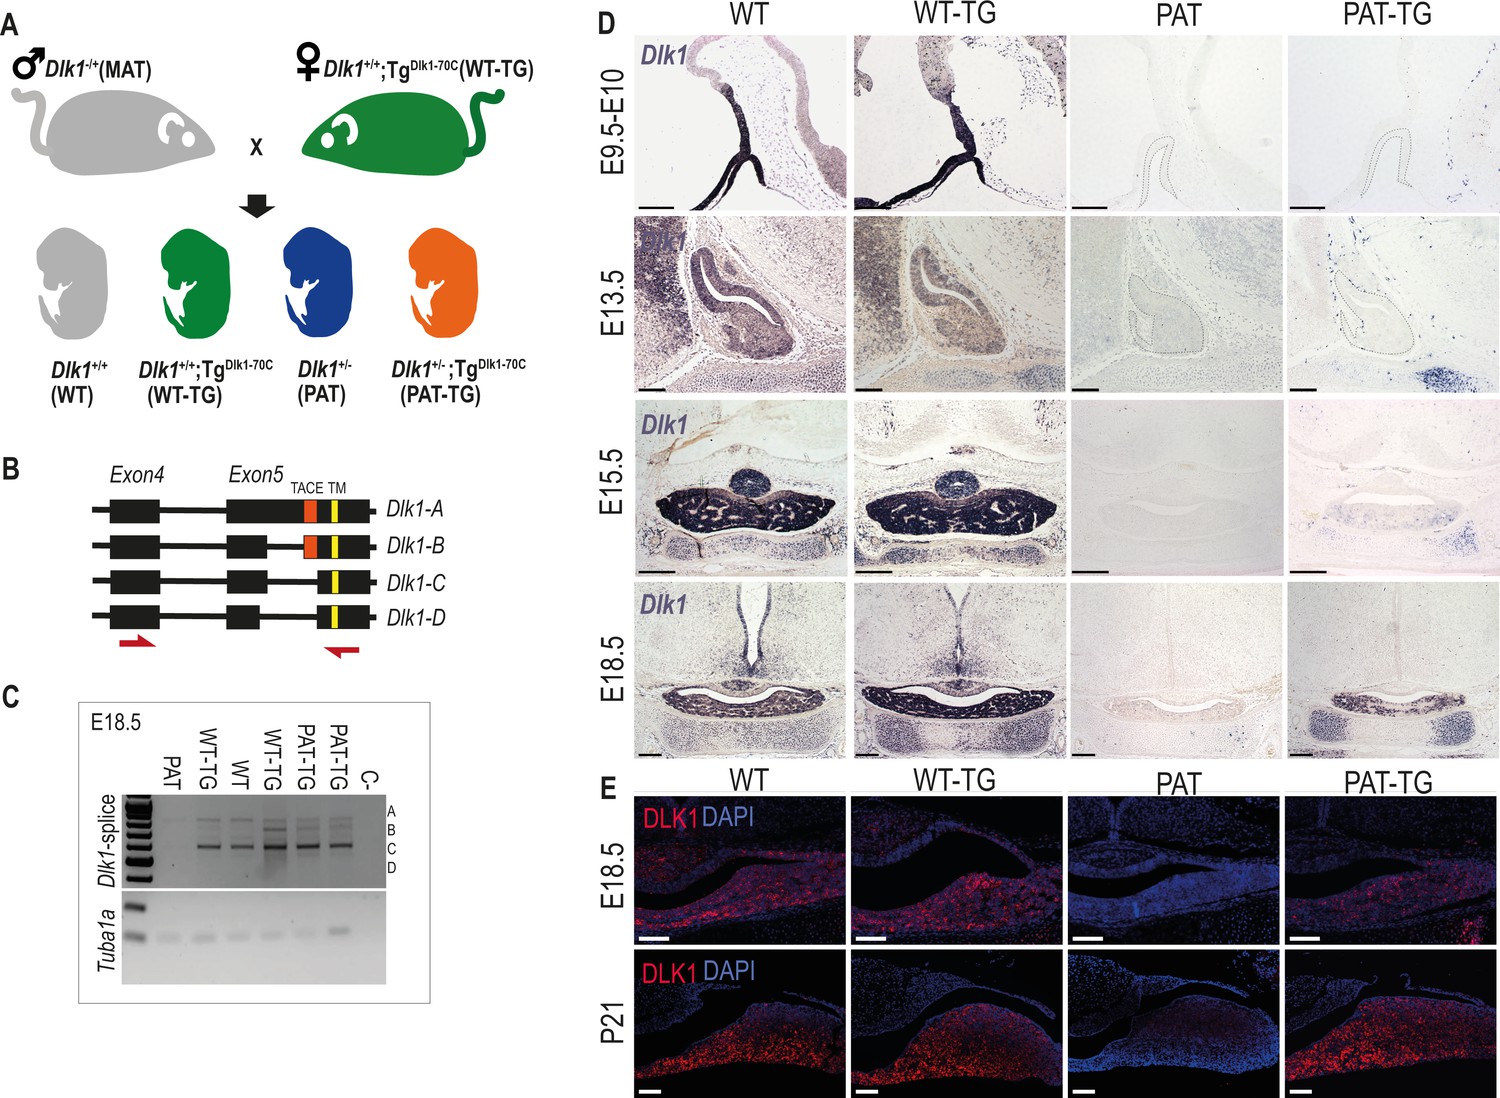
Dlk1 imprinting and expression in the developing pituitary gland from the endogenous locus and TGDlk1-70C transgene.
(A) Cross used to generate embryos and postnatal animals in the study. Males inheriting the deleted allele from the mother (maternal Dlk1tm1Srbpa/+ heterozygotes or MATs) were crossed to females hemizygous for the TGDlk1-70C transgene (WT-TG), generating 4 genotypes, WT, WT-TG, paternal Dlk1 +/tm1Srbpa heterozygotes (PATs) and mice inheriting a deleted paternal allele and the transgene (PAT-TG). (B) Schematic showing the known splice variants of Dlk1, A-D. Splicing occurs internally in exon 5 of the Dlk1 gene. Dlk1-A and B retain an extracellular cleavage domain (TACE), in Dlk1-C and D this region is spliced out. All versions contain a single pass transmembrane domain (TM). Red arrows indicate location of primers used in (C). (C) Semi-quantitative PCR on embryonic day (E) 18.5 whole pituitary glands from the 4 genotypes shown in (A). Top – primers amplify the exon 4–5 region of Dlk1 and can distinguish splice variants based on size. Bottom – alpha-tubulin (Tuba1a) was amplified as a loading control on each sample. (D) In-situ hybridisation for Dlk1 in the developing pituitary gland from E9.5 to E18.5 in the 4 genotypes shown in (A). Dlk1 expression is indicated by purple staining. Scale bars show 100 µm (E9.5 and E13.5, sagittal sections) and 200 µm (E15.5 and E18.5, frontal sections). (E) Immunohistochemistry (IHC) for DLK1 on frontal sections at E18.5 and postnatal day 21 (P21), counterstained with DAPI. Scale bars = 50 µm.
-
Figure 2—source data 1
Zipped file containing the source data for Figure 2D -gels with cropped areas highlighted and original gel images.
- https://cdn.elifesciences.org/articles/84092/elife-84092-fig2-data1-v2.zip
Figure 3 with 1 supplement
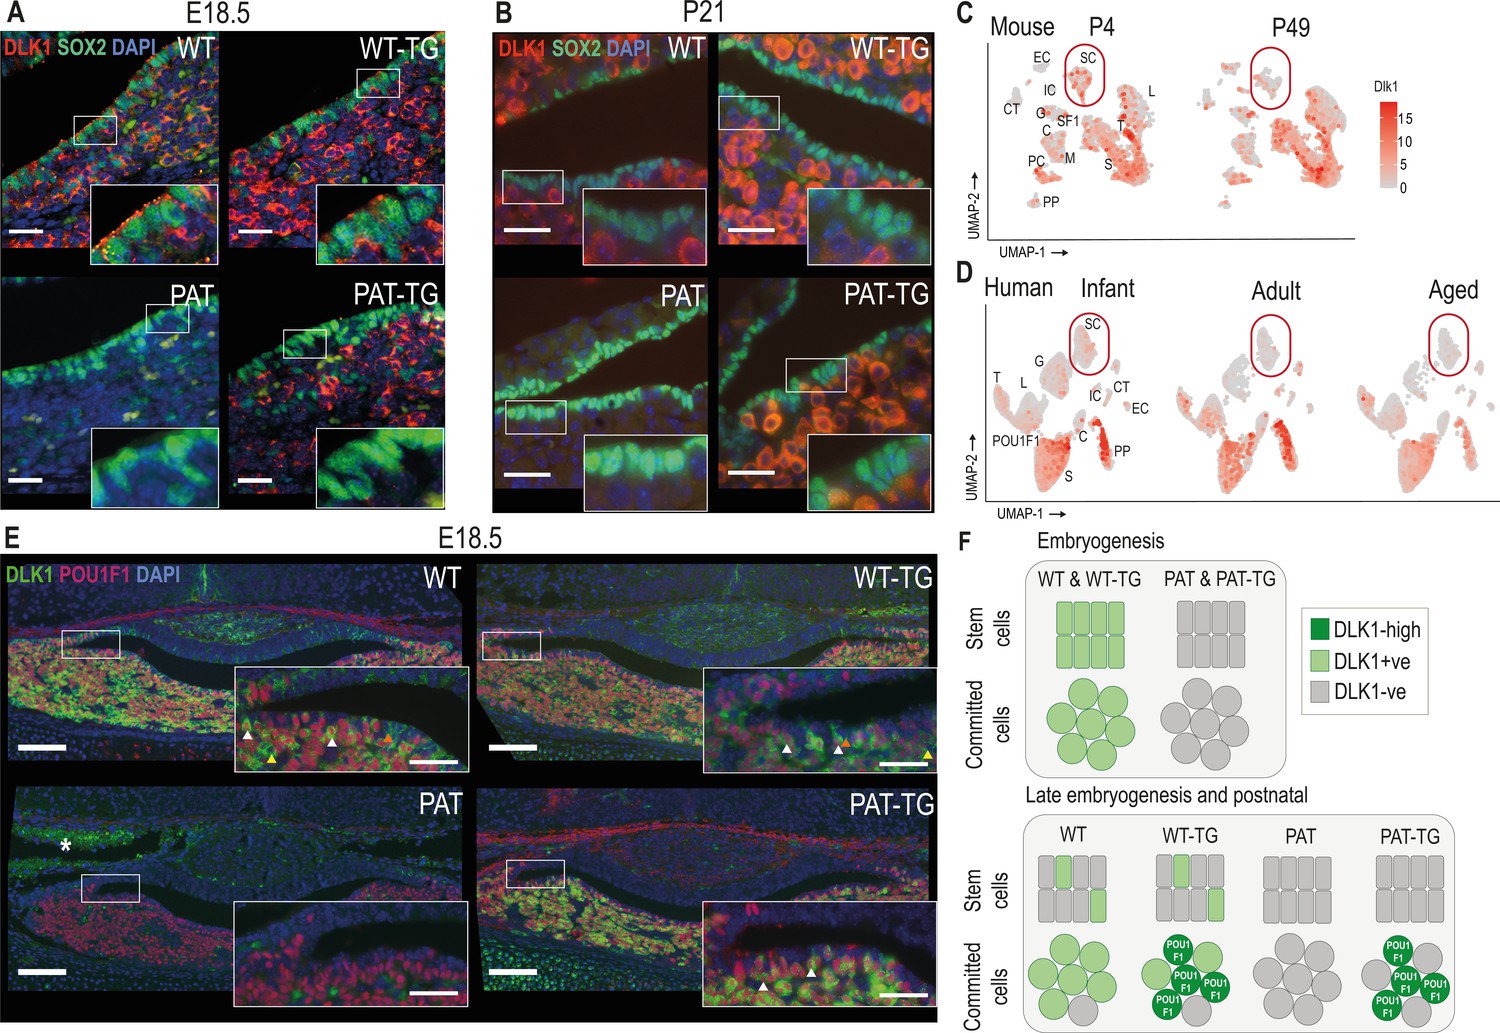
DLK1 expression in the pituitary gland is dynamically regulated in two distinct compartments, only one of which is recapitulated by the TGDlk1-70C transgene.
(A) IF of DLK1 and SOX2 in the E18.5 pituitary. SOX2 expression is high in the epithelial cells lining the pituitary lumen, as expected. In WT and WT-TG mice there is co-expression of DLK1 and SOX2 (inset), as well as high levels of DLK1 expression in the SOX2-negative parenchyma. In the PAT-TG pituitary DLK1 expression is not detected in the SOX2-positive compartment. Scale bars = 25 µm. (B) IF of DLK1 and SOX2 in the P21 pituitary. The majority of DLK1 expression is outside the SOX2-positive compartment of all genotypes. Scale bars = 25 µm. (C) UMAP plot illustrating expression of Dlk1 in sc-RNAseq at P4 (Cheung and Camper, 2020) and P49 mice (Cheung et al., 2018) in the postnatal mouse pituitary, indicating high expression in the POU1F1 lineage (S somatotrophs, T thyrotrophes, L lactotrophs), with additional expression in a subset of Sox2-positive stem cells (SC), outlined by red box. EC endothelial cells, IC immune cells, CT connective tissue, G gonadotrophs, SF1 steroidal factor 1 progenitors, C corticotrophs, M melanotrophs, PC proliferating cells, PP posterior pituitary. (D) UMAP plot illustrating expression of DLK1 in sn-RNAseq from infant, adult and aged human pituitary gland (Zhang et al., 2022), indicating high expression in the POU1F1 lineage (S somatotrophs, T thyrotrophs, L lactotrophs), with additional expression in a subset of SOX2-positive stem cells (SC). Additional cell labels as in (C). (E) IF of DLK1 and POU1F in the E18.5 pituitary. DLK1 and POU1F1 are highly co-expressed in all Dlk1-expressing genotypes (white arrows). In WT and WT-TG there is additional DLK1 expression in marginal zone cells (orange arrow) and parenchymal cells (yellow arrow) that are POU1F1-negative. This expression is absent from the PAT-TG. Scale bar = 100 µm, inset 25 µm. * indicates background autofluorescence from blood cells. (F) Summary of Dlk1 expression across embryonic and early postnatal development in the mouse, with contribution from the transgene.
Figure 3—figure supplement 1

Dlk1 may be a direct transcriptional POU1F1 target.
Schematic showing relative genomic positions of sequences in the TGDlk1-70C transgene and experimentally-verified binding sites for POU1F1. Three predicted POU1F1 binding sites are within 120 kb of the Dlk1 promoter, each within highly conserved regions of the genome and overlapping genomic sites enriched for enhancer-specific histone marks in embryonic forebrain. Only one POU1F1 binding site is predicted to be present in the transgene, mapping ~10 kb upstream of the Dlk1 promoter.
Figure 4 with 1 supplement
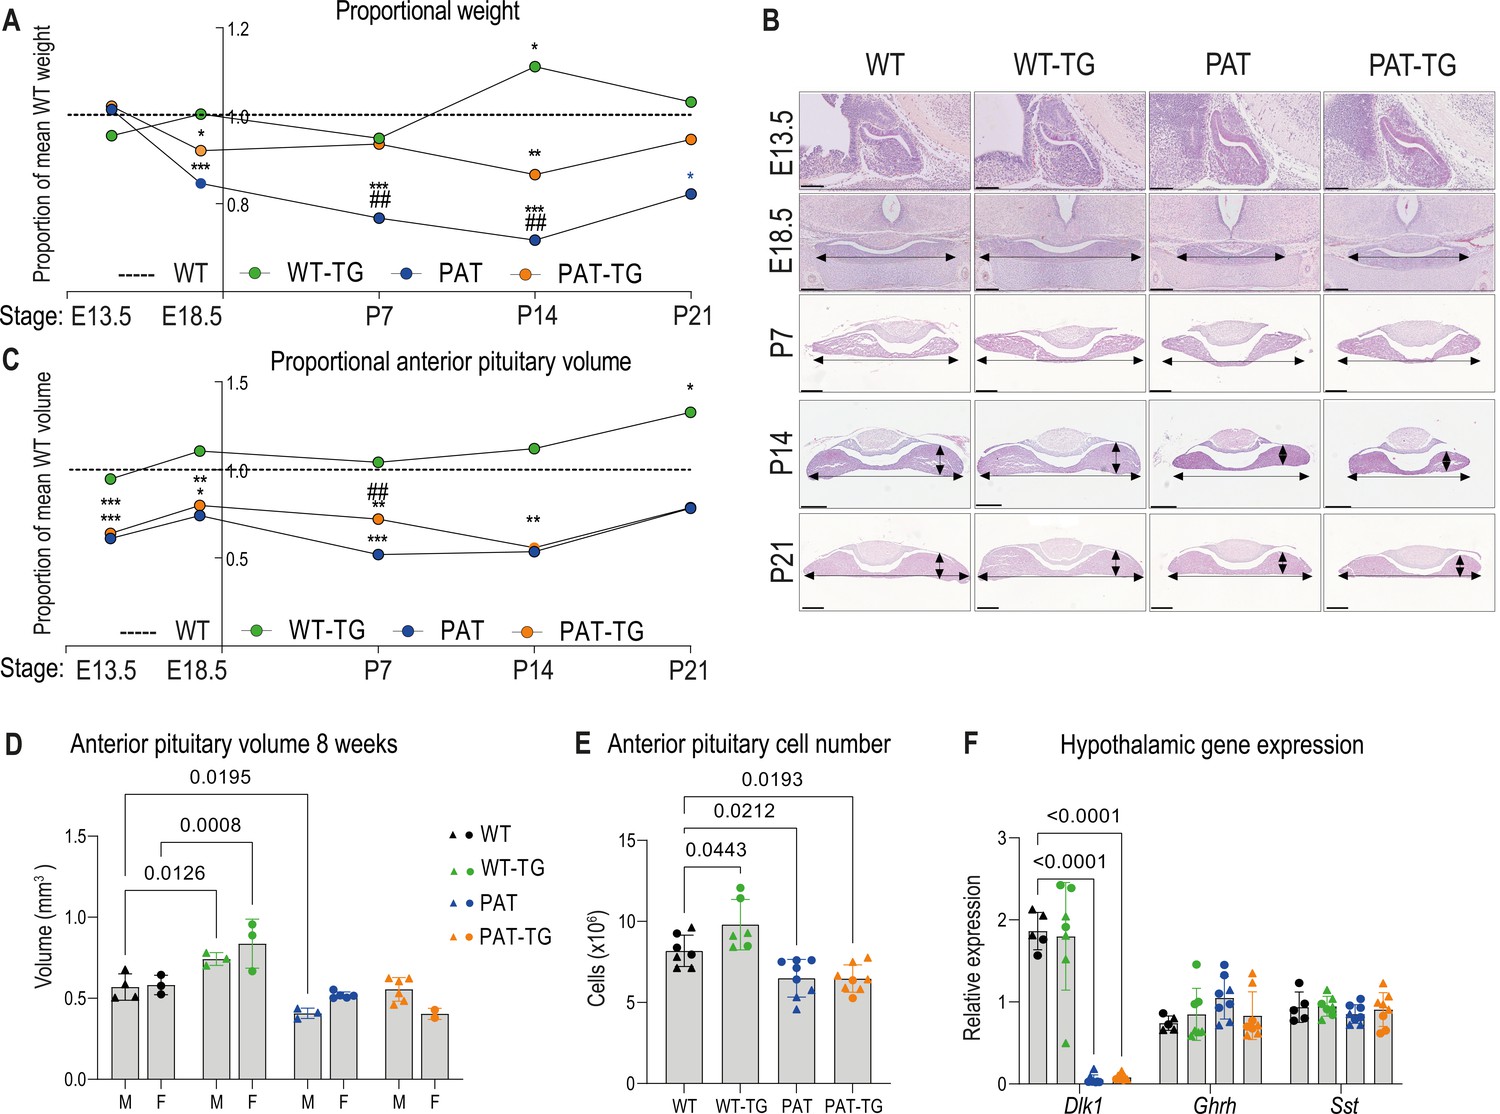
DLK1 dosage during embryogenesis and early life modulates anterior pituitary volume independent of whole animal mass.
(A) Time-course of proportional body weight by genotype from E13.5 to P21, derived from data in Supplementary file 1b, sexes are combined since body weight is not sexually dimorphic at these stages. Lines and points show mean proportional weight of embryo/pup for WT-TG, PAT and PAT-TG animals compared to WT littermates (dotted line at 1.0). The unmodified weight data was compared using a One-Way ANOVA with Bonferroni’s posthoc test comparing each genotype with WT (*p<0.05, ***p<0.001), and PAT with PAT-TG (## p<0.01). (B) Haemotoxylin and eosin-stained pituitary glands at E13.5 (sagittal view), E18.5, P7, and P21 (frontal view) across the four genotypes. Scale bars show 100 µm (E13.5), 200 µm (E18.5), (P7) and 300 µm (P14, P21). (C) Time-course of proportional pituitary volume by genotype from E13.5 to P21, derived from data in Supplementary file 1c and d. Lines and points show mean volume of the anterior pituitary gland for WT-TG, PAT, and PAT-TG animals as a proportion of WT littermates (dotted line at 1.0). Genotypes were compared in unmodified volume data using a one-way ANOVA with Bonferroni’s posthoc test comparing each genotype with WT (*p<0.05, **p<0.01, ***p<0.001), and PAT with PAT-TG (## p<0.01). (D) Anterior pituitary volumes of male triangles, (M) and female circles, (F) mice at postnatal week 8. Volumes were compared by sex and genotype with a two-way ANOVA and within genotypes using a Dunnett’s multiple comparison test. Volumes were significantly different by genotype (p<0.0001), and p values of significant post-hoc comparisons are shown on the graph, n = 2-6/sex/genotype. (E) Estimated total cell numbers of APs from (D). Sexes were combined and genotypes compared using One-Way ANOVA (p<0.0001 overall). Each genotype (n = 6-8 per genotype)was compared to WT using Dunnett’s multiple comparison test and p values shown on the graph. (D, E) Source data shown in Supplementary file 1e. (F) RT-qPCR quantitation of gene expression in the hypothalamus at 8 weeks in samples from D, normalised to actin. For each gene, expression levels were compared between genotypes as in (E), post-hoc p values are shown on the graph. (D–F) Bars show the mean of the data +/-SD.
-
Figure 4—source data 1
Zipped file containing raw data used to generate graphs in Figure 4.
Figure 4A_TableS2_raw weights. Weight data from all animals in the developmental study. Figure 4A_proportions. Body weight as a proportion of time-matched WT weight. Figure 4C_pituitary_volumes. Raw pituitary volumes generated by stereological measurement for animals in the developmental study. Figure 4D_E_volume_number. Raw pituitary volumes and cell number for adult animals generated by stereological measurement. Figure 4F_RTqPCR. RT-qPCR data for Dlk1 expression from hypothalamus at 8 weeks, females and males. Normalised to B-actin as a housekeeping gene.
- https://cdn.elifesciences.org/articles/84092/elife-84092-fig4-data1-v2.zip
Figure 4—figure supplement 1

Dlk1 dosage modulates hormone levels and early life endocrine physiology.
(A–Y) Representative images of IHC showing hormone expression at e18.5 of ACTH (A-D, A’-D’), GH (E-H, E’-H’), LH (I-L, I’-L’), POU1F1 (M-P, M’-P’), PRL (Q-T, Q’-T’), TSH (U-Y, U’-Y’) with two to three animals per genotype examined. Marker expression is stained in brown with haemotoxylin counterstaining in blue. Scale bar = 200 µm, boxed = 100 µm. (Z) Circulating GH measured in plasma from WT-TG mice and their WT littermates at postnatal day 21 (P21, n=9/10), P28 (n=7/9), and P35 (n=10/11). Genotypes had significantly different levels of GH (two-way ANOVA p=0.036 by genotype) with Bonferroni post-hoc testing at each time point **p<0.01. (AA) Day of detection of vaginal opening (VO) in female mice (left) and body weight on that day (right) in WT (n=8–10), WT-TG (n=8), and PAT (n=6) mice. WT-TG entered puberty by this measure earlier than WT littermates. PAT mice weighed significantly less than WT when VO was detected. Genotypes were compared using a one-way ANOVA with Dunn’s multiple comparison test, *p<0.05, **p<0.01. Bars show mean and SD.
Figure 5 with 1 supplement
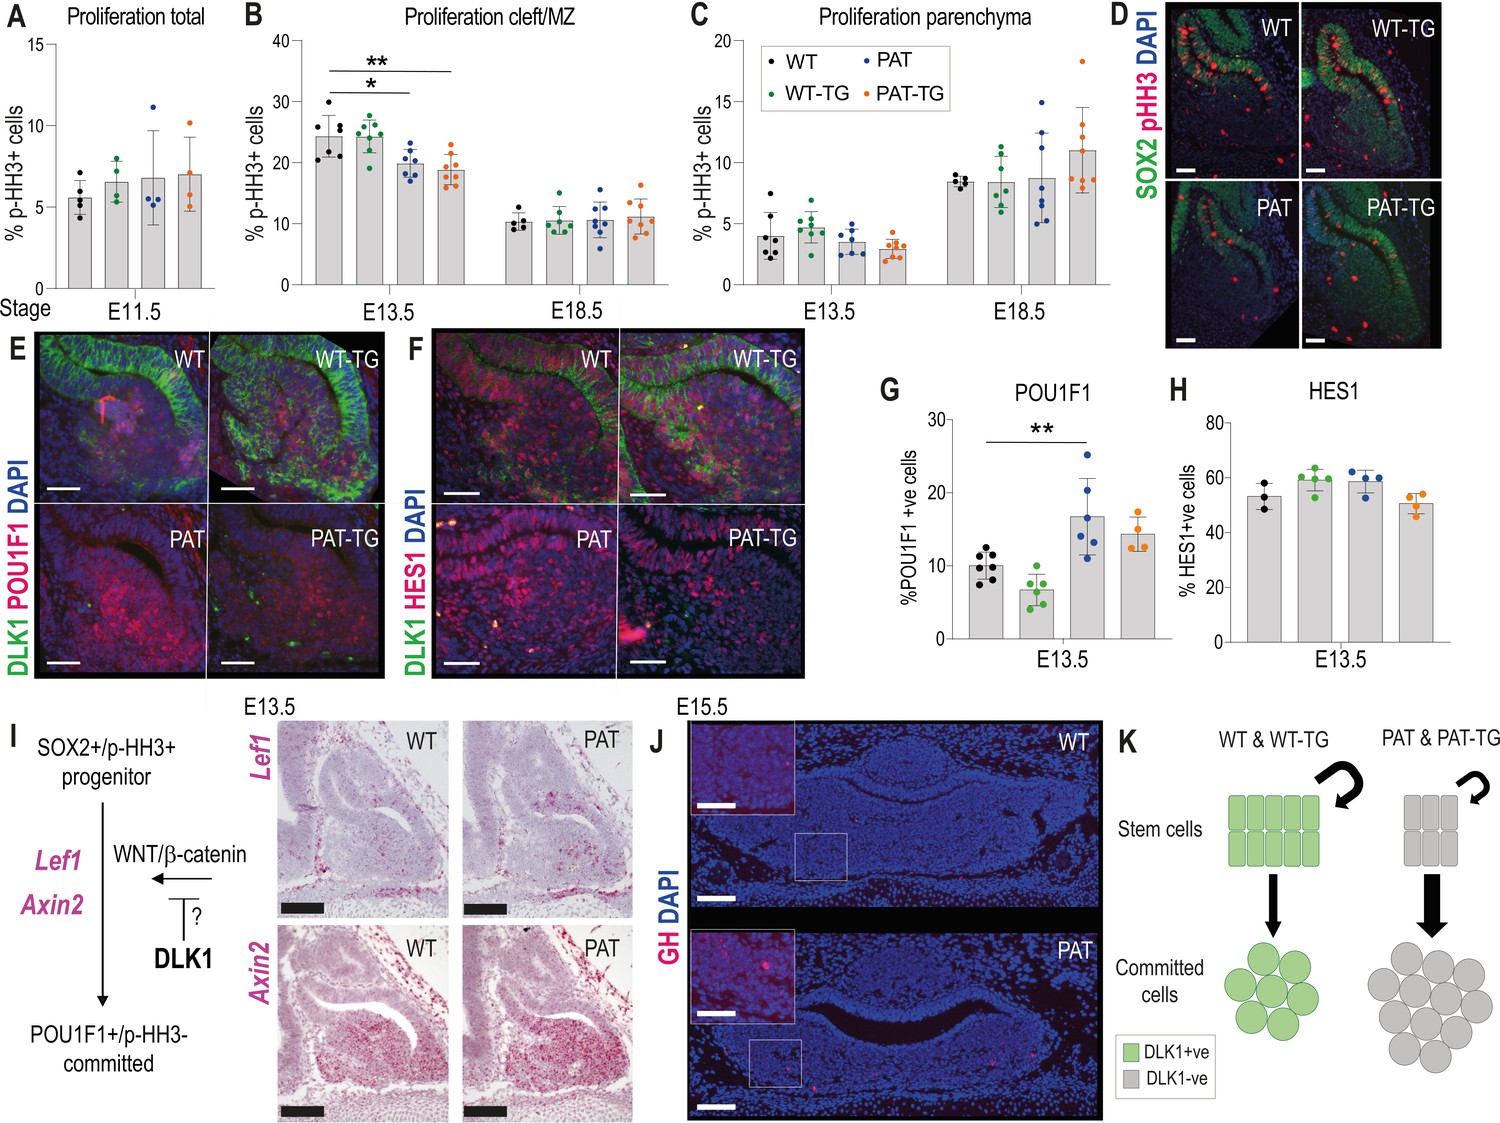
Loss of Dlk1 expression in an embryonic time window shifts progenitor cells from proliferation to differentiation.
(A) Proportion of phospho-histone H3 (pHH3)-positive cells to total cells in the pituitary at E11.5 (n = 4-5/genotype).(B) Proportion of pHH3-positive cells in the morphological stem cell compartment (cleft/marginal zone (MZ)) at E13.5 and E18.5 across the 4 Dlk1 genotypes. (C) Proportion of pHH3-positive cells in the parenchymal region across the 4 Dlk1 genotypes. (B) and (C) for each time point genotypes were compared using a one-way ANOVA with Bonferroni’s posthoc test comparing each genotype with WT (*p<0.05, **p<0.01), and PAT with PAT-TG, (n = 5-8/genotype). (D) Representative image showing increased proliferation in the SOX2 +stem cell compartment of Dlk1-expressing (WT and WT-TG) embryos at E13.5 compared to non-expressing embryos (PAT and PAT-TG). (E) Representative image showing increased number of POU1F1 cells newly differentiating in the parenchyma of the Dlk1 non-expressing E13.5 pituitary (PAT and PAT-TG), compared with the Dlk1-expressing (WT and WT-TG) gland. (F) Representative image showing no difference in the number of cells expressing nuclear HES1 in Dlk1-expressing (WT and WT-TG) embryos at E13.5 compared to non-expressing embryos (PAT and PAT-TG). (D-F) scale bar = 50 µm. (G) Proportion of POU1F1-positive cells in the parenchymal region at E13.5 across the 4 Dlk1 genotypes. Genotypes were compared using a one-way ANOVA with Bonferroni’s posthoc test comparing each genotype with WT (**p<0.01, n = 4-7/genotype). (H) Proportion of nuclear HES1-positive cells in the E13.5 pituitary of the 4 Dlk1 genotypes. Genotypes were compared using a one-way ANOVA with Bonferroni’s posthoc test comparing each genotype with WT (none significant, n = 3-5/genotype). (I) Left: schematic showing how Dlk1 might interact with the WNT signalling pathway which promotes commitment towards the Pou1f1 lineage. Right: RNA scope in-situ hybridisation for Lef1 and Axin2 in E13.5 pituitary from WT and PAT littermates. Lef1 and Axin2 expression is indicated by pink staining, counterstained in blue (haematoxylin). Scale bar = 100 µm. (J) Representative IF for GH at e15.5 in WT and PAT pituitary (coronal section). A small number of GH-positive cells were detected in 6/6 PAT compared to 0/4 WT animals. Scale bar = 100 µm or 50 µm (inset). (K) Schematic summarising the impact of loss of Dlk1 expression in the embryonic pituitary gland.
Figure 5—figure supplement 1
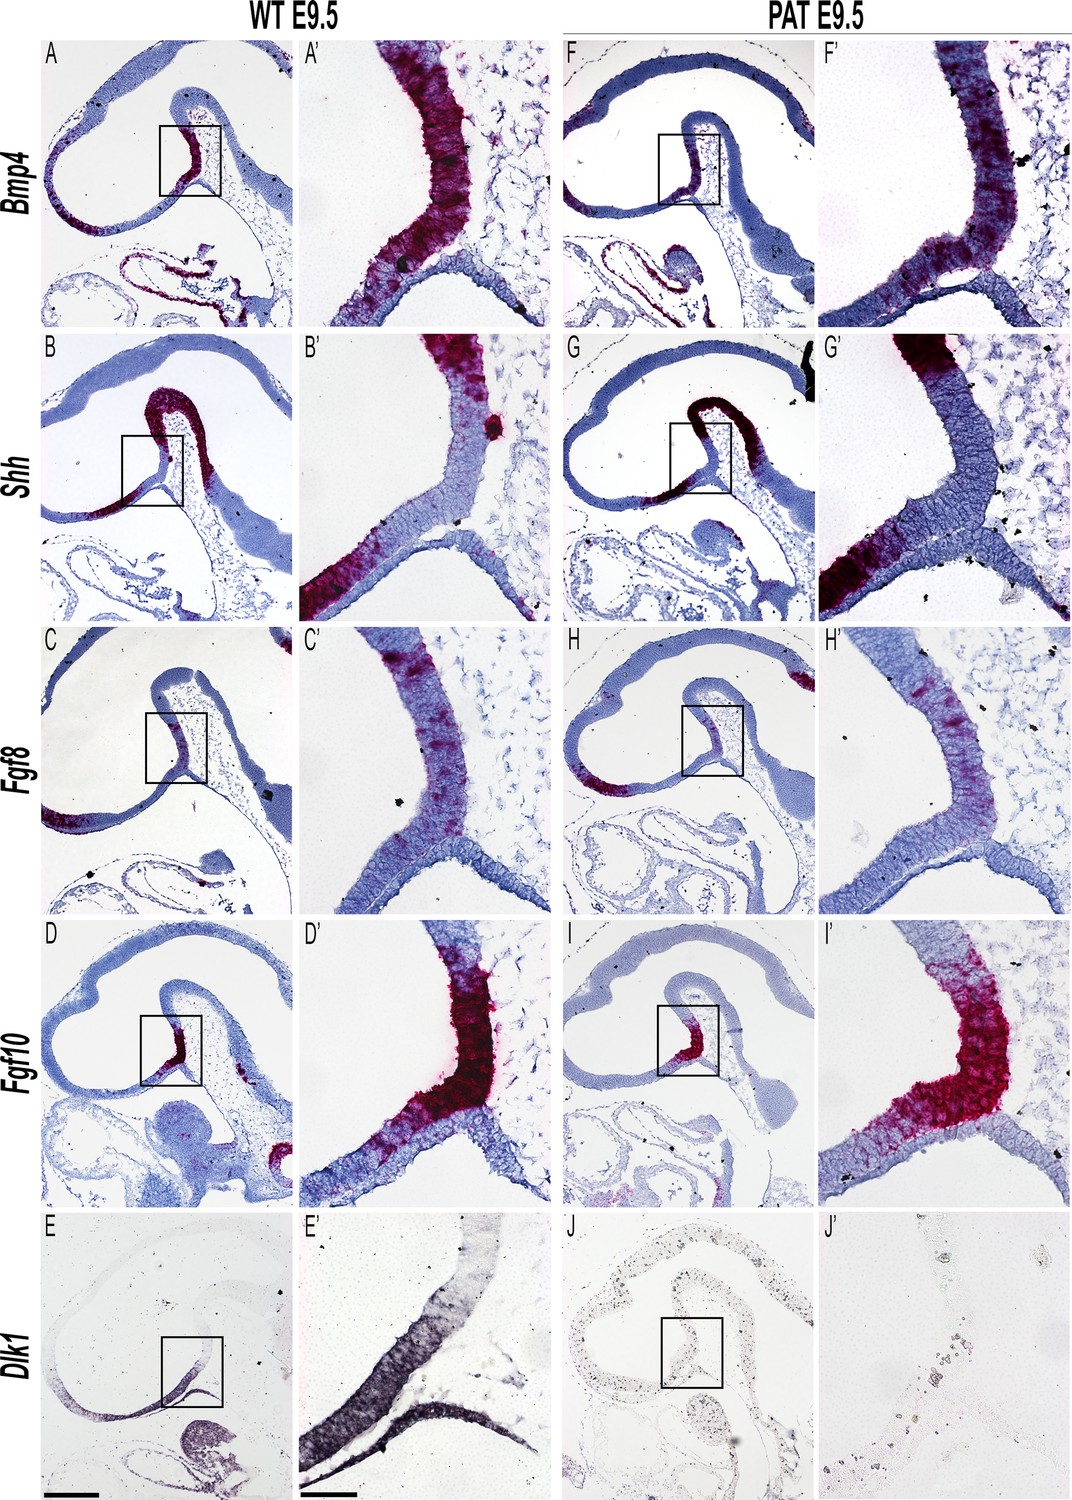
Altered dosage of Dlk1 does not affect expression of early morphological signalling genes in Rathke’s pouch.
Representative images of mRNA in situ hybridisation in E9.5 wild type (WT) and Dlk1-paternal heterozygote (PAT) embryos using specific probes against Bmp4 (A, A’; F, F’), Shh (B, B’; G, G’), Fgf8 (C, C’; H, H’), Fgf10 (D, D’; I, I’), all red with blue haemotoxylin counterstaining, and Dlk1 (E, E’; J, J’) purple, no counterstaining. At least 3 animals per genotype were examined. Scale bar = 200 µm for main images and 50 µm for boxed images.
Figure 6

Increased proliferation and stem cell number occurs when Dlk1 dosage is elevated in both stem and parenchymal cells.
(A) Proportion of phospho-histone H3 (p–HH3)-positive cells in the marginal zone (MZ) of the anterior pituitary at postnatal days 7, 14, and 21. (B) Proportion of phospho-histone H3 (p–HH3)-positive cells in the parenchymal zone (MZ) of the anterior pituitary at postnatal days 7, 14, and 21. (A) and (B) for each time point genotypes were compared using a one-way ANOVA with Bonferroni’s posthoc test comparing each genotype with WT (**p<0.01, n = 1-6/genotype). (C) Representative images of immunohistochemistry for p-HH3 at P14 (brown staining, blue counterstain with haemotoxylin), showing increased proportion of positive staining in the parenchyma of the WT-TG anterior pituitary. Scale bars = 250 µm. (D) Proportion of SOX2-positive cells in the anterior pituitary at postnatal day 21. Genotypes were compared using a one-way ANOVA with Bonferroni’s posthoc test comparing each genotype with WT (*p<0.05, n = 4-8/genotype). (E) Volumes of P21 anterior pituitaries subdivided into categories dependent on location and SOX2 staining. Genotypes were compared using a two-way ANOVA and differ significantly according to genotype (p<0.0002), category (p<0.0001) and the interaction between them (p<0.0001). Genotypes are compared in each category to WT using Dunnett’s multiple comparison test. WT-TG animals have a significantly increased cell volume in all categories, whereas PAT and PAT-TG animals differ only in parenchymal cell volume (*p<0.05). Bars show mean +/-SD, n=4–8 animals/genotype. (F) Representative images of immunohistochemistry for SOX2 at P21 (brown staining, blue counterstain with haemotoxylin), showing increased proportion of positive staining in the WT-TG anterior pituitary. Scale bars = 250 µm. (G) Methodology for determining the number of tissue-resident stem cells in the AP. Whole pituitary is dissected and the posterior lobe removed. The tissue is enzymatically dissociated and counted. A fixed number of cells are seeded at low density into culture media that promotes stem cell growth. After 7 days colonies are counted. Each colony represents a stem cell from the original organ. (H) Image of pituitary stem cell cultures stained after growth for 7 days, derived from WT (top) and WT-TG (bottom) adult animals. Black dots in the plate indicate colonies derived from a single colony forming unit (CFUs). (I) Number of CFUs from pituitary stem cells following 7 days of culture on 4 separate occasions from a total of n=6 WT and n=9 WT-TG, 13–16 week adult animals. (J) Area of CFUs from the stem cell cultures in (I). Genotypes were compared using a Student’s t-test, *p<0.05. (K) Schematic summarising the action of Dlk1 in the different compartments of the AP.
Tables
Appendix 1—key resources table
| Reagent type (species) or resource | Designation | Source or reference | Identifiers | Additional information |
|---|---|---|---|---|
| Gene (Mus musculus) | Delta-like homologue 1 (Dlk1) | MGI:94900 | Dlk1 | |
| Strain, strain background (Mus musculus, males and female) | C57BL6J | WT | ||
| Genetic reagent (Mus musculus) | Dlk1tm1Srba | Raghunandan et al., 2008 MGI:3526402 | “Dlk1 deletion; PAT; PAT-TG” | |
| Genetic reagent (Mus musculus) | TgDlk1-70 | da Rocha et al., 2009 | “Dlk1 transgenic; WT-TG; PAT-TG” | |
| Antibody | Anti-SOX2 (Goat Polyclonal) | Immune Systems Ltd | Anti-SOX2 | GT15098, RRID:AB_2195800 |
| Antibody | Anti-SOX2(Rabbit Monoclonal) | Abcam | Anti-SOX2 | ab92494, RRID:AB_10585428 |
| Antibody | Anti-POU1F1 (PIT1) (Rabbit Monoclonal) | Gifted by Dr S. J. Rhodes (IUPUI, USA) | Anti-POU1F1 | 422_Rhodes, RRID:AB_2722652 |
| Antibody | Anti-pHH3 (Rabbit Polyclonal) | Millipore | Anti-pHH3 | 05–806, Anti-phospho-Histone H3 (Ser10) Antibody, clone 3 H10 https://www.merckmillipore.com/GB/en/product/Anti-phospho-Histone-H3-Ser10-Antibody-clone-3H10,MM_NF-05–806 |
| Antibody | Anti-GH (Rabbit Polyclonal) | National Hormone and Peptide Program (NHPP) | Anti-GH | AFP-5641801 |
| Antibody | Anti-TSH (Rabbit Polyclonal) | National Hormone and Peptide Program (NHPP) | Anti-TSH | AFP-1274789 |
| Antibody | Anti-PRL (Rabbit Polyclonal) | National Hormone and Peptide Program (NHPP) | Anti-PRL | AFP-4251091 |
| Antibody | Anti-ACTH (Mouse Monoclonal) | National Hormone and Peptide Program (NHPP) | Anti-ACTH | AFP-156102789 |
| Antibody | Anti-DLK1 (Rabbit monoclonal) | abcam | Anti-DLK1 | ab21682 https://www.abcam.com/products/primary-antibodies/dlk-1-antibody-ab21682.html |
| Antibody | Anti-DLK1 (Goat polyclonal) | R&D | AF8277 | AF8277 https://www.rndsystems.com/products/mouse-pref-1-dlk1-fa1-antibody_af8277 |
| Antibody | Anti-HES1 | Cell Signaling Technologies | Anti-HES1 | D6P2U |
| Antibody | Anti-Rabbit 488 (Goat Polyclonal) | Life Technologies | Anti-rabbit 488 | A11008, RRID:AB_143165 |
| Antibody | Anti-Rabbit 647 (Goat Polyclonal) | Life Technologies | Anti-rabbit 594 | A21050, RRID:AB_141431 |
| Antibody | anti-Digoxigenin-AP | Millipore-SIGMA | Anti-DIG | 45–11093274910 |
| Antibody | Anti-alpha tubulin | Millipore-SIGMA | Anti-tub | T5168 |
| Antibody | Anti-Goat 488 (Donkey Polyclonal) | Abcam | Anti-goat 488 | ab150133, RRID:AB_2832252 |
| Antibody | biotinylated goat α-rabbit | Vector Laboratories | biotinylated goat α-rabbit | BA-1000 |
| Antibody | biotinylated goat α-mouse | Vector Laboratories | biotinylated goat α-mouse | BA-9200 |
| Antibody | biotinylated α -goat | Vector Laboratories | biotinylated α -goat | BA9500 |
| Sequence-based reagent | RNAscope probe M. musculus Axin2 | Advanced Cell Diagnostics | Mm-Axin2 | 400331 |
| Sequence-based reagent | RNAscope probe M. musculus Shh | Advanced Cell Diagnostics | Mm-Shh | 314361 |
| Sequence-based reagent | RNAscope probe M. musculus Fgf8 | Advanced Cell Diagnostics | Mm-Fgf8 | 313411 |
| Sequence-based reagent | RNAscope probe M. musculus Fgf10 | Advanced Cell Diagnostics | Mm-Fgf10 | 446371 |
| Sequence-based reagent | RNAscope probe Lef1 | Advanced Cell Diagnostics | Mm-Lef1 | 441861 |
| Sequence-based reagent | Dlk1 qPCR Forward primer | PMID:25349437 | GAAAGGACTGCCAGCACAAG | |
| Sequence-based reagent | Dlk1 qPCR Reverse primer | PMID:25349437 | CACAGAAGTTGCCTGAGAAGC | |
| Sequence-based reagent | Dlk1 splice qPCR Forward primer | PMID:25349437 | CTGCACACCTGGGTTCTCTG | |
| Sequence-based reagent | Dlk1 splice qPCR Reverse primer | PMID:25349437 | CTGCACACCTGGGTTCTCTG | |
| Sequence-based reagent | Ghrh qPCR Forward primer | This paper | GCTGTATGCCCGGAAAAGTGAT | |
| Sequence-based reagent | Ghrh qPCR Reverse primer | This paper | AATCCCTGCAAGATGCTCTCC | |
| Sequence-based reagent | Sst qPCR Forward primer | This paper | CCCAGACTCCGTCAGTTTCT | |
| Sequence-based reagent | Sst qPCR Reverse primer | This paper | GGGCATCATTCTCTGTCTGG | |
| Sequence-based reagent | Actb qPCR Forward primer | PMID:25349437 | TTCTTTGCAGCTCCTTCGTT | |
| Sequence-based reagent | Actb qPCR Reverse primer | PMID:25349437 | ATGGAGGGGAATACAGCCC | |
| Sequence-based reagent | Tuba qPCR Forward primer | PMID:25349437 | AGACCATTGGGGGAGGAGAT | |
| Sequence-based reagent | Tuba qPCR Reverse primer | PMID:25349437 | GTGGGTTCCAGGTCTACGAA | |
| Commercial assay or kit | RNAScope 2.5 HD Assay-RED | Advanced Cell Diagnostics | 322350 | |
| Commercial assay or kit | ABC kit | Vector Laboratories | Cat# Vector PK-6100 RRID:AB_2336819 | |
| Commercial assay or kit | BCA assay | Thermo Fisher | Cat# 23227 | |
| Commercial assay or kit | REDTaq ReadyMix PCR Reaction Mix | Sigma-Aldrich (Merck) | R2523 | |
| Software, algorithm | Prism 9 | GraphPad Software | https://www.graphpad.com/ | |
| Software, algorithm | NDP View | Hamamatsu Photonics | https://www.hamamatsu.com/ | |
| Software, algorithm | The Galaxy Platform | Afgan et al., 2016; Blankenberg et al., 2010; Goecks et al., 2010 | https://usegalaxu.org RRID:SCR_006281 | |
| Software, algorithm | DESeq2 v2.11.38 | Love et al., 2014 | https://github.com/Bioconductor-mirror/DESeq2 RRID:SCR_015687 | |
| Software, algorithm | featureCounts v1.4.6p5 | Liao et al., 2014 | http://subread.sourceforge.net/ RRID:SCR_012919 | |
| Software, algorithm | QuPath | PMID:29203879 | https://qupath.readthedocs.io/en/0.4/ |
Additional files
-
Supplementary file 1
Quantitative assessment of pituitary size and hormone cell composition in Dlk1-overexpressing adult mice.
(a) Proportions of AP cells labelled with hormonal markers in WT and WT-TG female animals at 12 weeks of age. (b) Total body mass of animals from matched litters sacrificed from E11.5 to P21. Individuals in each age group were compared by One-Way ANOVA with post-hoc pairwise testing WT vs WT-TG, PAT, PAT-TG and PAT vs PAT-TG, corrected for multiple comparisons using Bonferroni’s adjustment. (c) Pituitary volumes acquired by stereological estimation in the embryo. Data from males and females is combined. (d) Pituitary volumes acquired by stereological estimation in of the intact postnatal gland. Individuals in each age group were compared by One-Way ANOVA with post-hoc pairwise testing WT vs WT-TG, PAT, PAT-TG and PAT vs PAT-TG, corrected for multiple comparisons using Bonferroni’s adjustment. Data from males and females is combined. (e) Pituitary volumes acquired by stereological estimation in of the intact adult gland. All animals were compared by Two-Way ANOVA with post-hoc pairwise testing WT vs WT-TG, PAT, PAT-TG and PAT vs PAT-TG, using Dunnett’s multiple comparison test. (f) Proportion of proliferating cells (IHC positive for p-HH3) in the embryonic and postnatal pituitary gland. Data from males and females is combined. (g) RNAScope probes used in this study. (h) Primary antibodies used in the study. (i) RT-PCR and RT-qPCR primers used in this study.
- https://cdn.elifesciences.org/articles/84092/elife-84092-supp1-v2.docx
-
MDAR checklist
- https://cdn.elifesciences.org/articles/84092/elife-84092-mdarchecklist1-v2.pdf
-
Source data 1
Zipped file containing raw data used to generate graphs in Figures 5 and 6.
Fig5ABC&FigAB_pHH3. Cell counts of pHH3+ cells in developmental time course. Fig5G_POU1F1. Cell counts of POU1F1+ cells at e13.5. Fig5H_HES1. Cell counts of HES1+ cells at e13.5. Fig6DE_SOX2. Cell counts for %SOX2+ cells and SOX2+ compartmental volume at postnatal day 21.
- https://cdn.elifesciences.org/articles/84092/elife-84092-data1-v2.zip
Download links
A two-part list of links to download the article, or parts of the article, in various formats.
Downloads (link to download the article as PDF)
Open citations (links to open the citations from this article in various online reference manager services)
Cite this article (links to download the citations from this article in formats compatible with various reference manager tools)
Imprinted Dlk1 dosage as a size determinant of the mammalian pituitary gland
eLife 12:e84092.
https://doi.org/10.7554/eLife.84092


