Affinity-tagged SMAD1 and SMAD5 mouse lines reveal transcriptional reprogramming mechanisms during early pregnancy
- Department of Pathology & Immunology, Baylor College of Medicine, United States
- Graduate Program of Genetics and Genomics, Baylor College of Medicine, United States
- Department of Molecular and Human Genetics, Baylor College of Medicine, United States
- Center for Drug Discovery, Baylor College of Medicine, United States
- Research Institute for Microbial Diseases, Osaka University, Japan
Figures
Figure 1 with 1 supplement
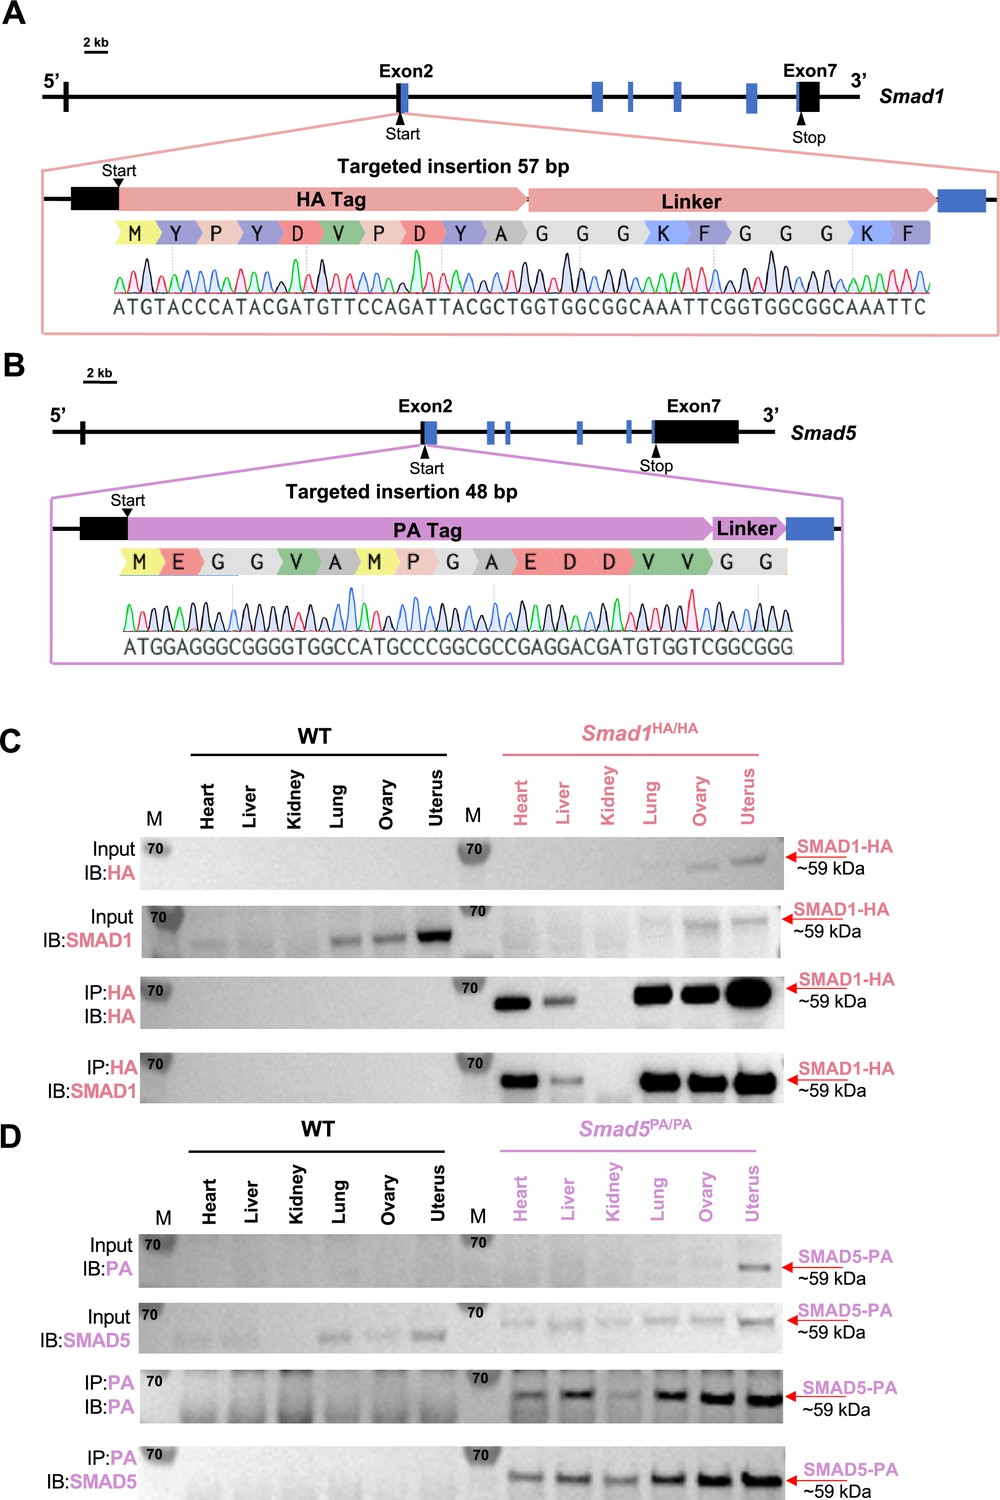
Mouse models with global HA-tagged SMAD1 and PA-tagged SMAD5 proteins.
(A, B) Schematic approaches for generating Smad1HA/HA and Smad5PA/PA knock-in mouse lines. Sanger sequencing of the genotyping results is included as validation of knock-in sequence. Black and blue boxes indicate untranslated and coding regions, respectively. (C, D) Immunoblot (IB) analysis of the immunoprecipitation (IP) of HA-tagged SMAD1 and PA-tagged SMAD5 proteins from different tissues of the tagged mouse lines. Wild-type (WT) mice were used as negative controls. Antibodies used for IB and IP are as labeled. Targeted bands of SMAD1 and SMAD5 are indicated by red arrows.
-
Figure 1—source data 1
Raw uncropped western blot images for Figure 1C and D, without labels.
- https://cdn.elifesciences.org/articles/91434/elife-91434-fig1-data1-v1.tiff
-
Figure 1—source data 2
Uncropped western blot images for Figure 1C, with labels.
- https://cdn.elifesciences.org/articles/91434/elife-91434-fig1-data2-v1.tiff
-
Figure 1—source data 3
Uncropped western blot images for Figure 1D, with labels.
- https://cdn.elifesciences.org/articles/91434/elife-91434-fig1-data3-v1.tiff
Figure 1—figure supplement 1
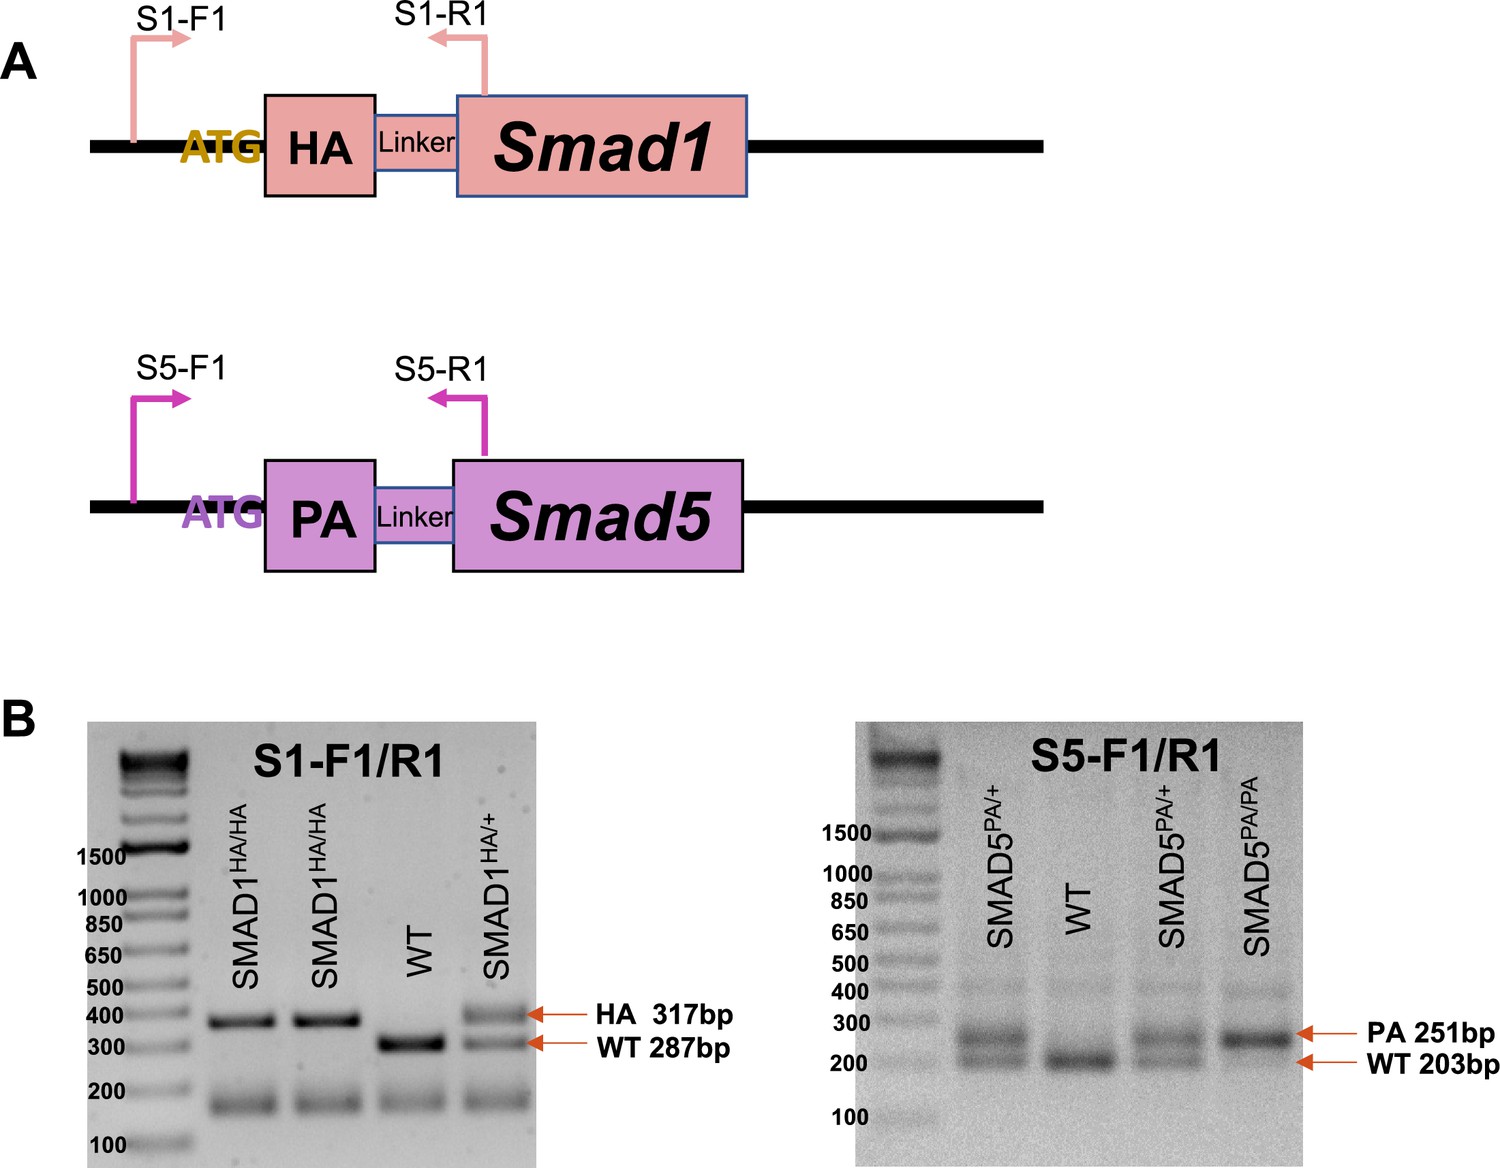
Genotype of the knock-in mouse lines.
(A) Schematic design of the genotype primers for Smad1HA/HA and Smad5PA/PA mouse lines. (B) Exemplary gel electrophoresis of PCR products derived from homozygous knock-in mice, heterozygous mice, and WT mice using genotyping primers.
Figure 2 with 1 supplement
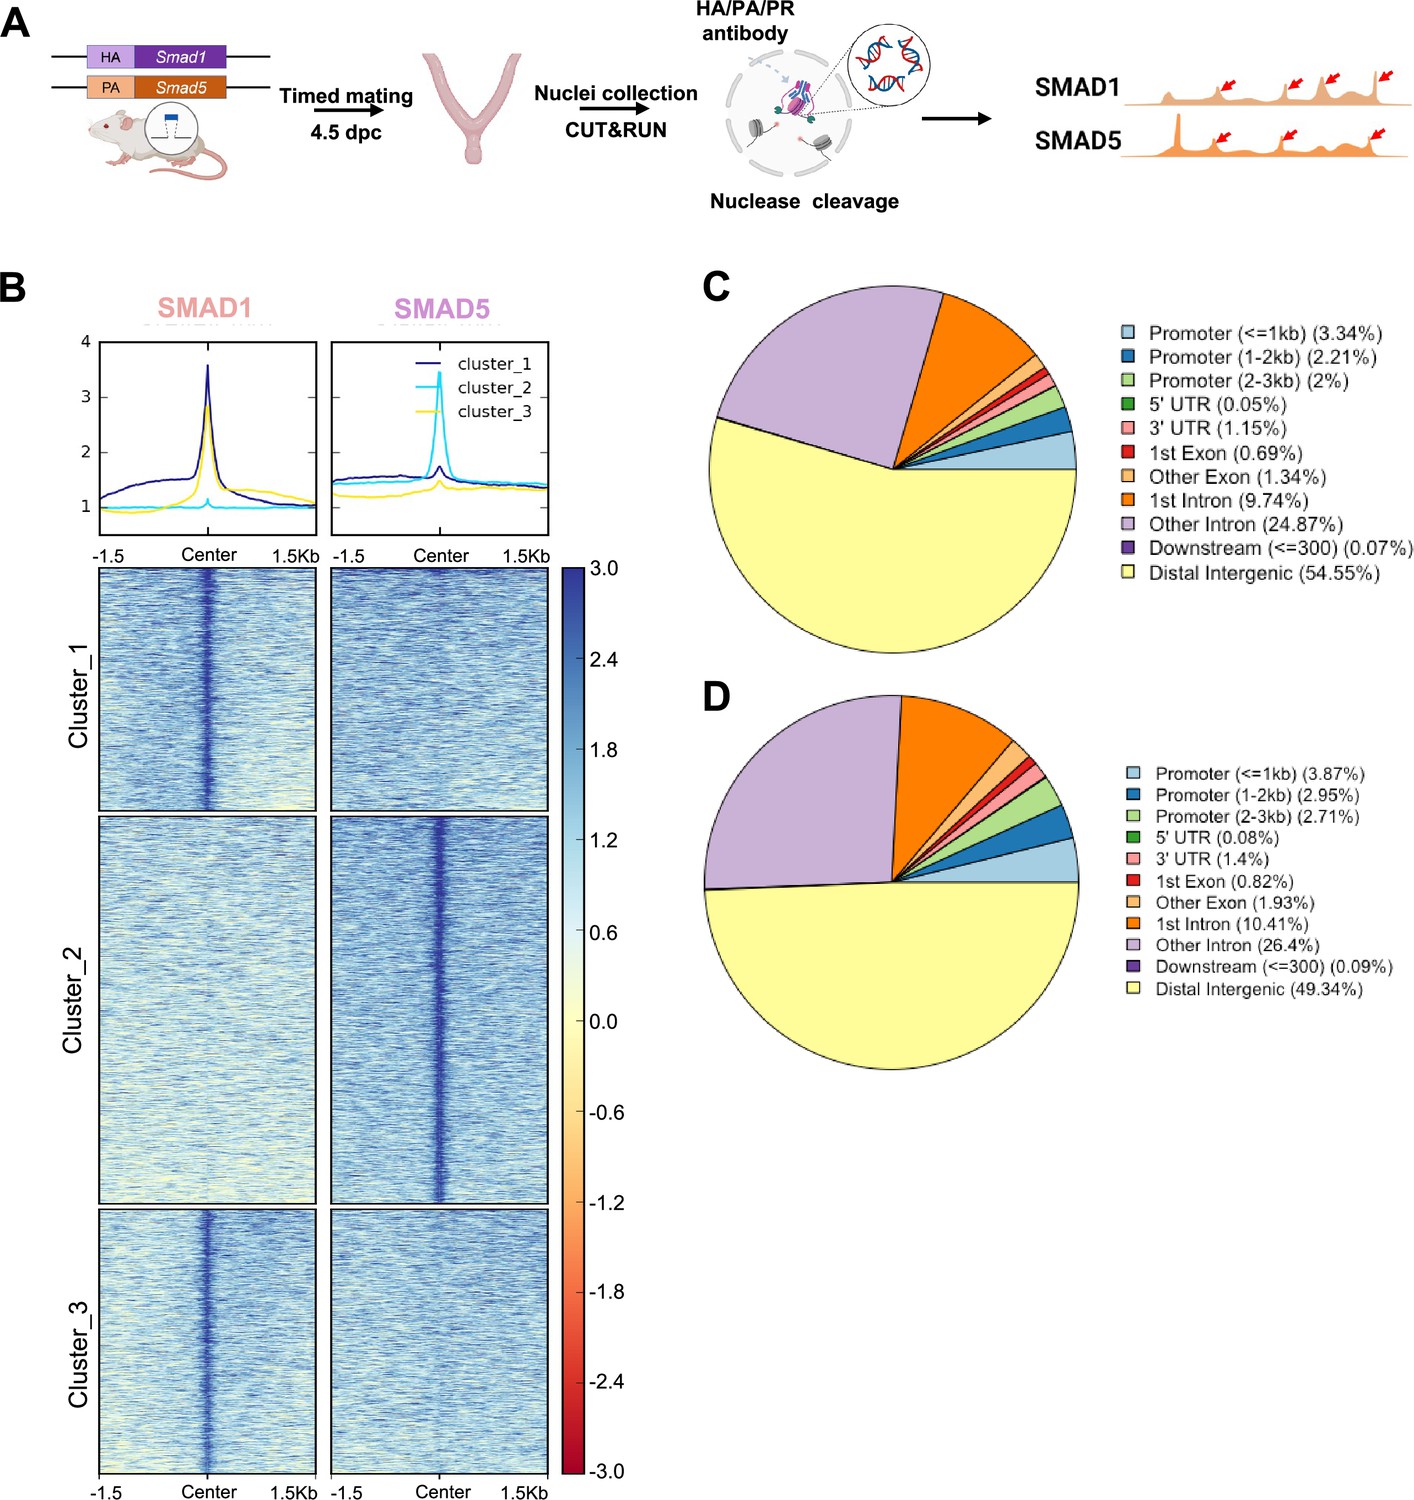
Genomic profiling of SMAD1 and SMAD5 binding sites during decidualization in vivo.
(A) Diagram outlining experimental approaches for tissue collection, processing, and CUT&RUN. (B) Heatmaps and summary plots showing the enrichment of SMAD1 and SMAD5 binding peaks from one exemplary replicate. Clustering was conducted using k-means algorithm. The colors in the summary plots correspond to clusters labeled in the heatmap below. (C, D) Feature distribution of the annotated peaks for the SMAD1 (C) binding sites and SMAD5 (D) binding sites.
Figure 2—figure supplement 1
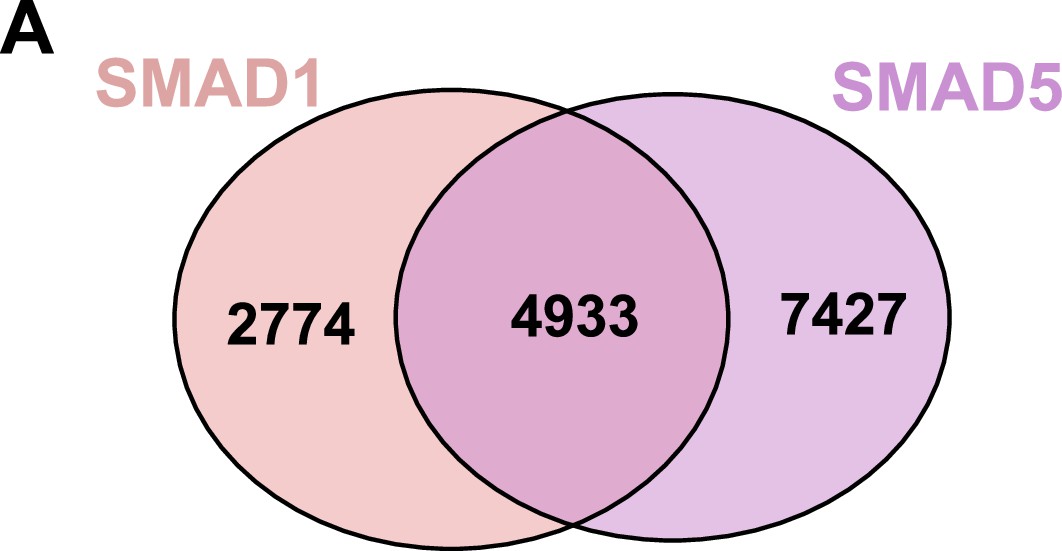
Shared and unique genes bound by SMAD1 or SMAD5 in the promoter region.
(A) Venn diagrams showing the shared and unique genes bound by SMAD1 or SMAD5 in the±3kb region of the promoter regions.
Figure 3
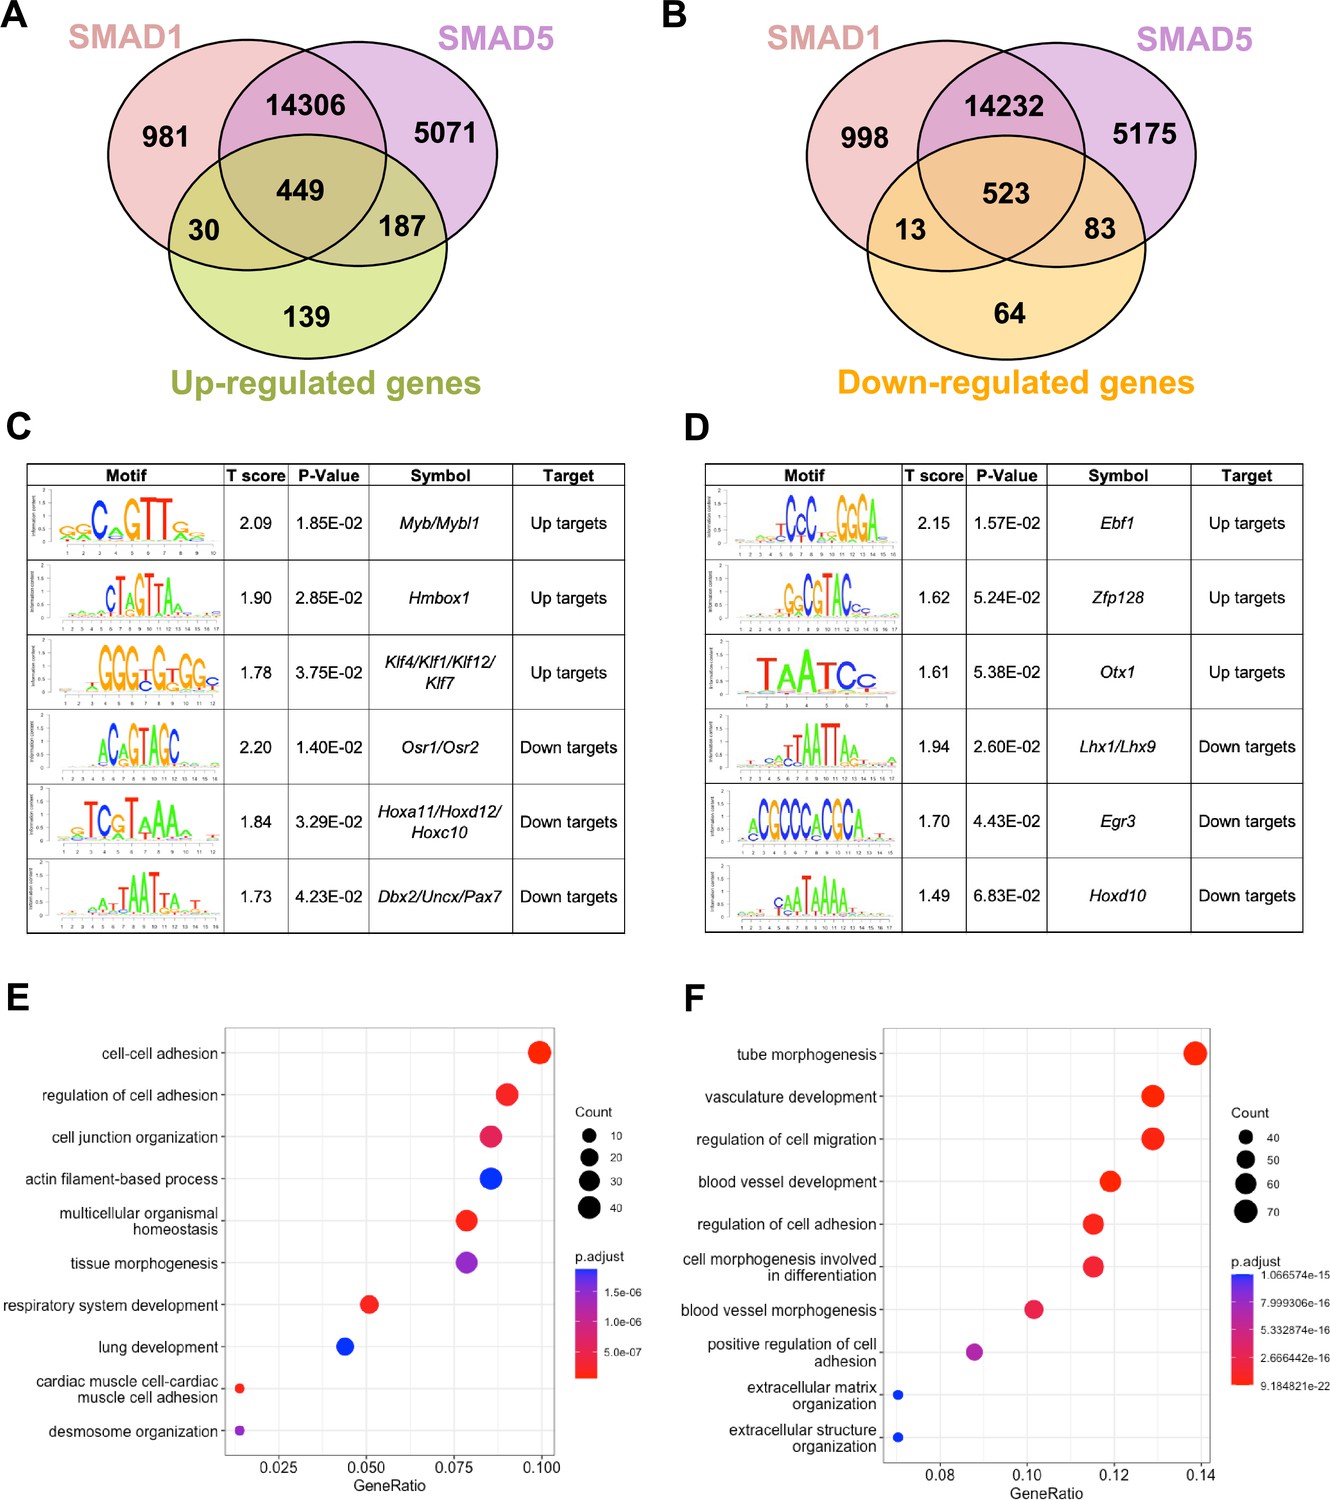
SMAD1 and SMAD5 show unique direct target genes during early pregnancy.
(A, B) Venn diagrams showing the shared and unique direct up-target genes (A) and down-target genes (B) of SMAD1, SMAD5. Numbers indicate genes numbers. (C, D) Motif enrichment analysis from the up-targets and down-targets for SMAD1 (C) and SMAD5 (D). (E, F) Dot plot showing Gene Ontology enrichment analysis of shared direct target genes of SMAD1/5 from the up-targets (E) and the down-targets (F), respectively. Dot size represents the gene ratio in the enriched categories compared to background genes, and dot colors reflect p-value.
Figure 4 with 1 supplement
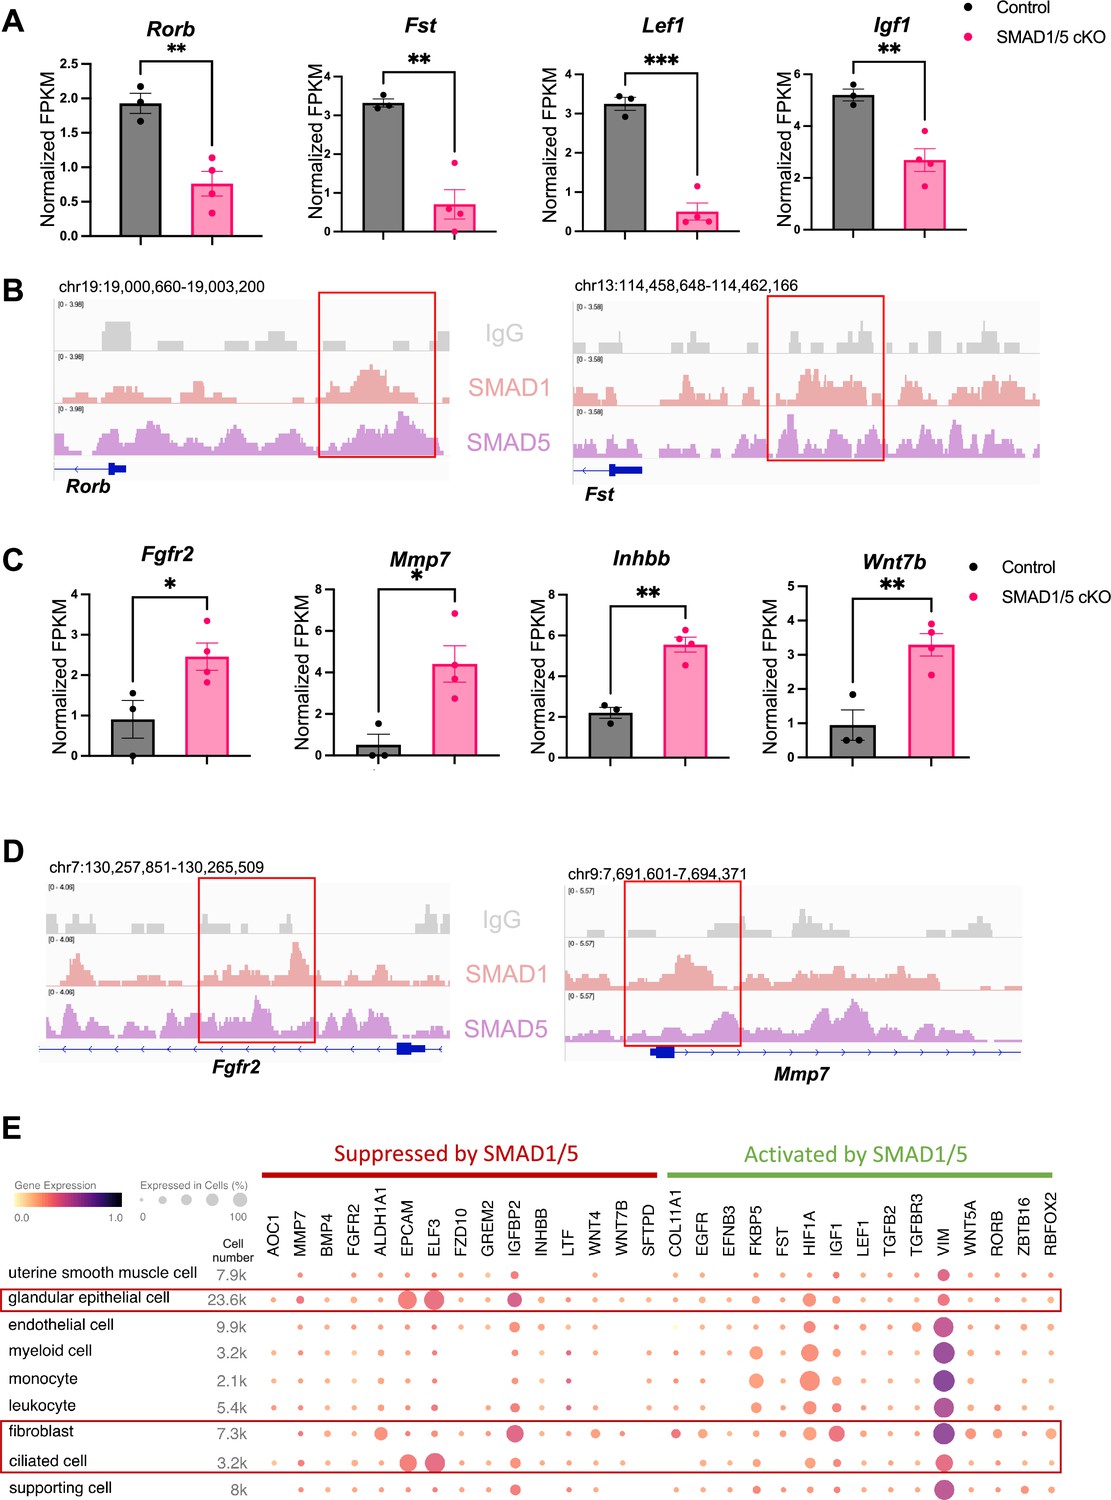
Direct target genes of SMAD1/5 mediate uterine homeostasis.
(A) Bar graph of normalized fragments per kilobase of transcript per million mapped reads (FPKM) of downregulated transcripts in the control and SMAD1/5 conditional knockout (cKO) groups as indicated by the label. Histograms represent average ± SEM of experiments uteri from control mice (N = 3) and SMAD1/5 cKO mice (N = 4). Analyzed by an unpaired t-test. (B) Integrative Genomics Viewer (IGV) track view of SMAD1, SMAD5 binding activities. Gene loci are as indicated in the figure, genomic coordinates are annotated in mm10. (C) Bar graph of FPKM of upregulated transcripts in the control and SMAD1/5 cKO groups as indicated by the label. (D) IGV track view of SMAD1, SMAD5 binding activities. Gene loci are as indicated in the figure, genomic coordinates are annotated in mm10. (E) Dot plot showing the gene expression pattern of the key SMAD1/5 direct target genes in different cell types from published human endometrium single-cell RNA-seq dataset.
Figure 4—figure supplement 1
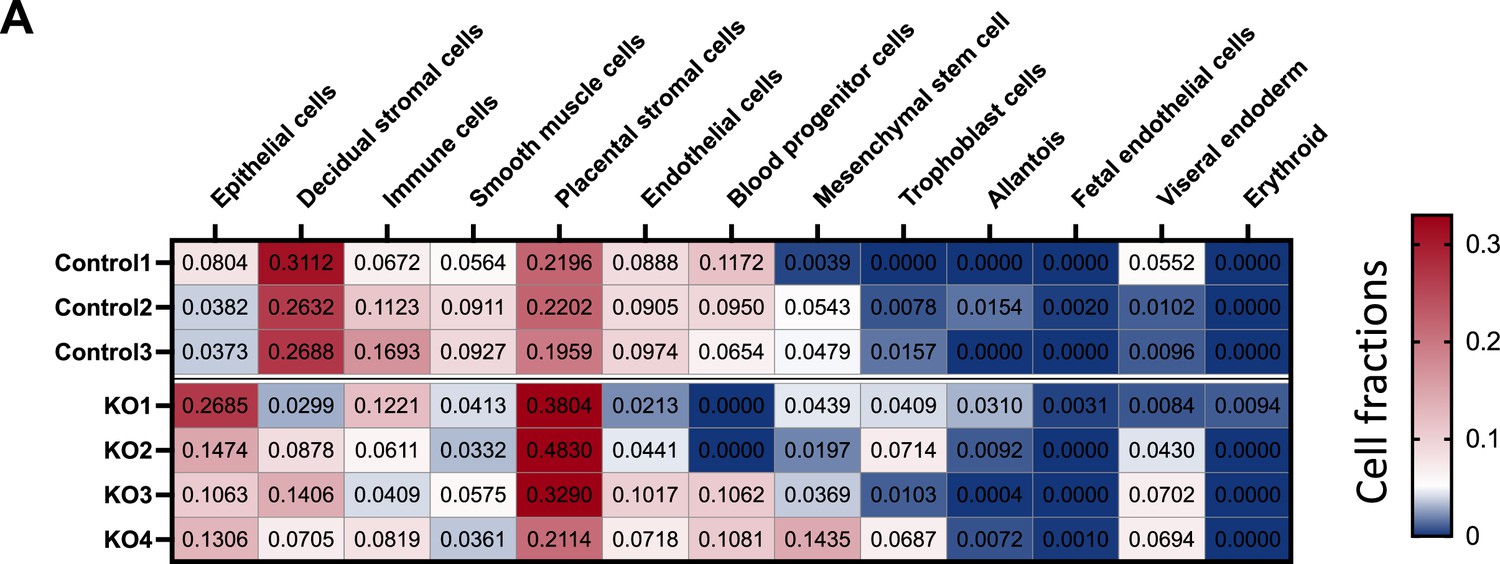
Cell type compositions in the control and SMAD1/5 PR-Cre mice.
(A) Cell type compositions in the deconvoluted RNA-seq from control mice (control 1–3) and SMAD1/5 PR-Cre mice (KO1–4). Numbers plotted in the table are absolute values that reflects the absolute proportion of each cell type in the given sample. A larger number indicates a higher proportion of that cell type in the mixture.
Figure 5 with 1 supplement
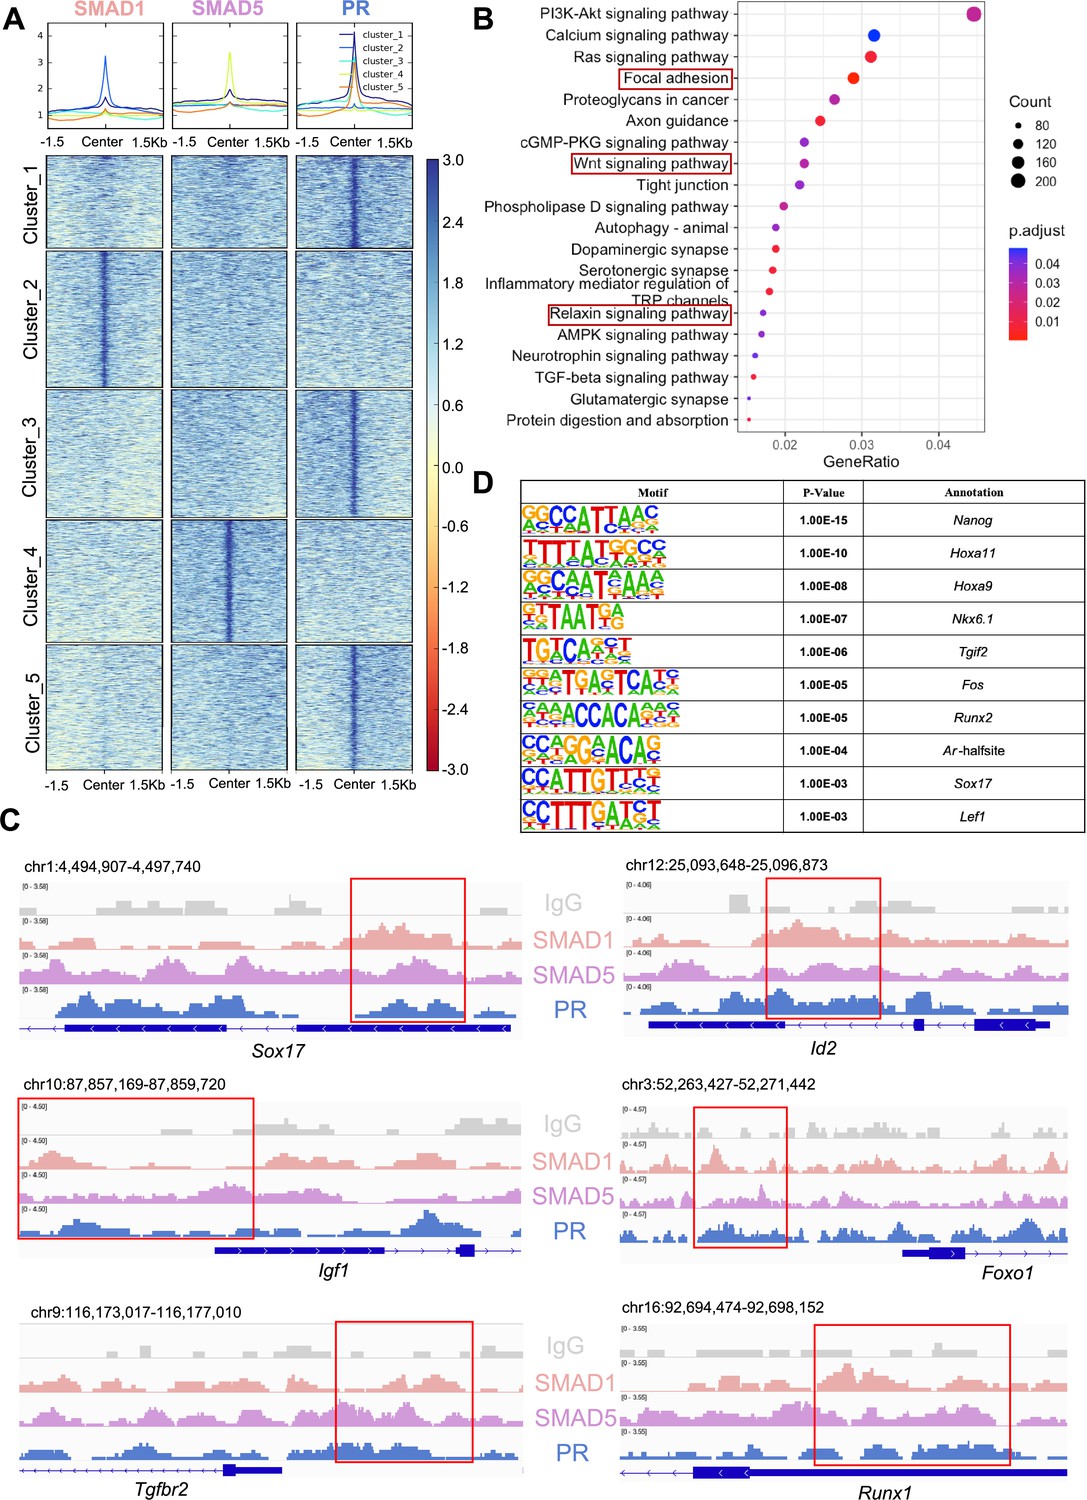
SMAD1 and SMAD5 co-regulate progesterone receptor (PR) target genes.
(A) Heatmaps and summary plots showing the enrichment comparison between SMAD1, SMAD5, and PR binding peaks from one exemplary replicate. Clustering was conducted using k-means algorithm. The colors in the summary plots correspond to clusters labeled in the heatmap below. (B) Dot plot showing KEGG pathway enrichment analysis for shared genes bound by SMAD1, SMAD5, and PR. (C) Integrative Genomics Viewer (IGV) track view of SMAD1, SMAD5, and PR binding activities. Gene loci are as indicated in the figure, genomic coordinates are annotated in mm10. (D) Table of motif analysis results for shared peaks between SMAD1, SMAD5, and PR, with p-value and motif annotation specified for each motif.
Figure 5—figure supplement 1
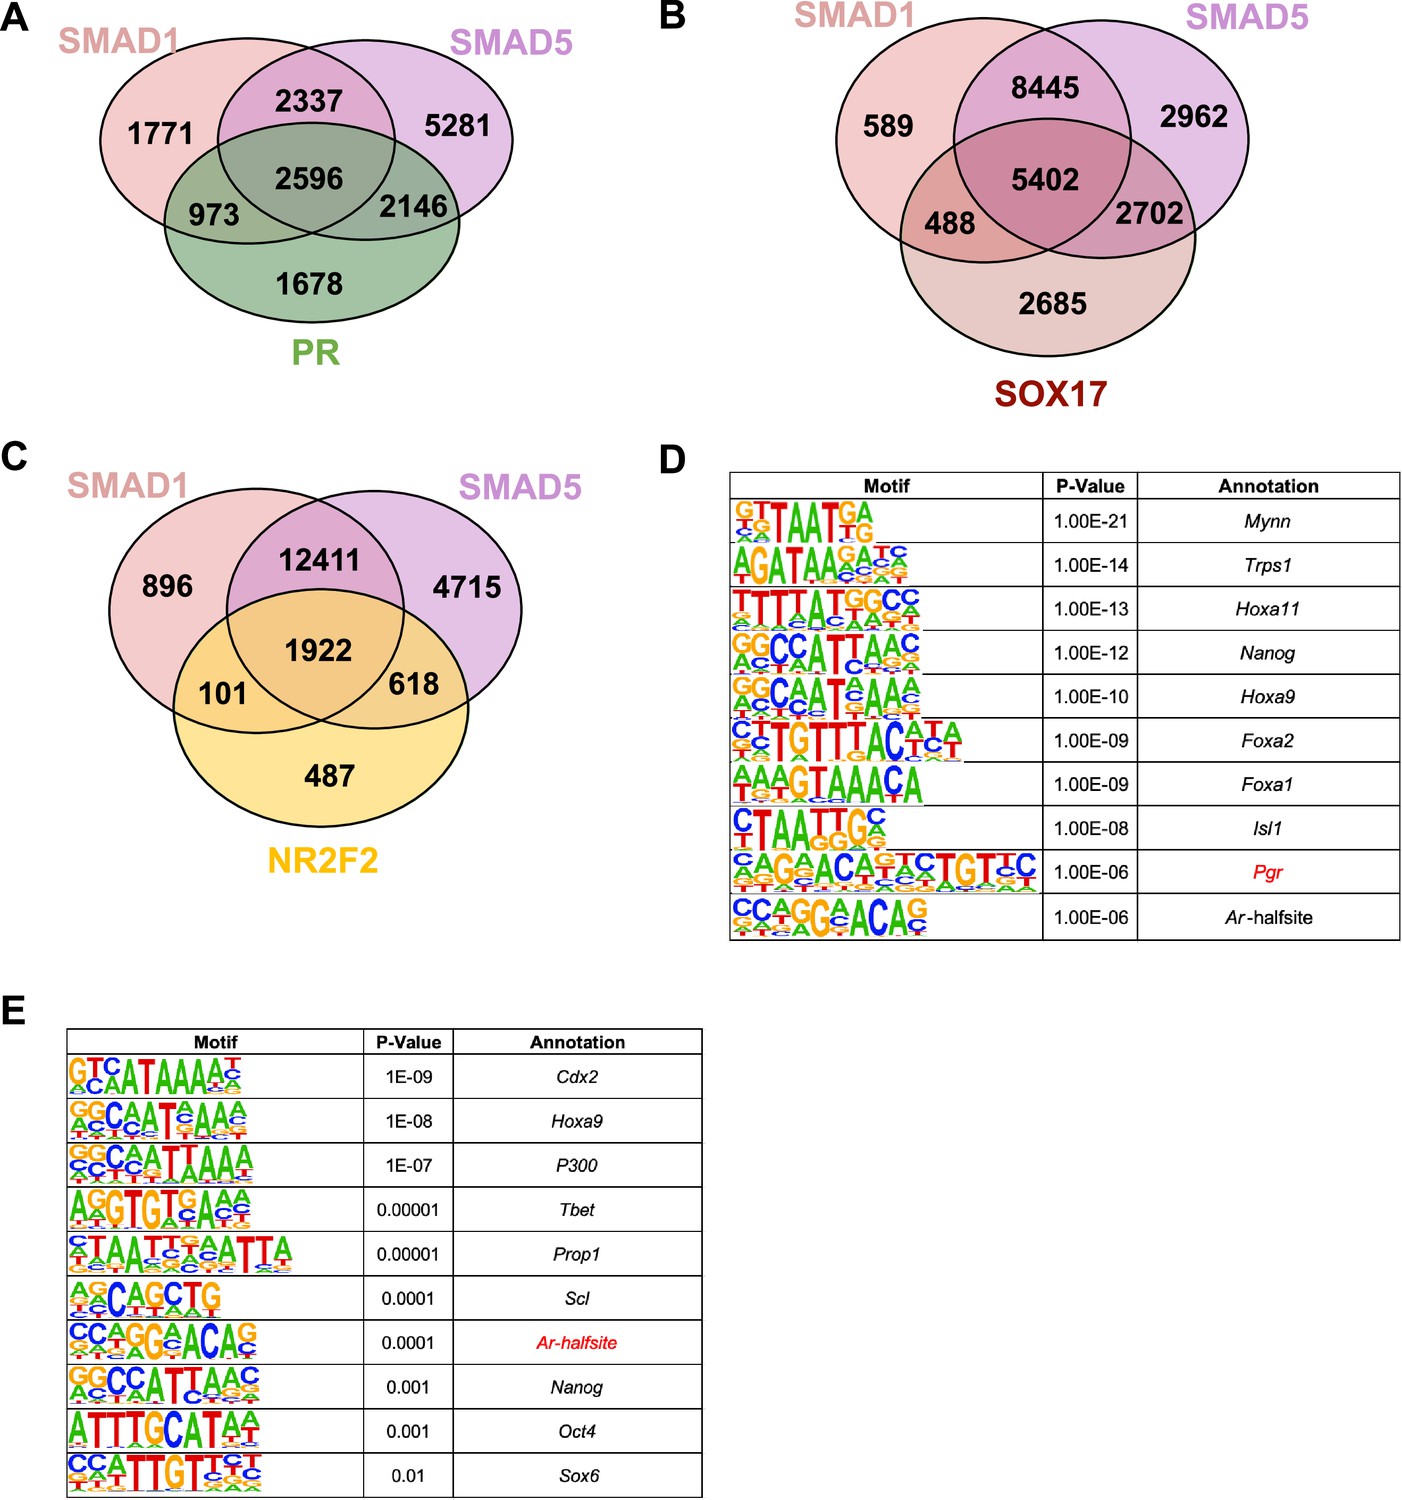
Overlapping of SMAD1/5 with known transcription factors governing uterine homeostasis.
(A) Venn diagrams showing the shared and unique genes bound by SMAD1, SMAD5, or PR in the ±3 kb of the promoter regions. (B) Venn diagrams showing the shared and unique genes bound by SMAD1, SMAD5, or SOX17 in the ±25 kb regions near transcription start site. (C) Venn diagrams showing the shared and unique genes bound by SMAD1, SMAD5, or NR2F2 in the ±25 kb regions near transcription start site. (D, E) Table of motif analysis results for unique peaks for SMAD1 (D) and SMAD5 (E), with p-value and motif annotation specified for each motif.
Figure 6 with 1 supplement
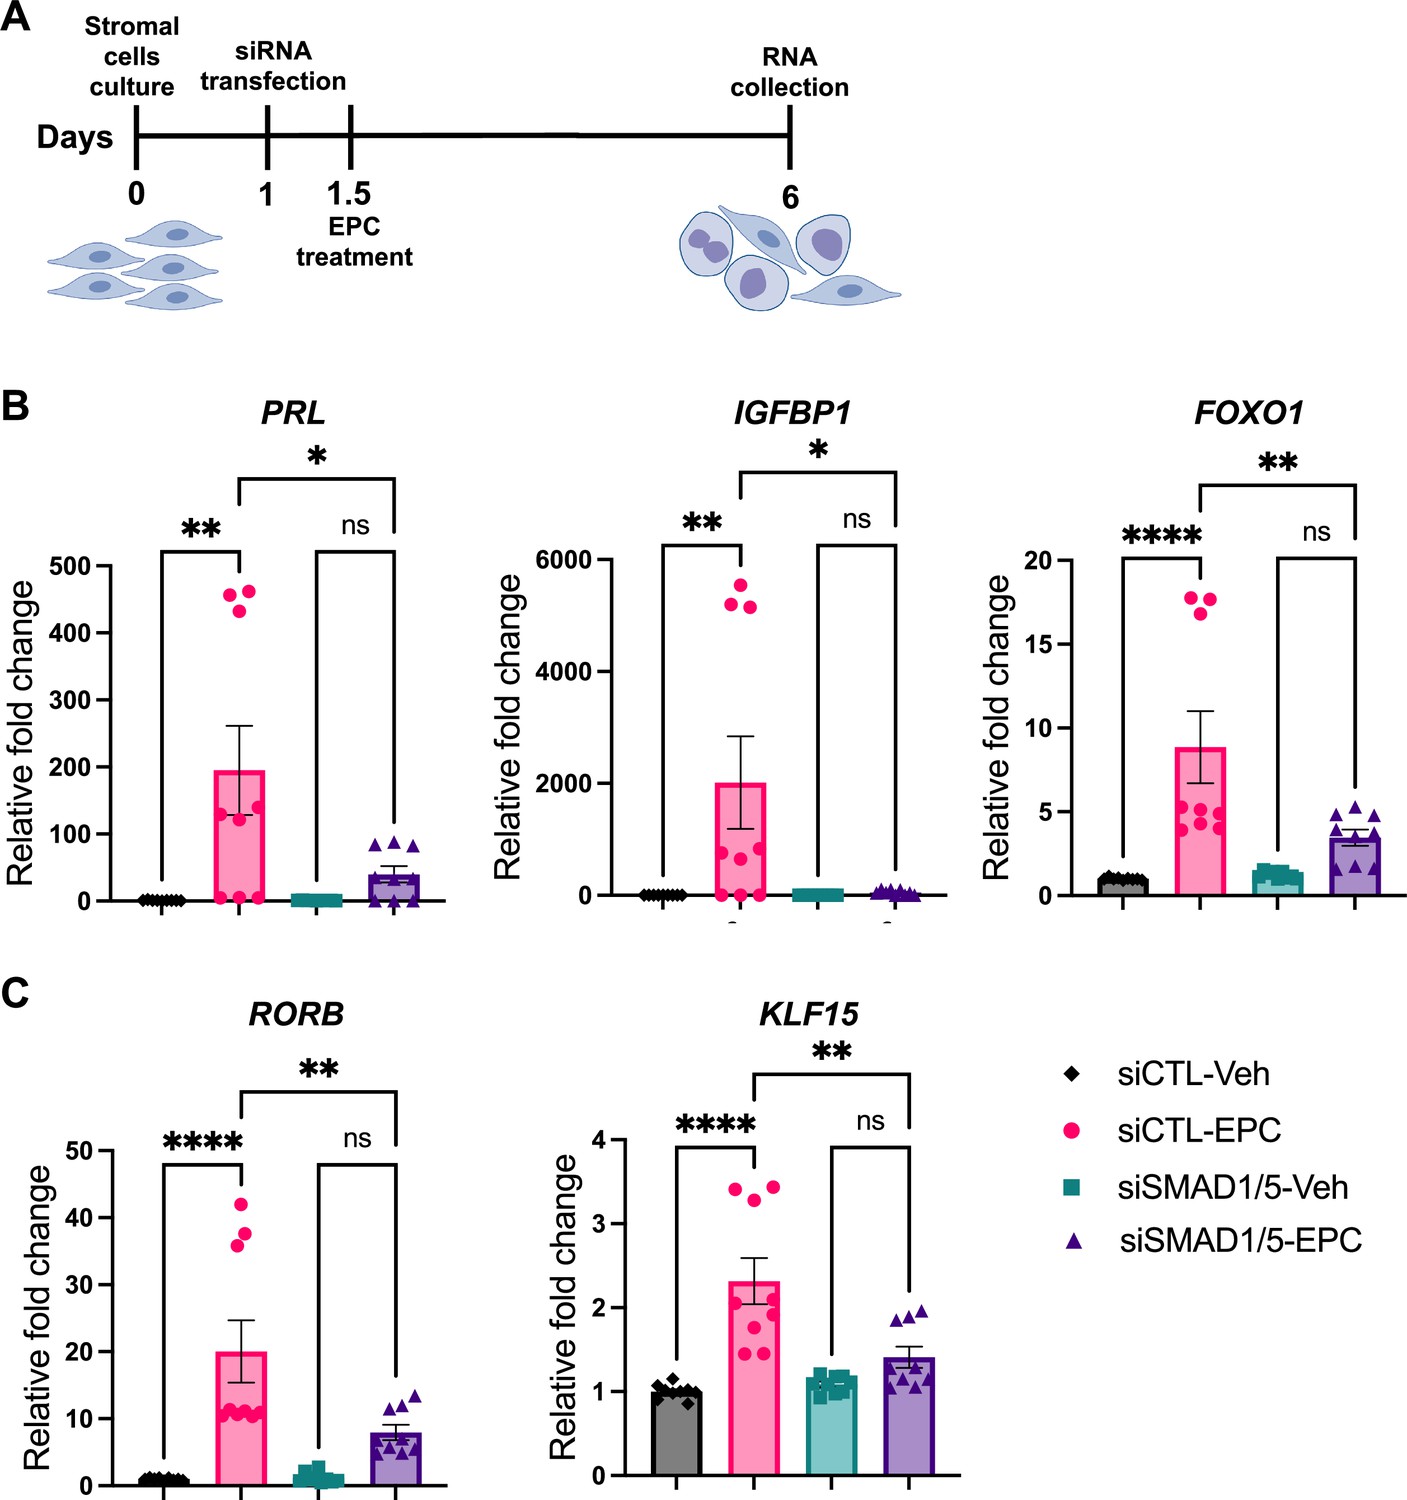
SMAD1 and SMAD5 are required for progesterone receptor (PR) responses during decidualization of human endometrial stromal cells (EnSCs).
(A) Schematic approach and timeline outlining in vitro decidualization for EnSCs. (B, C) RT-qPCR results showing mRNA levels of PRL, IGFBP1, FOXO1, RORB, and KLF15 after SMAD1/5 perturbation using siRNAs. Data are normalized to siCTL-Veh for visualization. Bar graphs represent average ± SEM of experiments on cells from three different individuals with technical triplicates. Analyzed by a one-way ANOVA with post hoc Tukey test.
Figure 6—figure supplement 1
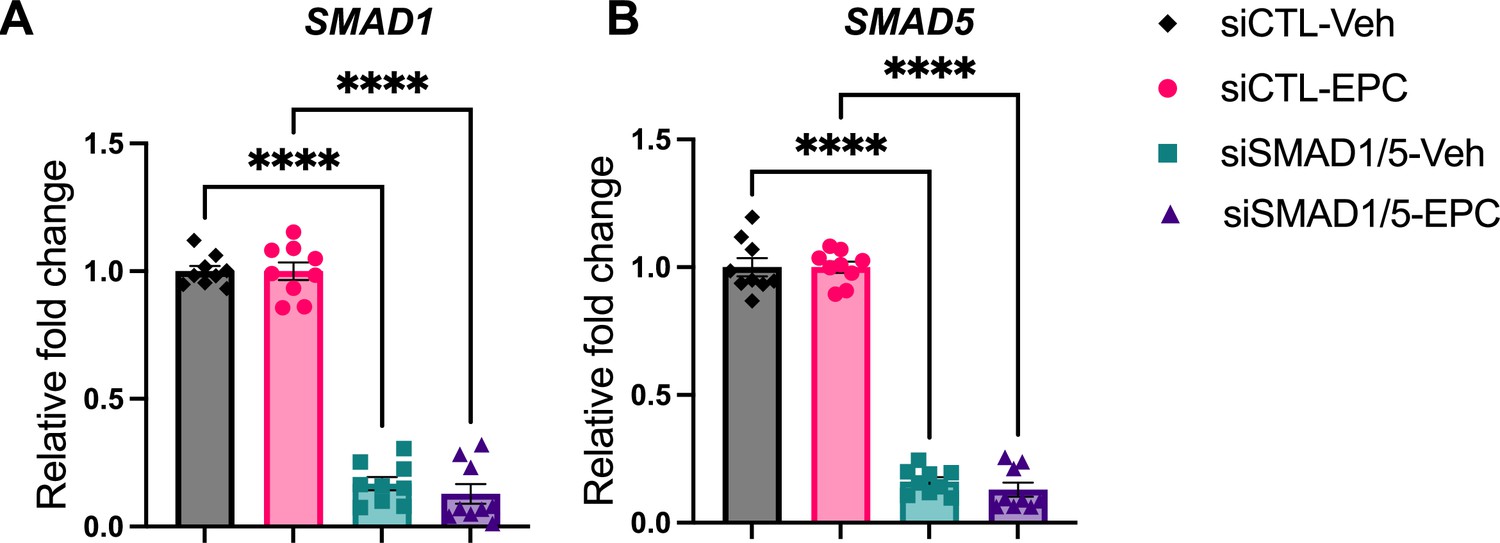
Knockdown effect validation of SMAD1/5 perturbation.
(A, B) RT-qPCR results showing mRNA levels of SMAD1 (A) and SMAD5 (B) after siRNA treatments in both Veh and EPC conditions. Data are normalized to siCTL for visualization. Bar graphs represent average ± SEM of experiments on cells from three different individuals with technical triplicates. Analyzed by a one-way ANOVA with post hoc Tukey test.
Tables
Key resources table
| Reagent type (species) or resource | Designation | Source or reference | Identifiers | Additional information |
|---|---|---|---|---|
| Strain, strain background (Mus musculus) | C57BL/6J × 129S5/SvEvBrd | This paper | C57BL/6J × 129S5/SvEvBrd | Can be obtained by contacting the corresponding authors |
| Transfected construct (Homo sapiens) | siCTL, siSMAD1, siSMAD5 | Dharmacon | Cat# D-001810-10, L-012723-00-0005, L-015791-00-0005 | |
| Biological sample (M. musculus) | Primary uterine tissues | This paper | Freshly isolated from 4.5 dpc mice. Can be obtained by contacting the corresponding authors | |
| Antibody | Anti-HA (rabbit polyclonal) | EpiCypher | Cat# 13-2010, RRID:AB_3094663 | CUT&RUN (1:50) |
| Antibody | Anti-PA (rat monoclonal) | FUJIFILM Wako Pure Chemical Corporation | Cat# NZ-1, RRID:AB_3094664 | CUT&RUN (1:50) IP (10 ug/assay) WB (1:1000) |
| Antibody | Anti-HA (rabbit monoclonal) | Cell Signaling Technology | Cat# 3724, RRID:AB_1549585 | IP (1:50) WB (1:1000) |
| Antibody | Anti-SMAD1 (rabbit monoclonal) | Innovative Research | Cat# 385400, RRID:AB_431530 | WB (1:1000) |
| Antibody | Anti-SMAD5 (rabbit polyclonal) | ProteinTech | Cat# 12167-1-AP, RRID:AB_2286502 | WB (1:1000) |
| Sequence-based reagent | S1-F1 | MilliporeSigma | PCR primers | CAAACCGCAGACCAAGAAGC |
| Sequence-based reagent | S1-R1 | MilliporeSigma | PCR primers | CTTCTCCAGCTCTTCCATGGC |
| Sequence-based reagent | S5-F1 | MilliporeSigma | PCR primers | TGCTTAAGACCTGCATGTGACT |
| Sequence-based reagent | S5-R1 | MilliporeSigma | PCR primers | CATCCACTGCCTTTTCTGCC |
| Sequence-based reagent | GAPDH-F | MilliporeSigma | RT-qPCR primers | ACAACTTTGGTATCGTGGAAGG |
| Sequence-based reagent | GAPDH-R | MilliporeSigma | RT-qPCR primers | GCCATCACGCCACAGTTTC |
| Sequence-based reagent | ACTB-F | MilliporeSigma | RT-qPCR primers | CTGGAACGGTGAAGGTGACA |
| Sequence-based reagent | ACTB-R | MilliporeSigma | RT-qPCR primers | AAGGGACTTCCTGTAACAATGCA |
| Sequence-based reagent | RPL13A-F | MilliporeSigma | RT-qPCR primers | CCTGGAGGAGAAGAGGAAAGAGA |
| Sequence-based reagent | RPL13A-R | MilliporeSigma | RT-qPCR primers | TTGAGGACCTCTGTGTATTTGTCAA |
| Sequence-based reagent | RORB-F | MilliporeSigma | RT-qPCR primers | TGTGCCATCCAGATCACTCACG |
| Sequence-based reagent | RORB-R | MilliporeSigma | RT-qPCR primers | GGTTGAAGGCACGGCACATTCT |
| Sequence-based reagent | SMAD5-F | MilliporeSigma | RT-qPCR primers | CTCGCGAAAAGGAAGCTGTTG |
| Sequence-based reagent | SMAD5-R | MilliporeSigma | RT-qPCR primers | GGGTCAAGTCAGAGGCAGATT |
| Sequence-based reagent | SMAD1-F | MilliporeSigma | RT-qPCR primers | ATGGTGACACAGTTACTCGGT |
| Sequence-based reagent | SMAD1-R | MilliporeSigma | RT-qPCR primers | AGAGACTTCTTGGGTGGAAACA |
| Sequence-based reagent | KLF15-F | MilliporeSigma | RT-qPCR primers | GTGAGAAGCCCTTCGCCTGCA |
| Sequence-based reagent | KLF15-R | MilliporeSigma | RT-qPCR primers | ACAGGACACTGGTACGGCTTCA |
| Commercial assay or kit | PrimePCR SYBR Green Assay: FOXO1, Human | Bio-Rad | qHsaCED0004488 | |
| Commercial assay or kit | PrimePCR SYBR Green Assay: IGFBP1, Human | Bio-Rad | qHsaCID0014281 | |
| Commercial assay or kit | PrimePCR SYBR Green Assay: PRL, Human | Bio-Rad | qHsaCID0015557 |
Additional files
-
Supplementary file 1
Complete list of motif enrichment analysis from the up-targets and down-targets for SMAD1.
- https://cdn.elifesciences.org/articles/91434/elife-91434-supp1-v1.docx
-
Supplementary file 2
Complete list of motif enrichment analysis from the up-targets and down-targets for SMAD5.
- https://cdn.elifesciences.org/articles/91434/elife-91434-supp2-v1.docx
-
Supplementary file 3
Tables with detailed information mentioned in the main text.
(a) DNA sequences used in the study. (b) Direct target genes of SMAD1/5. (c) Results of Gene Ontology enrichment analysis of shared direct target genes of SMAD1/5 from the up-targets. (d) Results of Gene Ontology enrichment analysis of shared direct target genes of SMAD1/5 from the down-targets. (e) Results of KEGG pathway enrichment analysis for shared genes bound by SMAD1, SMAD5, and PR. (f) Results of motif analysis results for shared peaks between SMAD1, SMAD5, and PR. (g) Gene overlapping results of SMAD1/5 and SOX17. (h) Gene overlapping results of SMAD1/5 and NR2F2.
- https://cdn.elifesciences.org/articles/91434/elife-91434-supp3-v1.xlsx
-
MDAR checklist
- https://cdn.elifesciences.org/articles/91434/elife-91434-mdarchecklist1-v1.pdf
Download links
A two-part list of links to download the article, or parts of the article, in various formats.
Downloads (link to download the article as PDF)
Open citations (links to open the citations from this article in various online reference manager services)
Cite this article (links to download the citations from this article in formats compatible with various reference manager tools)
Affinity-tagged SMAD1 and SMAD5 mouse lines reveal transcriptional reprogramming mechanisms during early pregnancy
eLife 12:RP91434.
https://doi.org/10.7554/eLife.91434.4


