Recurrent turnover of senescent cells during regeneration of a complex structure
- University College London, United Kingdom
Figures
Figure 1

Characterisation of cellular senescence in salamander cells.
(A) Protocol for the induction of cellular senescence in salamander cells. A1 cells are induced to undergo cellular senescence upon UV irradiation combined with p53 stabilisation (1 µM nutlin3a). SA-β-gal positive cells (blue) appear at 7 days post-induction (dpi) and represent 80% of the total population by 12 dpi. (B) SA-β-gal staining of UV (10J/m2) irradiated cells at 12 dpi in the presence of the indicated compounds. (C–F) Quantification of SA-β-gal (C), BrdU (E), DHR123 (ROS) and γH2AX foci (F) positive cells, or gadd45 expression relative to ef1-α (D) at 7dpi following the indicated UV doses/treatments (n = 4). (G) SA-β-gal/EdU co-staining following subculture of proliferating or senescent cells in growth medium supplemented with 5 µM EdU. No SA-β-gal+/EdU+ cells are found, indicating cell cycle withdrawal of SA-β-gal+ cells (n = 5). Scale bar: 50 µM. (H) The cells identified by the Sa-β-gal staining exhibit other hallmarks of senescence such as persistent γH2AX foci (γH2AX immunostaining), high levels of ROS (DHR123), and extended mitochondrial (Mitotracker) and lysosomal (Lysotracker) networks. Lamin B1 is present at normal levels in senescent cells (representative images, n = 4). Scale bar: 50 µM. (I) Senescence-associated secretory phenotype analysis reveals similarities between salamander and mammalian senescent cells. Conditioned medium (SN) and whole cell extracts from A1 control (A1) or senescent (Sen) cells were analysed by cytokine/protease antibody arrays. The proteins whose levels vary significantly (p < 0.05) relative to A1 whole cell extracts are represented in the heat map. Asterisks indicate SASP factors upregulated in both salamander and mammalian senescent cells.
Figure 2 with 3 supplements
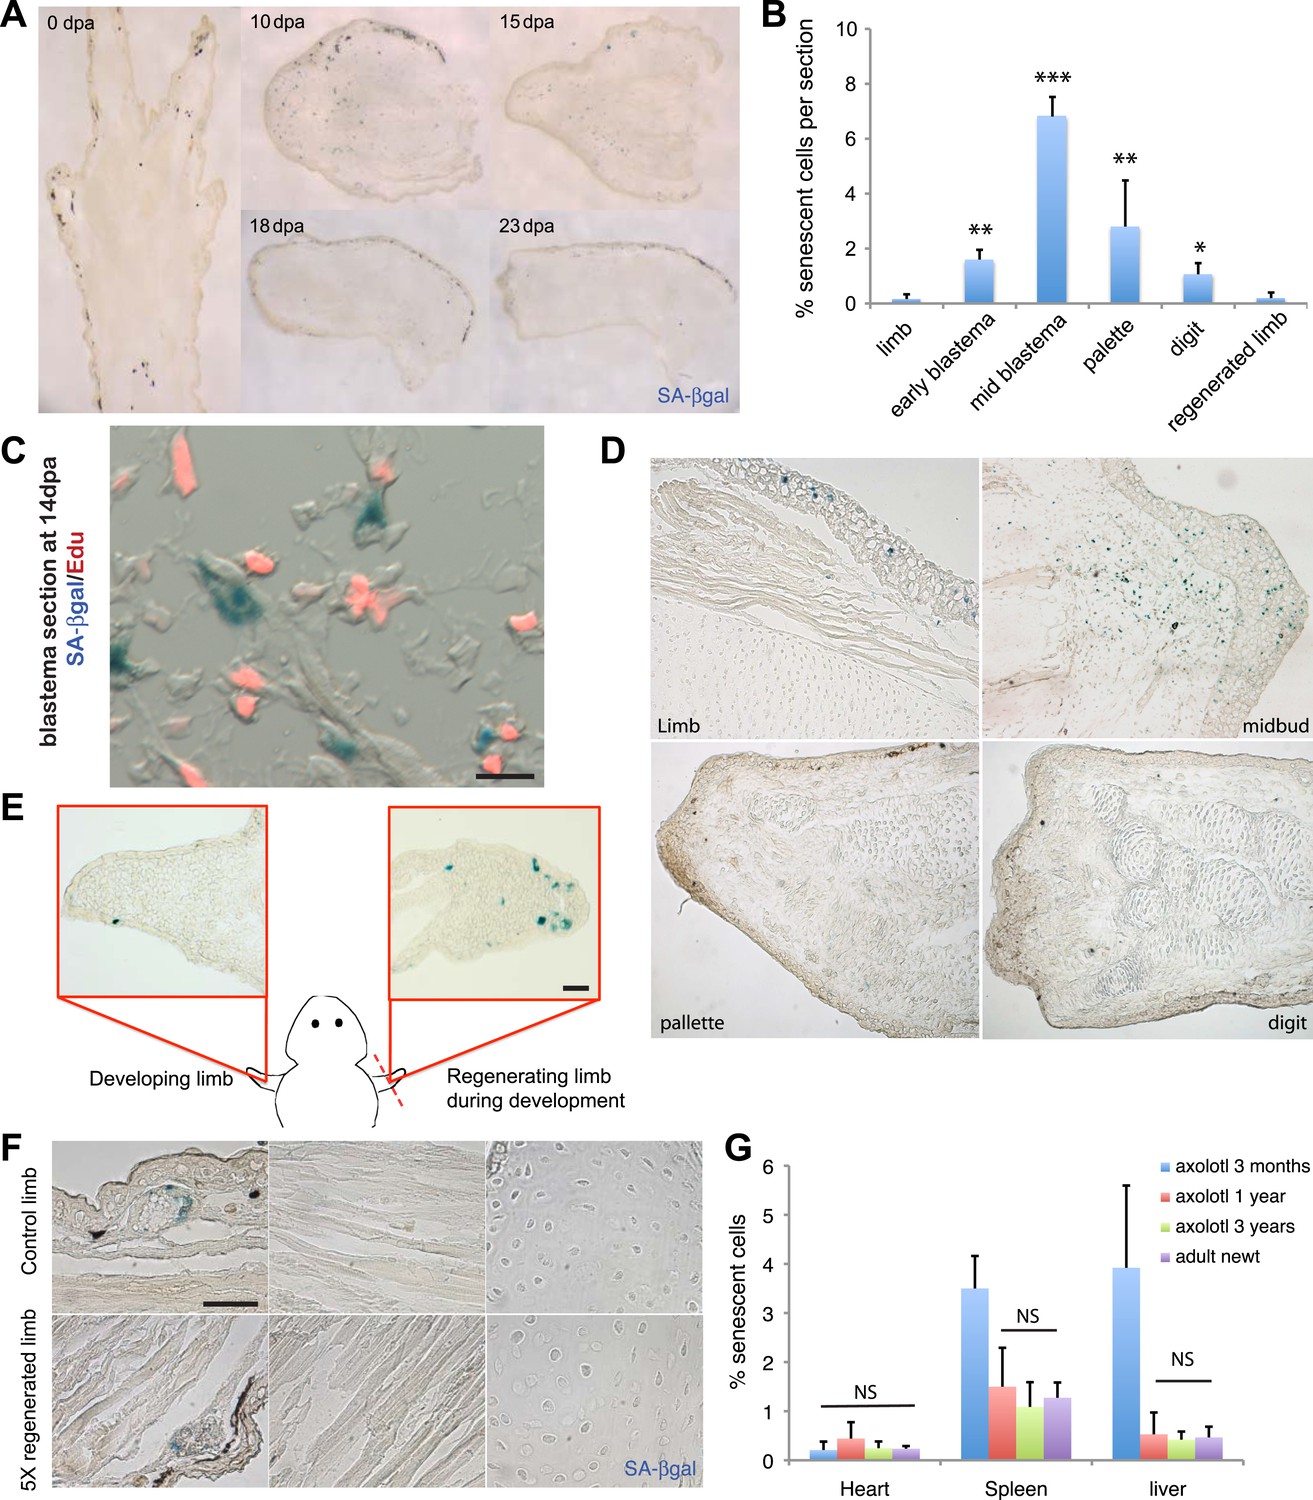
Induction of cellular senescence during salamander limb regeneration.
(A) Induction and disappearance of senescent cells during salamander limb regeneration as indicated by SA-β-gal staining of newt tissues. dpa: days post amputation. (B) Quantification of senescent cells during key stages of limb regeneration following SA-β-gal/Hoescht staining (n = 8; *p < 0.05, **p < 0.01, ***p < 0.005). (C) Representative image of SA-β-gal/EdU co-staining of newt blastemas at 14 dpa, 48 hr after EdU administration. No SA-β-gal+/EdU+ cells are found (n = 6). Scale bar: 40 µM. (D) Induction and disappearance of senescent cells during axolotl limb regeneration as indicated by SA-β-gal staining (blue). dpa: days post amputation. Scale bar: 200 µm. (E) Cellular senescence is specifically induced during salamander limb regeneration, but not limb development. Representative SA-β-gal staining (n = 5) of a developing limb (left) and its contralateral counterpart following amputation and subsequent regeneration of the limb bud (right). Scale bar: 100 µm. (F) Repetitive amputation rounds do not lead to an increase in cellular senescence in regenerated limbs. Representative images SA-β-gal staining in a newt limb following 5 regeneration rounds compared to its contralateral intact limb (n = 6). Scale bar: 100 µm. (G) The percentage of senescent cells does not increase with ageing in salamander tissues. Quantification of senescent cells following SA-β-gal/Hoescht staining (n = 6). The percentage of senescent cells in tissues of mature axolotls (1 and 3 year-old) and adult newts is not significantly different (NS).
Figure 2—figure supplement 1
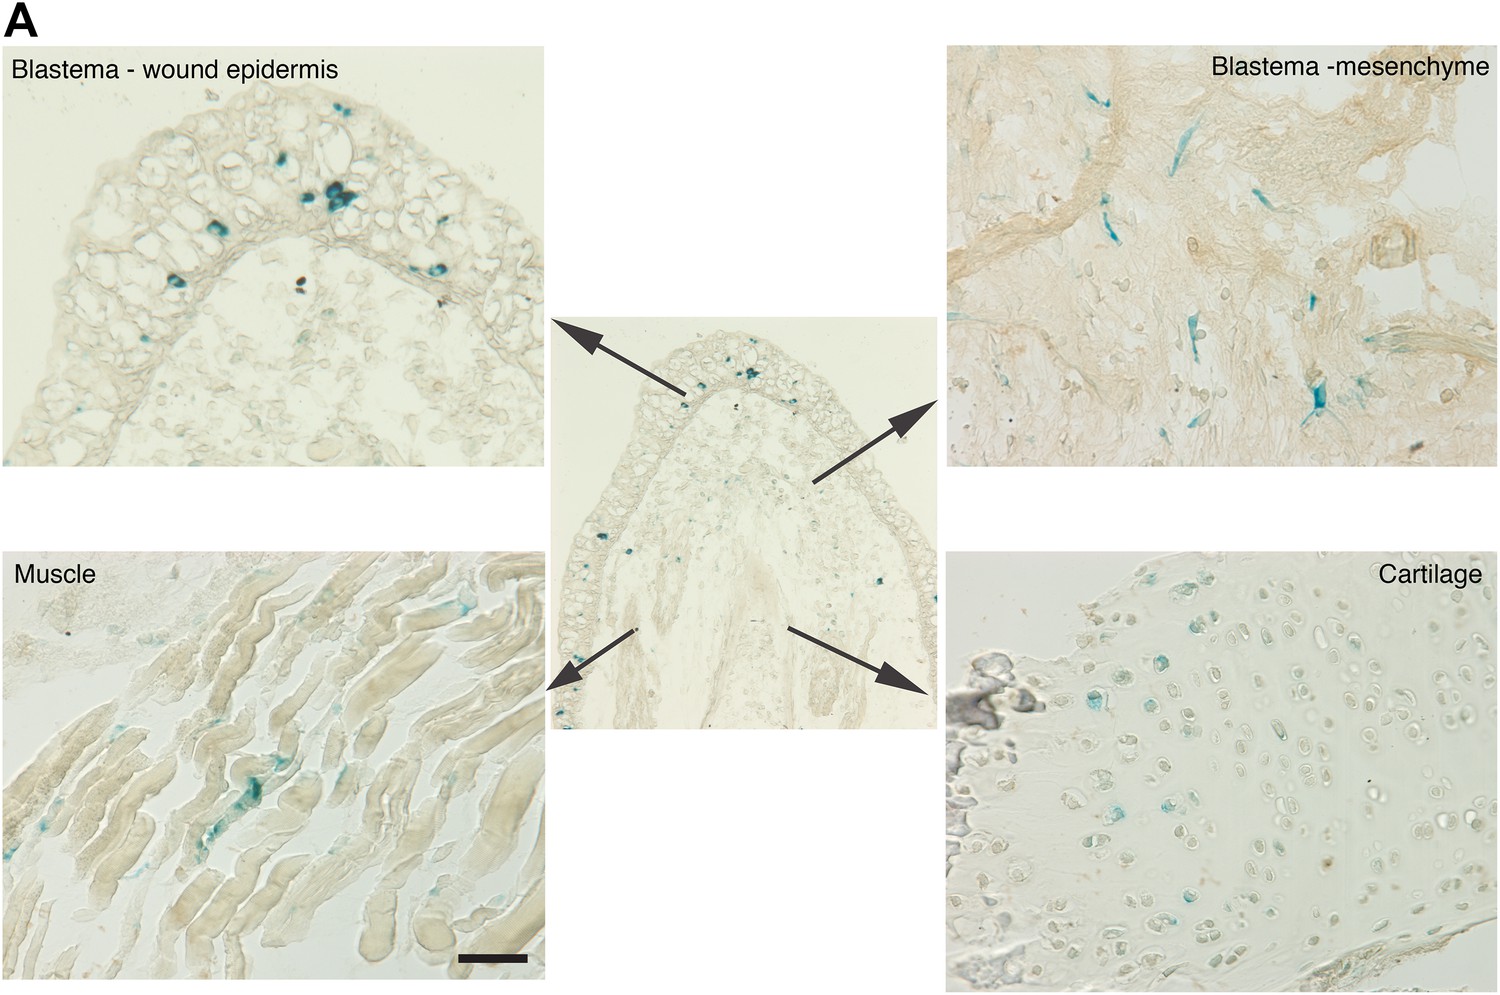
Distribution of senescent cells during limb regeneration.
(A) Representative images of different structures of a regenerating limb (wound epidermis and blastema mesenchyme, muscle and cartilage) following SA-β-gal staining. Scale bar: 400 µM.
Figure 2—figure supplement 2

Senescence is induced specifically during regeneration but not development of the salamander limb.
(A, B) Representative SA-β-gal staining of axolotl limb sections during different stages of development (A) or regeneration during development (B). Scale bar: 200 µM.
Figure 2—figure supplement 3
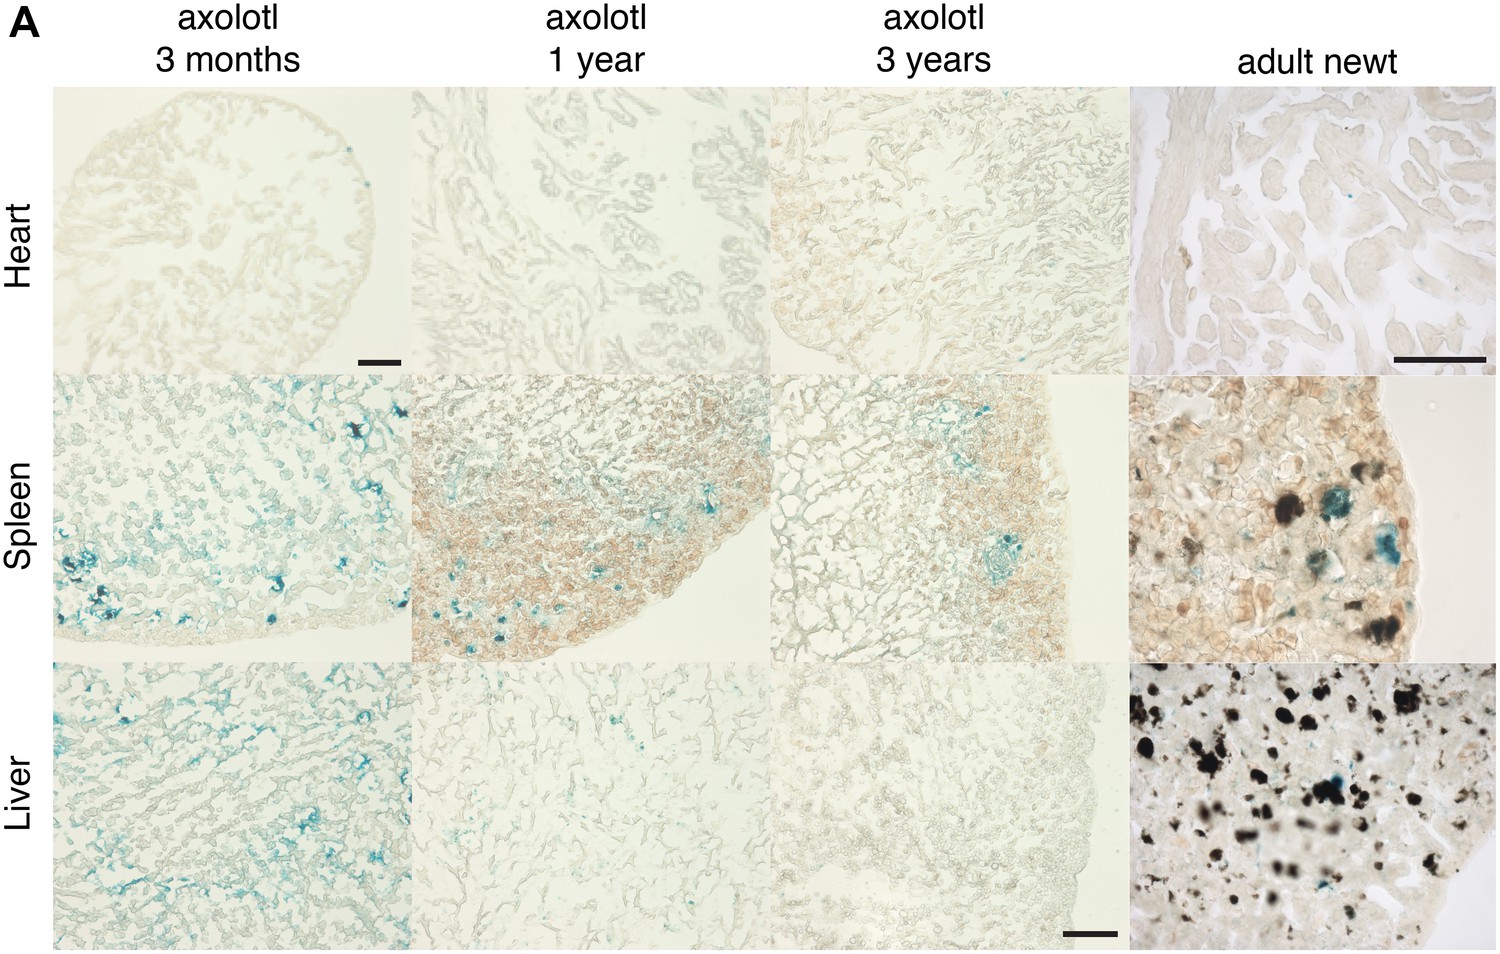
Cellular senescence does not increase with ageing in salamanders.
(A) Representative images of different axolotl tissues upon ageing following SA-β-gal staining (blue). Scale bar: 200 µm.
Figure 3 with 1 supplement
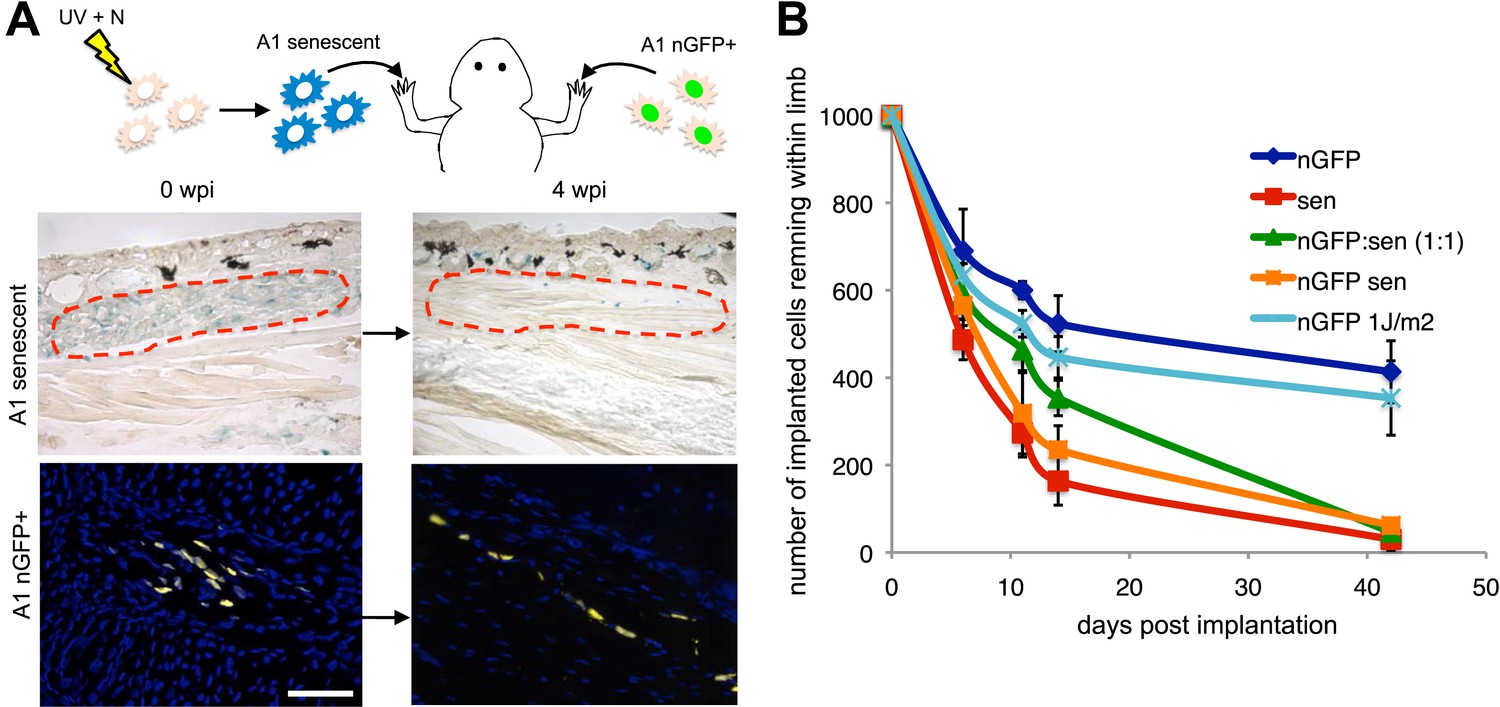
Active mechanisms of senescent cell clearance operate in salamander tissues.
(A) Schematic representation of the implantation experiment. 1000 UV-induced senescent or nGFP+ non-senescent cells were implanted within the left or right newt forelimbs, respectively, and analysed at different weeks post-implantation (wpi) by SA-b-gal staining or immunofluorescence (below). Note the complete clearance of senescent cells at 4wpi. Scale bar: 100 µm. (B) Dynamics of senescent cell clearance within adult newt limbs as described in A as shown by a quantification of total cells remaining within entire limbs at different days post implantation (dpi, n = 12). In addition to senescent and nGFP+ control cells, the dynamic of cell clearance was evaluated following implantation of nGFP+ senescent cells, nGFP+ UV-irradiated (1J/m2) cells and a 1:1 mixture of nGFP+ control and senescent cells (nGFP:sen).
Figure 3—figure supplement 1
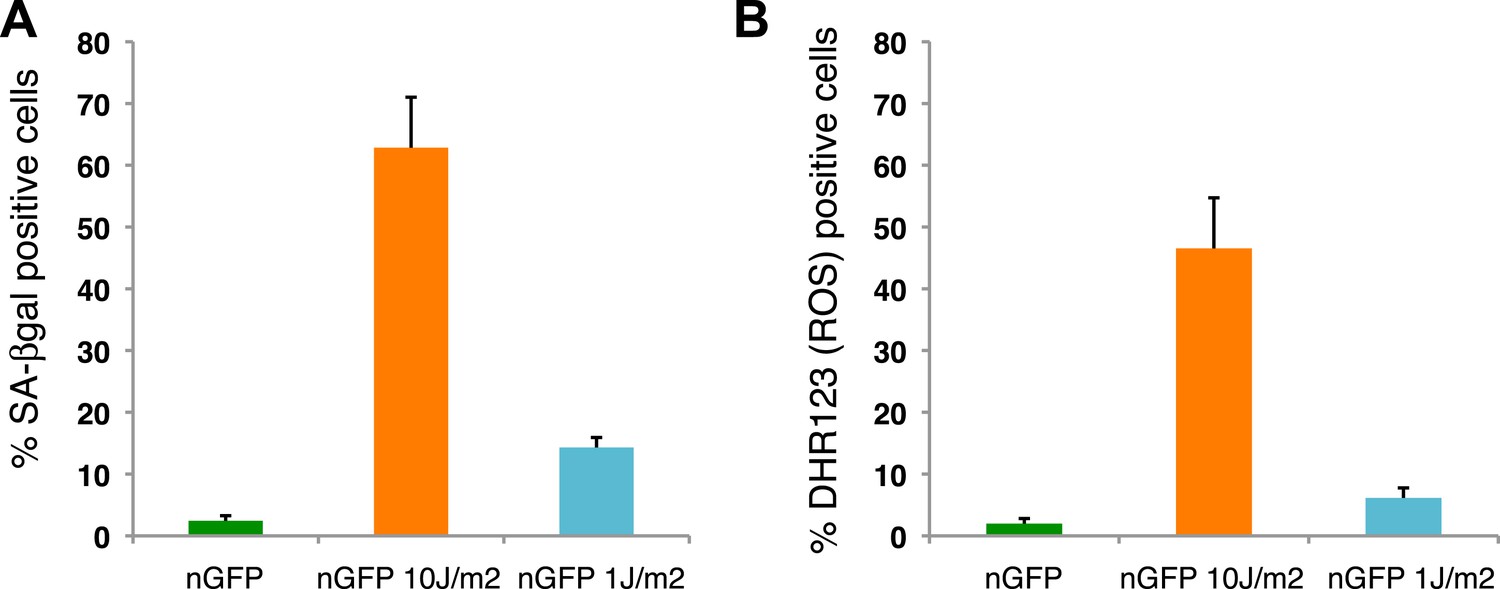
Distribution of senescent cells during limb regeneration.
(A) Quantification of SA-β-gal positive cells after staining of control and UV (10J/m2 or 1J/m2) irradiated nGFP+ cells (12 days post irradiation). (B) Quantification of DHR123 (ROS) positive cells after staining of control and UV (10J/m2 or 1J/m2) irradiated nGFP+ cells (12 days post irradiation).
Figure 4

A senescence bystander effect in salamander cells and tissues.
(A) Schematic representation: implantation of a 1:1 mixture of senescent and non-senescent (nGFP+) salamander cells within limb tissues. Scale bar: 50 µM. (B) Both senescent and non-senescent cell populations are cleared from newt limb tissues following implantation. Scale bar: 100 µM. (C) Co-culturing of senescent and non-senescent (GFP+) cells promotes cellular senescence in the non-senescent population -circled areas-. Scale bar: 50 µM. (D) Incubation of proliferating salamander cells with growth media derived from senescent (blue) but not normal (red) cells induces cellular senescence. Scale bar: 100 µM. (E) Co-implantation of normal and senescent cells leads to the induction of senescence in the non-senescent (GFP+) cell population -circled areas-. (F) Percentage of SAβgal+ nGFP+ cells when co-implanted with (nGFP-) senescent or normal cells at different times post implantation. (n = 3, **p < 0.01).
Figure 5
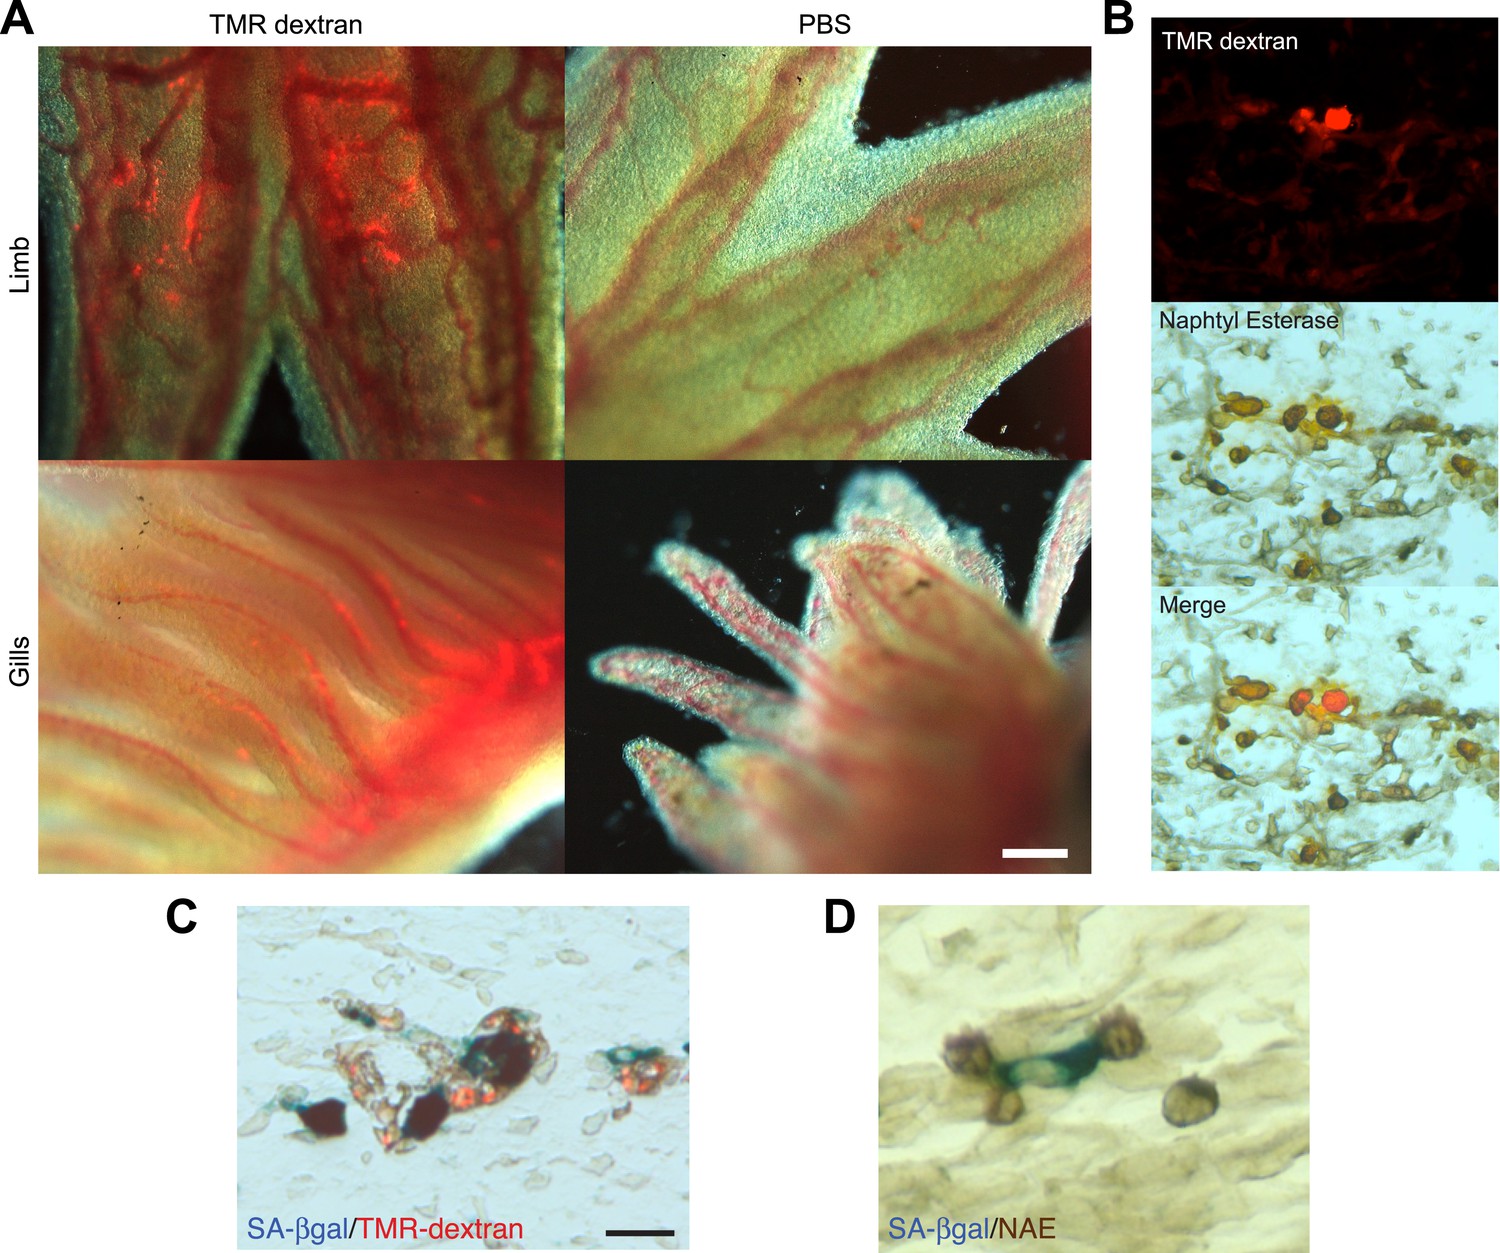
Macrophages are recruited to senescent cells within salamander tissues.
(A) Representative images of axolotl limbs and gills, 24 hr after i.v. injection of TMR-dextran -left panels- or PBS -right panels-. Scale bar: 200 µM. (B) TMR-dextran incorporating cells stain positive for the macrophage marker α-napthtyl esterase (NAE). (C, D) Macrophages (TMR+ -red- in A; NAE+, brown in B) are recruited to sites of senescent cells (Sa-β-gal+, blue) within regenerating limb tissues. Scale bar: µm.
Figure 6
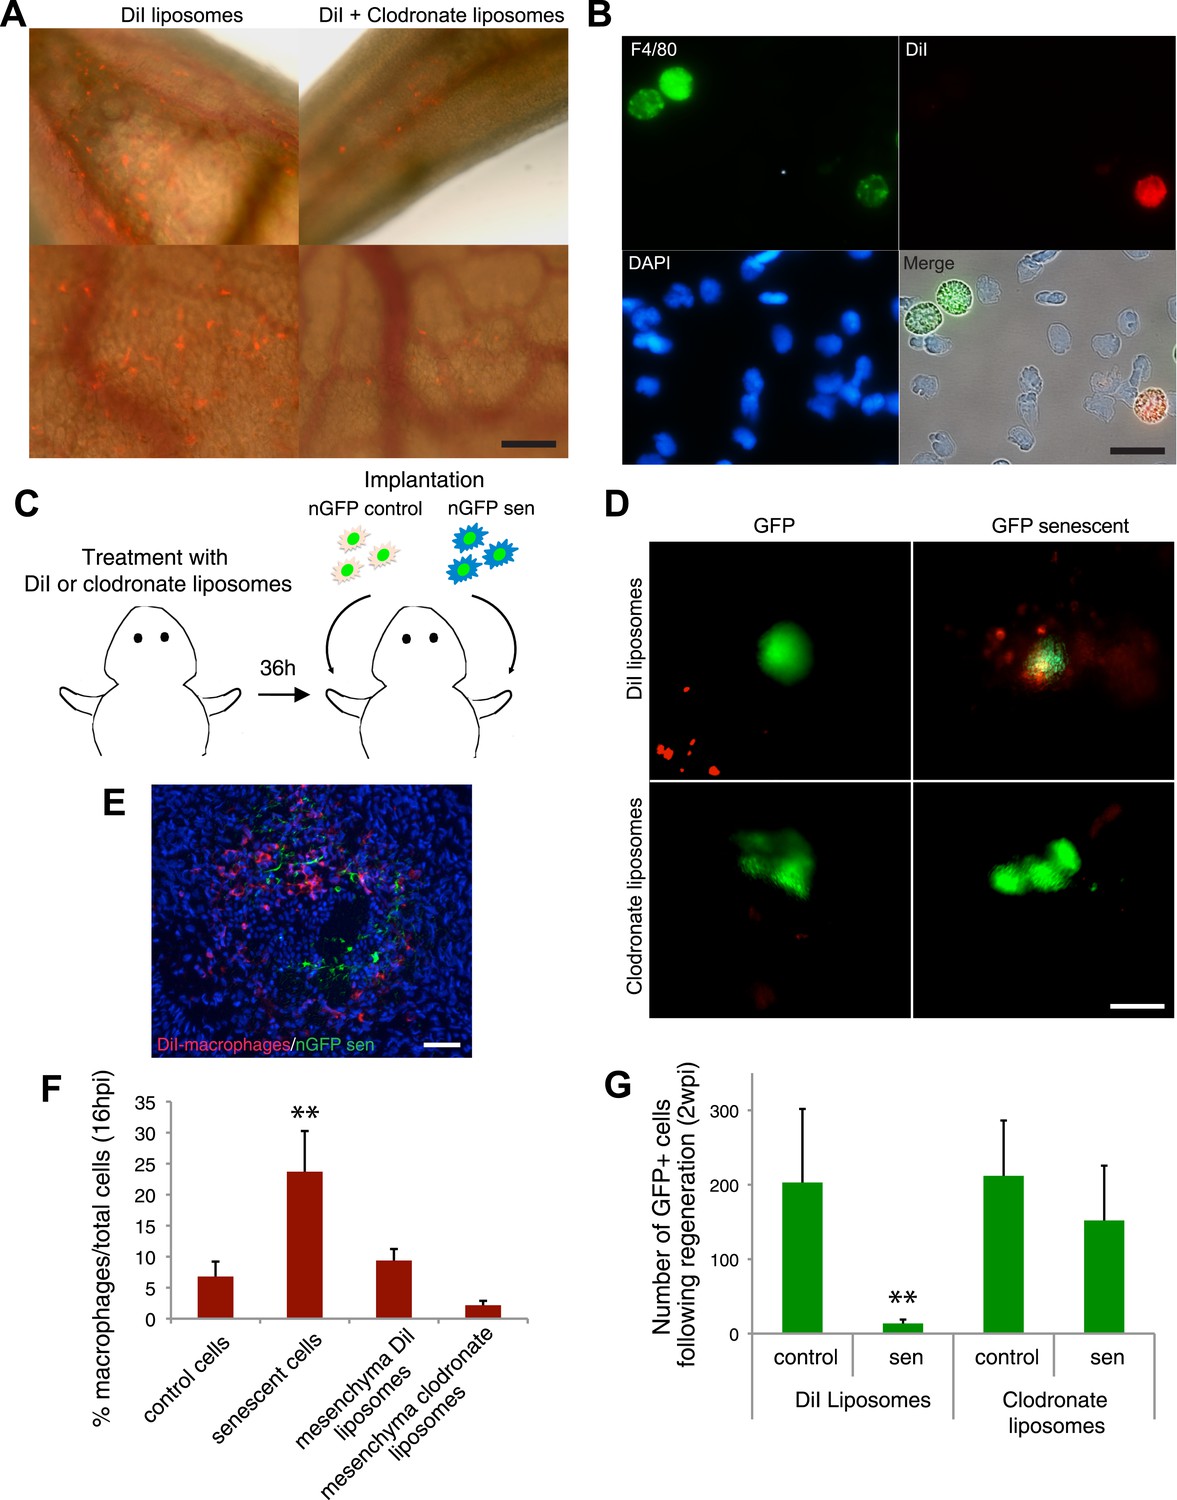
Macrophages mediate the efficient clearance of senescent cells during salamander limb regeneration.
(A) A clodronate-dependent system for effective macrophage depletion in salamanders. Representative images of axolotl limb tissues 36 hr post i.v. injection with fluorescent DiI-liposomes (red) or DiI + clodronate-liposomes. Scale bar: 1000 µm. (B) DiI-liposomes are incorporated specifically by macrophages. Blood cells were extracted from treated animals and stained with antibodies against the specific macrophage marker F4/80. Scale bar: 50 µM. (C) Schematic representation of the implantation experiment. Axolotls with limbs at the midbud stage of regeneration were injected i.v. with either DiI-liposomes or DiI + clodronate(clodro)- liposomes, 36 hr prior to implantation of normal or senescent nGFP+ cells into contralateral regenerating limbs. Liposome treatments were maintained for 2 weeks. (D) Macrophage (DiI, red) recruitment to areas of senescent cells 12 hr following implantation of normal and senescent GFP+ cells within regenerating axolotl limbs. Scale bar: 1000 µm. (E) DiI-labelled macrophages (red) are recruited to sites of implanted nGFP+ senescent cells (green) within regenerating limbs at 16 hs post implantation. Scale bar: 100 µm. Note that in the DiI-liposome treated animals macrophages are recruited to sited of senescent but not normal cells. (F) Quantification of macrophage (DiI-labelled) recruitment to implantation sites at 16 hpi. Note macrophage depletion induced by clodronate-liposome treatment. (G) Clearance of senescent cells is impaired upon macrophage depletion. Quantification of GFP+ cells after 2wpi in DiI-liposome or clodronate-liposome treated animals.
Figure 7
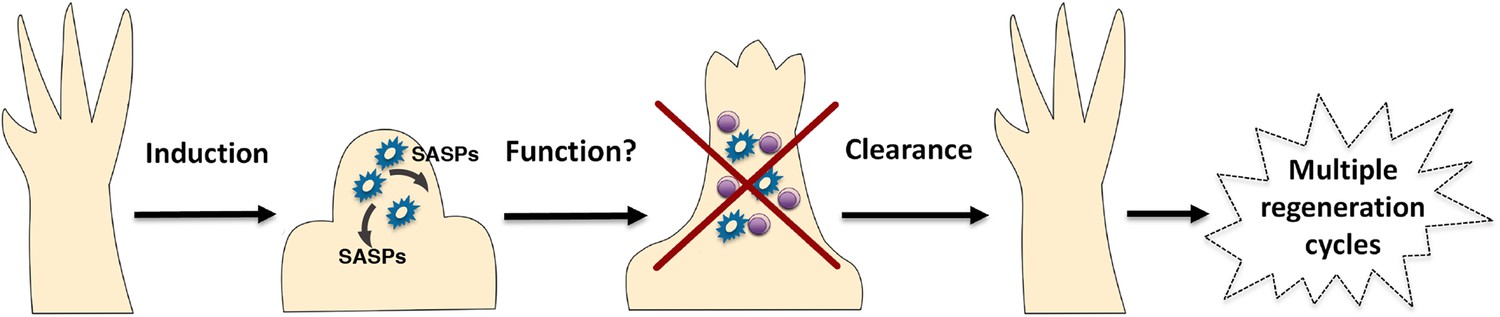
A simplified model for the induction and clearance of senescent cells during salamander regeneration.
Salamander cells are induced (by as yet unidentified stimuli) during regeneration and accumulate within the blastema. They produce a range of secreted molecules (SASPs) which affect their microenvironment and could contribute to different aspects of the regeneration process such as matrix remodelling, vascularisation, growth and patterning. As regeneration proceeds to more advanced stages, senescent cells are cleared by an efficient mechanism of macrophage dependent immunesurveillance, which results in a regenerated limb devoid of senescent cells. This allows for the possibility of multiple rounds of regeneration through lifespan as well as avoiding the disadvantages of senescent cell accummulation.
Download links
A two-part list of links to download the article, or parts of the article, in various formats.
Downloads (link to download the article as PDF)
Open citations (links to open the citations from this article in various online reference manager services)
Cite this article (links to download the citations from this article in formats compatible with various reference manager tools)
Recurrent turnover of senescent cells during regeneration of a complex structure
eLife 4:e05505.
https://doi.org/10.7554/eLife.05505


