Fibroblastic reticular cell-derived lysophosphatidic acid regulates confined intranodal T-cell motility
- Osaka University Graduate School of Medicine, Japan
- Osaka University, Japan
- University of Turku, Finland
- Keio University School of Medicine, Japan
- JST Precursory Research for Embryonic Science and Technology project, Japan
- Akita University, Japan
- Kansai University of Health Sciences, Japan
- Tohoku University, Japan
- Kantonal Hospital St. Gallen, Switzerland
- Core Research for Evolutional Science and Technology project, Japan
Figures
Figure 1

FRCs and vascular ECs express autotaxin in an LTβR-signaling-dependent manner.
(A) Representative dot plot of the CD45- stromal cells in LNs. CD45- cells were divided by CD31 and gp38 expression into FRCs (gp38+ CD31-), lymphatic endothelial cells (LECs; gp38+ CD31+), blood endothelial cells (BEC; gp38-CD31+), and double-negative cells. Numbers indicate the frequency of cells in each gate. (B) Enpp2/Autotaxin expression in stromal LN fractions, analyzed by quantitative RT-PCR. (C) ATX expression examined by immunoelectron microscopy; arrow indicates positive signals in an FRC. C: collagen fibers; L: lymphocytes. Bar, 1 μm. (D) Enpp2 in CD45- EYFP+ cells in LNs and the spleen of Ccl19-Cre x R26-EYFP mice. (E) Effect of LTβR signaling on Enpp2 expression in FRCs and BECs. LTβR signaling was blocked by injecting 100 μg of recombinant LTβR-Fc or an isotype control into adult mice intraperitoneally weekly for 4 weeks. The FRCs and BECs were then sorted, and the indicated gene expressions were analyzed by quantitative PCR. Data are representative of three (A, B, D) or two (C, E) independent experiments (n = 3 per group). Differences between groups were evaluated by Student’s t-test. *P < 0.05; **P < 0.005; ***P < 0.0005.
Figure 2 with 1 supplement
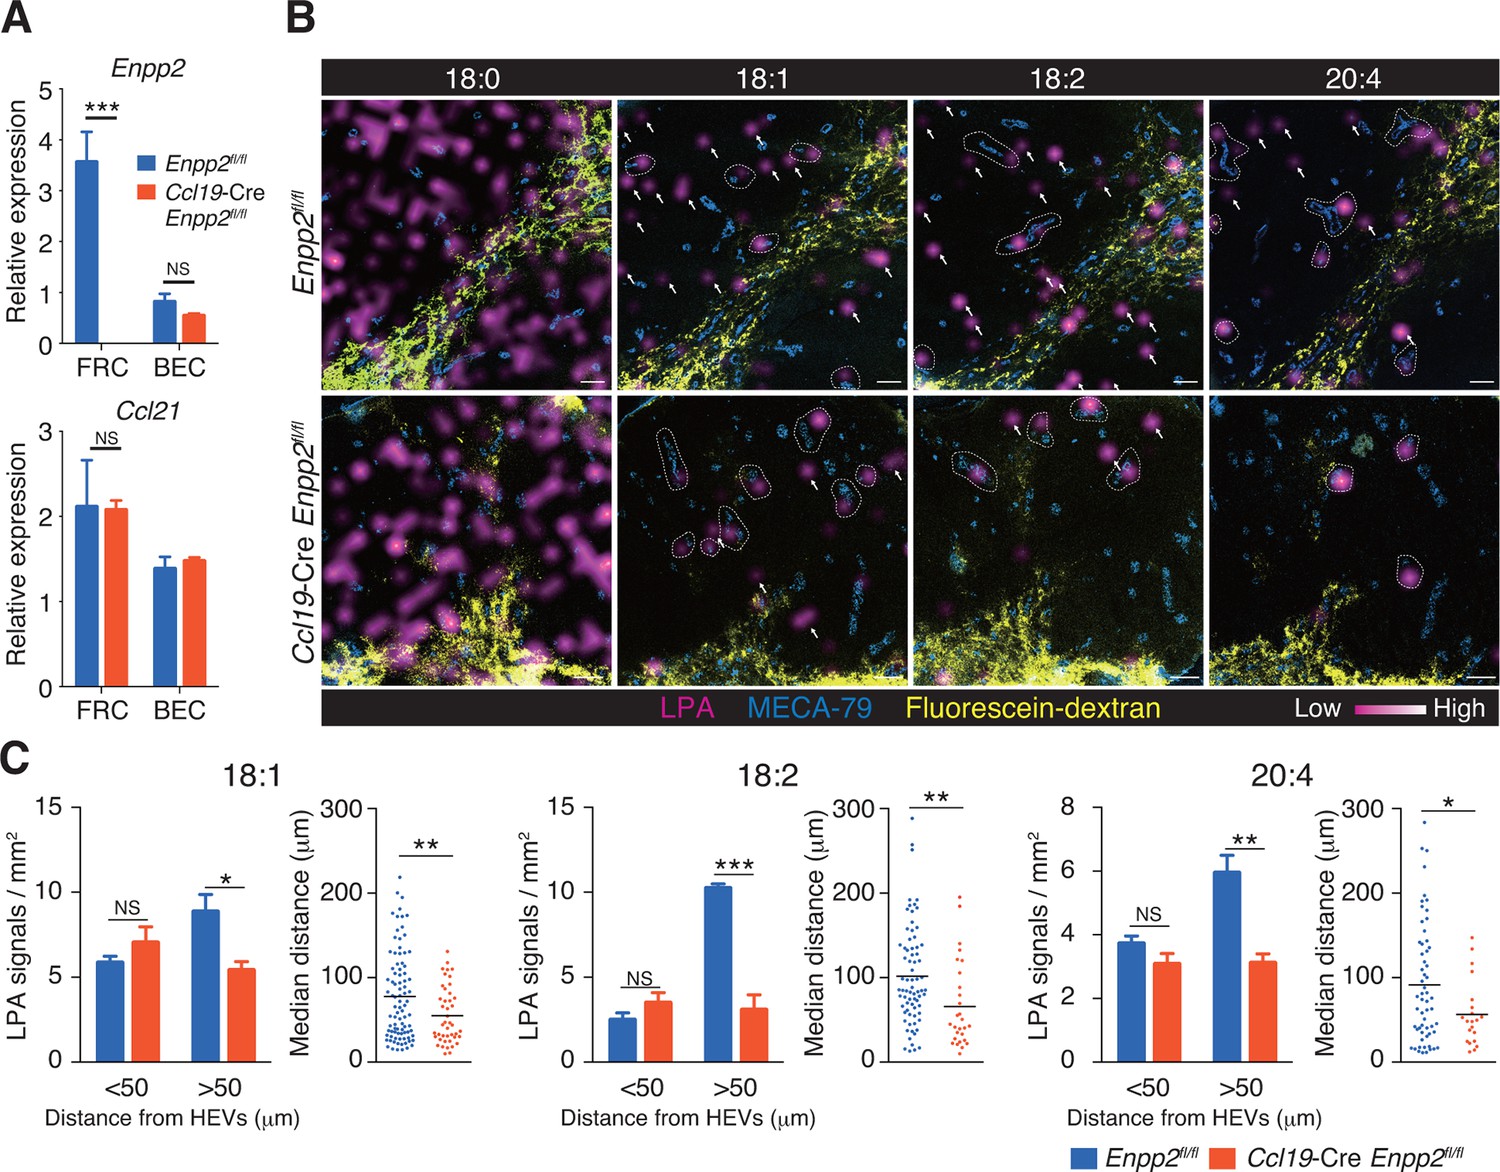
Multiple LPA species are produced in the LN parenchyma by FRCs.
(A) Enpp2 and Ccl21 mRNA expression in LN stromal cells in Ccl19-Cre Enpp2fl/fl or Enpp2fl/fl mice. See also analysis of stromal cell populations in those mice in Figure 2—figure supplement 1. (B) LPA-species distribution in the LNs of Ccl19-Cre Enpp2fl/fl and Enpp2fl/fl mice. Fluorescein-conjugated dextran (pseudocolored in yellow) was injected into the footpads to visualize the lymphatics, and draining LNs were collected 10 min after the injection. Signals corresponding to LPA (18:0) (ion transition from m/z 437 to 153), LPA (18:1) (from m/z 435 to 153), LPA (18:2) (from m/z 433 to 153), and LPA (20:4) (from m/z 457 to 153) were visualized by IMS analysis (magenta) and overlapped with MECA-79 staining (blue) on LN serial sections. LPA signals located within 50 μm of an HEV are circled by dotted lines and signals more than 50 μm away from an HEV are indicated by arrows for each of the LPA (18:1), LPA (18:2), and LPA (20:4) species. (C) The frequency of LPA signals by distance from an HEV, and the median distance from an HEV. Data are representative of three (A) or two (B, C) independent experiments. Differences between groups were evaluated by Student’s t-test. *P < 0.05, **P < 0.005, ***P < 0.0005. Bars, 100 μm.
Figure 2—figure supplement 1
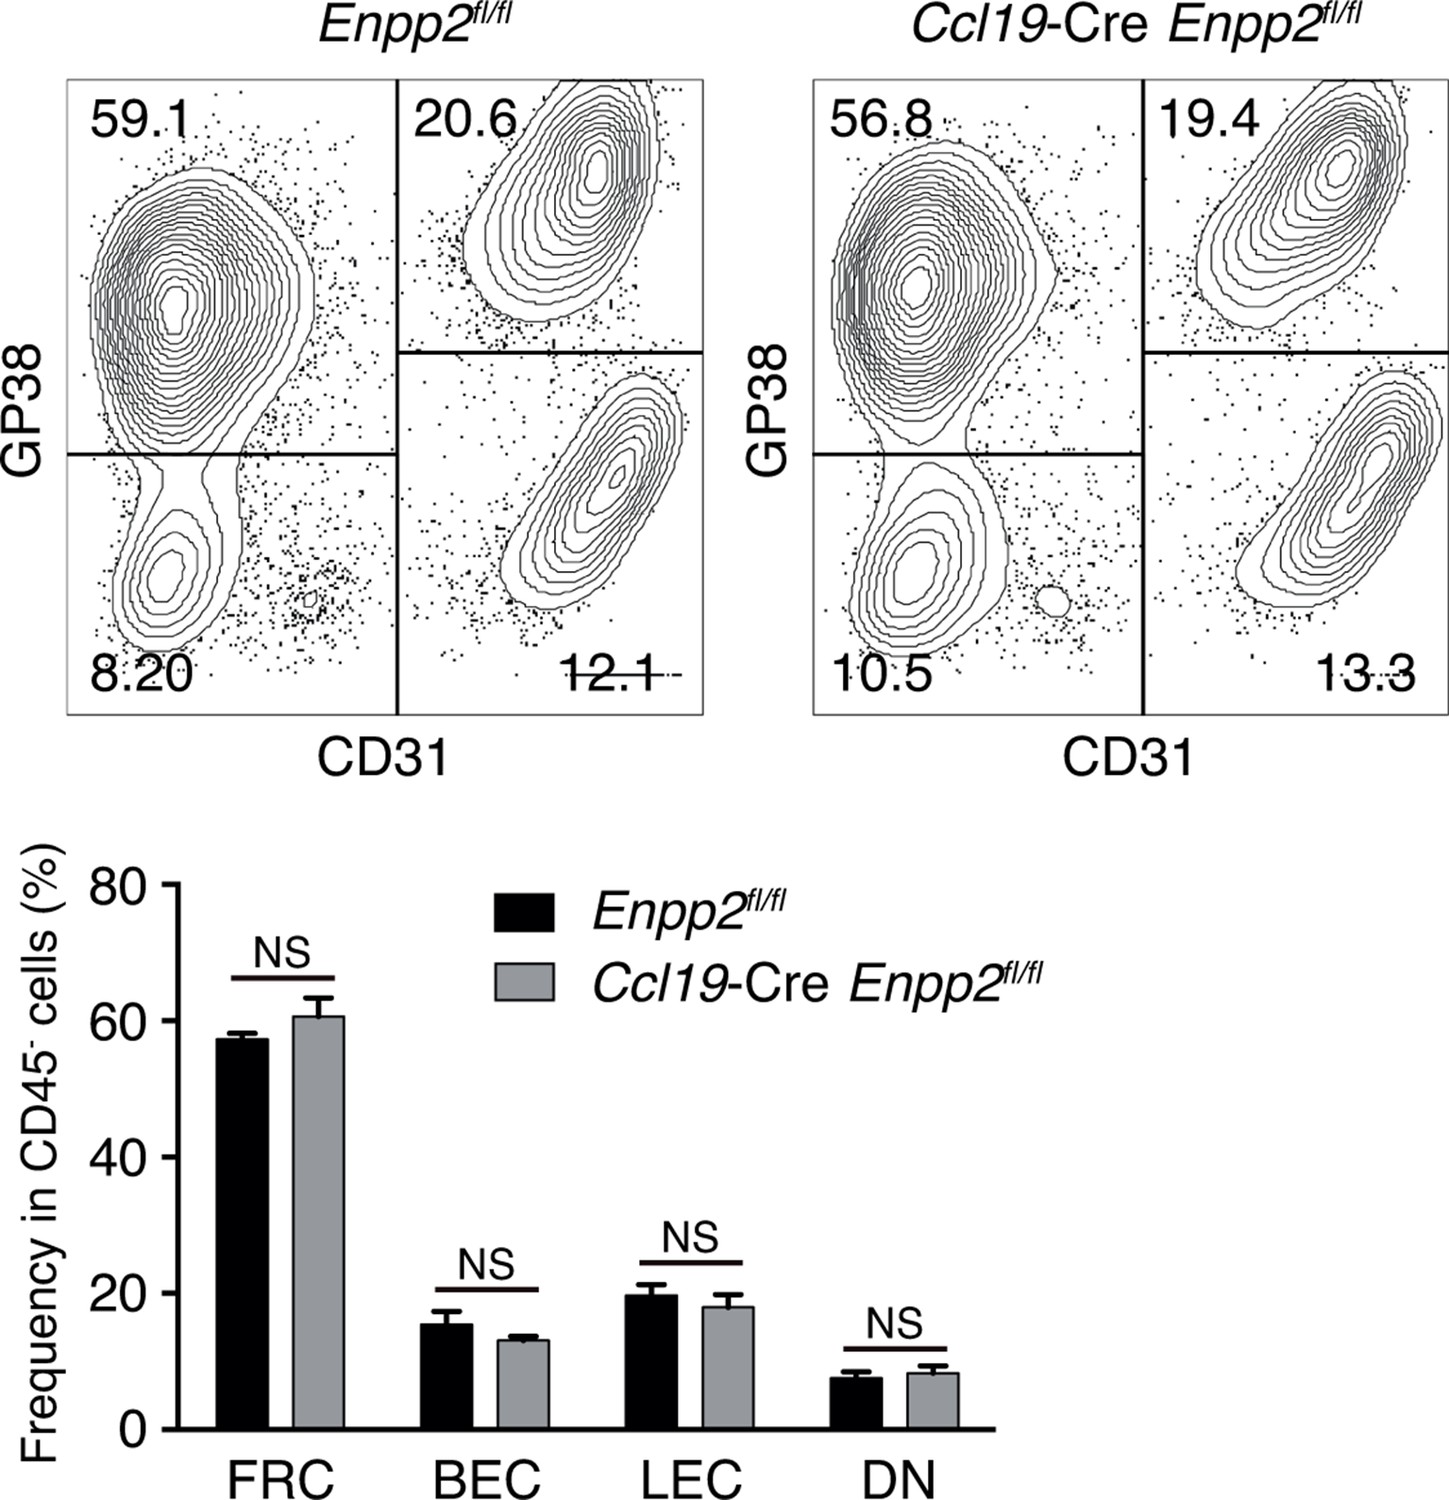
Stromal cell populations in Enpp2fl/fl and Ccl19-Cre Enpp2fl/fl mice.
The frequency of FRCs, BECs, LECs and double negative cells in Enpp2fl/fl and Ccl19-Cre Enpp2fl/fl mice was analyzed by flow cytometry (n = 3 per group).
Figure 3 with 2 supplements
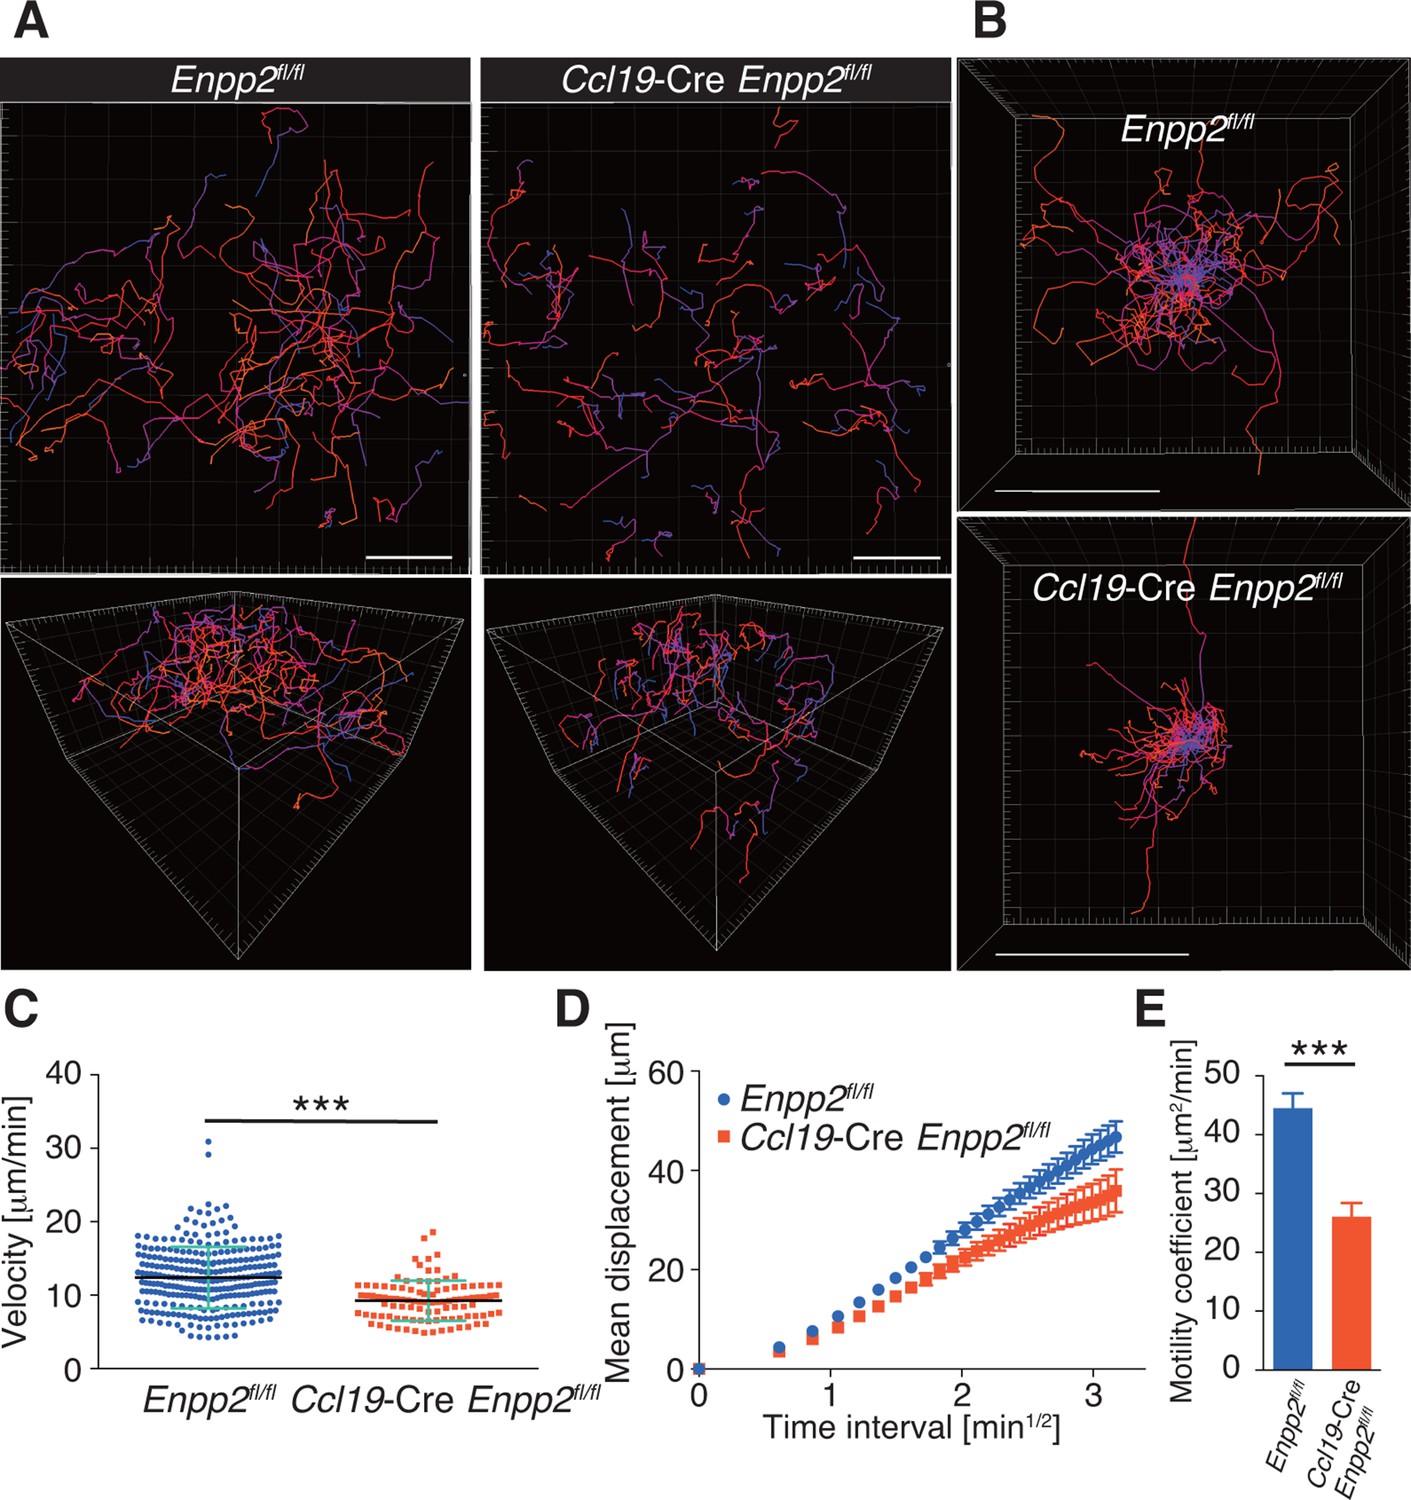
FRC-specific ATX ablation attenuates intranodal T-cell migration.
Intranodal T-cell migration in Enpp2fl/fl mice and Ccl19-Cre Enpp2fl/fl mice, analyzed by intravital two-photon microscopy. Intranodal T-cell migration in the PLN was analyzed 15–25 hr after injecting eGFP-expressing CD4+ T cells into Ccl19-Cre Enpp2fl/fl or Enpp2fl/fl mice. (A) Automated tracking of CD4+ T-cell migration (upper panels), and images rotated to display the z-dimension of the volume (lower). Trajectories of 50 randomly chosen cells are displayed as color-coded tracks to show movement over time, from blue (start of imaging) to red (end of imaging). (B) Translated tracking with a common origin. (C-E) Analysis of T cell motility. See also Figure 3—figure supplement 2. (C) Average cell velocity. Each dot represents the average velocity of an individual cell, and bars indicate the median. Pooled data are shown in Figure 3—figure supplement 1. (D) Mean displacement plot. (E) Motility coefficients, calculated from the slope of the regression line of the mean displacement plot as x2/6t, where x is the displacement at time t. Data represent the mean ± SD (C) or mean ± SEM (D, E). Data are representative of three independent experiments. Differences between groups were evaluated by Student’s t-test. *P < 0.05, **P < 0.005, ***P < 0.0005. Bars, 100 μm.
Figure 3—figure supplement 1
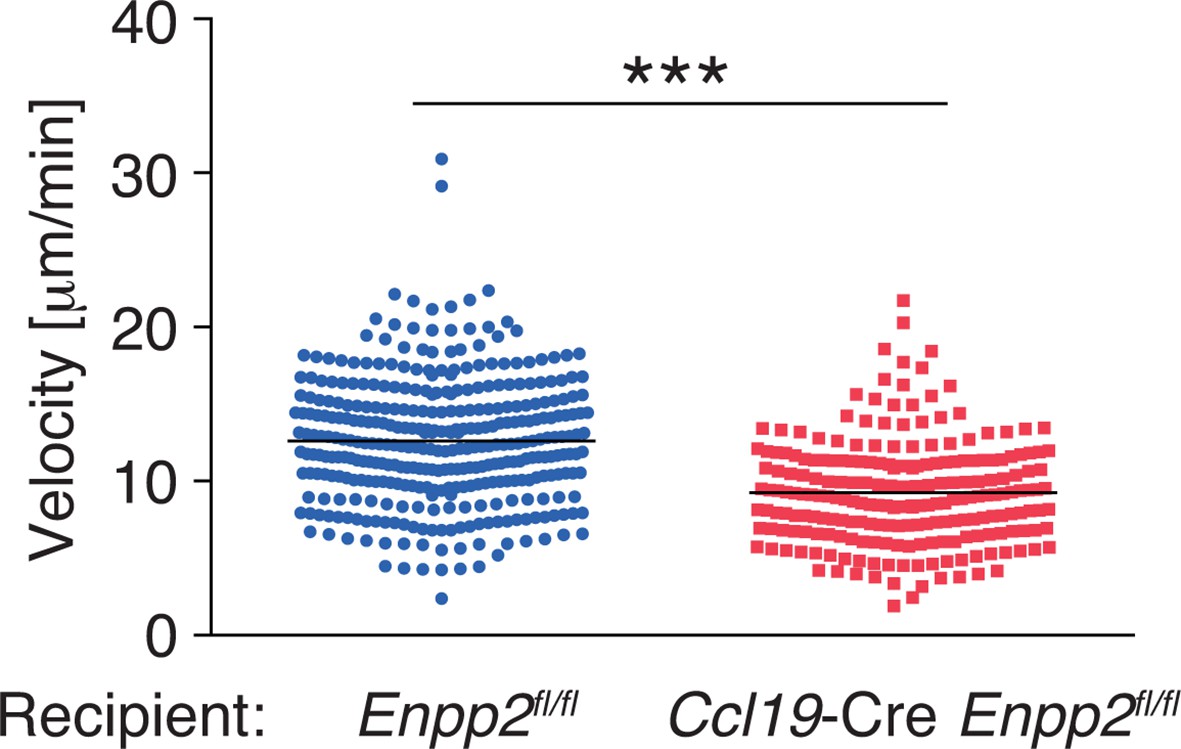
Pooled data of WT CD4+ T-cell velocity in Enpp2fl/fl and Ccl19-Cre Enpp2fl/fl LNs.
WT CD4+ T cells were injected into Enpp2fl/fl or Ccl19-Cre Enpp2fl/fl mice, and their intranodal migration was analyzed by by two-photon microscopy. The data were pooled from two independent experiments. Differences between groups were evaluated by Student’s t-test. ***P < 0.0005.
Figure 3—figure supplement 2
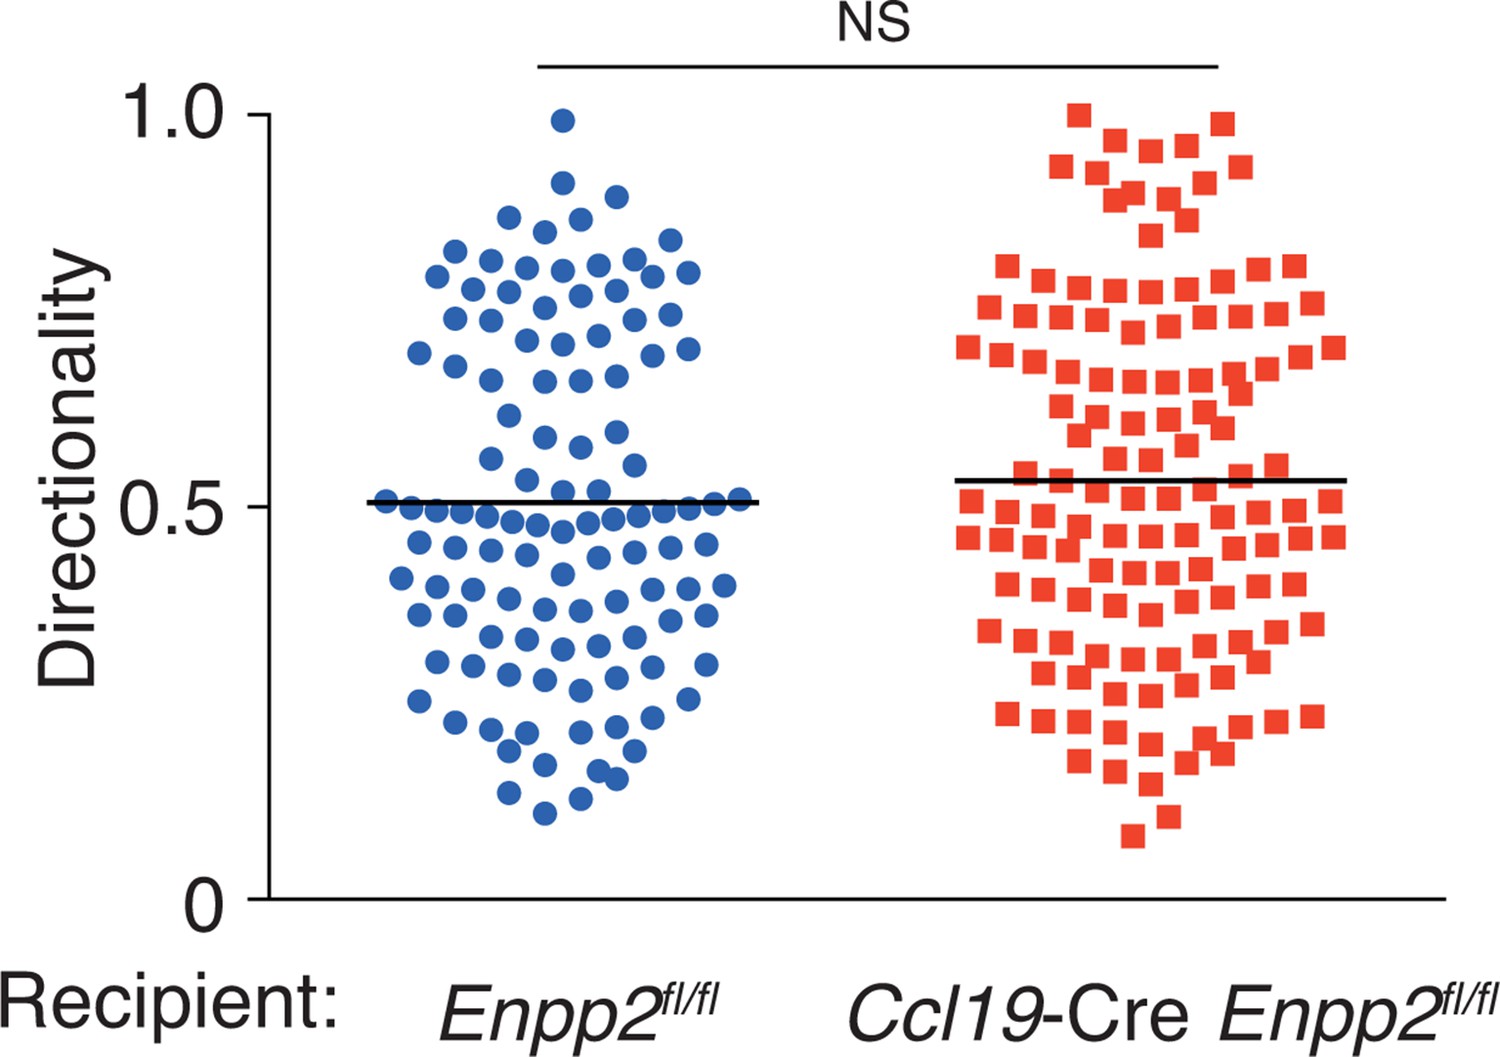
Directionality of WT CD4+ T-cell movement in Enpp2fl/fl and Ccl19-Cre Enpp2fl/fl LNs.
Directionality was calculated by dividing cells’ net displacement by the total path length. The data were pooled from two independent experiments.
Figure 4
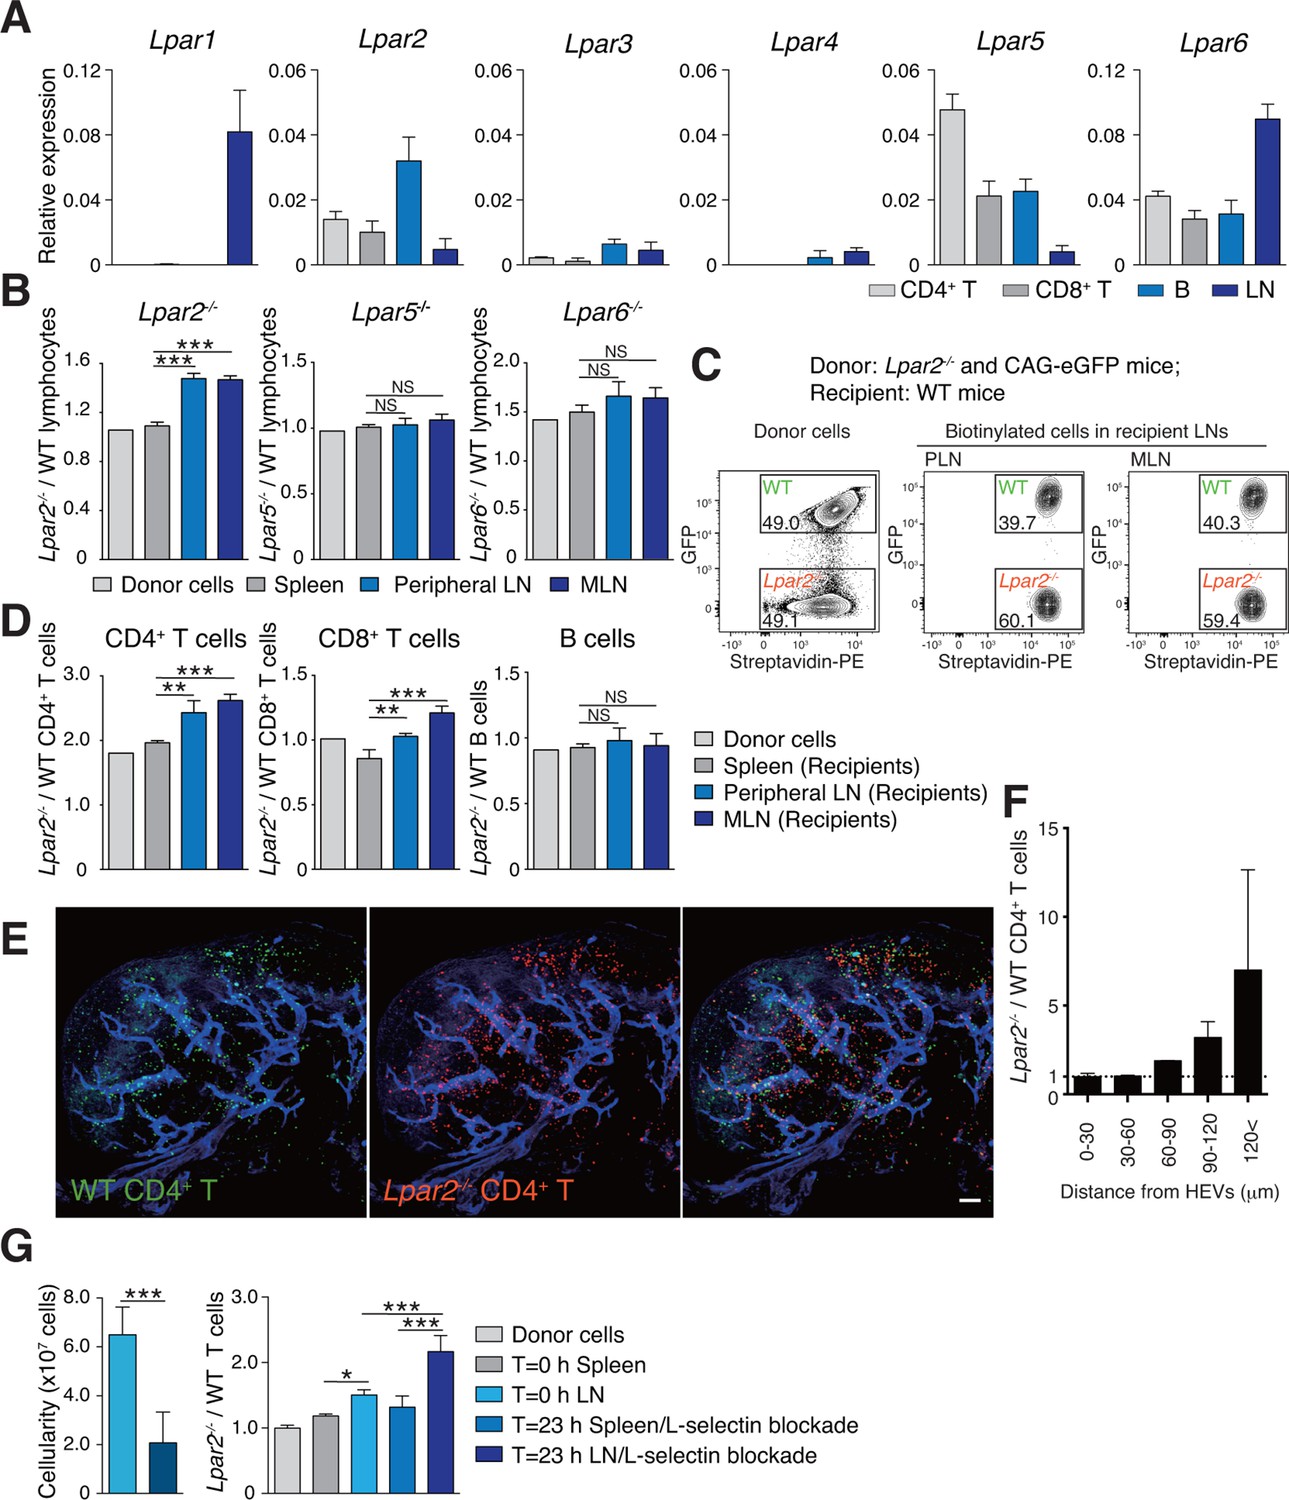
Lpar2 deficiency causes T cells to be retained in LNs.
(A) LPA-receptor expression in lymphocyte subsets: CD4+ T, CD8+T, B cells and whole LNs were analyzed by real-time RT-PCR; expression levels were normalized to Gapdh. Data shown are representative of three individual experiments. (B–D) Migration of LPA receptor–deficient lymphocytes into secondary lymphoid tissues. Splenocytes from eGFP-expressing mice and from Lpar2-/-, Lpar5-/-, or Lpar6-/- mice were mixed in equal numbers, labeled with biotin, and injected intravenously into WT recipients. After 1.5 hr, secondary lymphoid tissues were collected from the recipient mice and donor-derived lymphocytes were detected with flow cytometry. (B) Ratio of LPA receptor-deficient (Lpar2-/-, Lpar5-/- or Lpar6-/-) cells to eGFP-expressing (WT) cells that migrated into the spleen, peripheral LN, and MLN after adoptive transfer into WT recipient mice. (C) Representative dot plots of donor cells (before transfer) and biotinylated cells in LNs of recipient mice (after transfer). (D) Lpar2-/- lymphocyte subpopulations that migrated into the spleen, peripheral LN, and MLN of recipient mice. Data shown for adoptive transfer experiments using Lpar2-/-, Lpar5-/- and Lpar6-/- lymphocytes are representative of five, two, and three independent experiments, respectively (n=4 mice per group). (E, F) Localization of adoptively transferred WT and Lpar2-/- CD4+T cells in LNs. DiD-labeled CD4+ T cells from WT mice (1 x 10⁷ cells, pseudocolored in green) were mixed equally with CMTMR-labeled Lpar2-/- CD4+ T cells (red) and injected intravenously into WT recipient mice; 90 min later, Alexa Fluor 488-conjugated MECA-79 mAb (pseudocolored in blue) was injected intravenously to visualize HEVs. (E) LNs were collected and analyzed by confocal microscopy. (F) The distance that CD4+ T cells migrated from HEVs was measured, and the ratio of Lpar2-/- to WT T cells was calculated. Data represent mean ± SD from 3 mice. Data are representative of two (E, F) independent experiments. (G) Ratio of Lpar2-/- T cells to WT T cells retained in LNs when lymphocyte entry into LNs was blocked. CFSE-labeled CD45.1+ WT and CD45.2+Lpar2-/- CD4+ T cells were intravenously injected into CD45.2+ WT mice. Two hours later, anti-L-selectin antibody (MEL-14) was injected (T = 0 hr). At T=0 hr and T=23 hr, the total cell number in LNs (left) and the frequency of donor-derived cells (right) were measured. Data are pooled from two independent experiments. Data represent the mean ± SD (A, B, D, F, G). Differences between groups were evaluated by one-way ANOVA (B, D, G [right]) or Student’s t-test (G [left]). *P < 0.05, **P < 0.005, ***P < 0.0005. Bars: 100 μm.
Figure 5 with 3 supplements
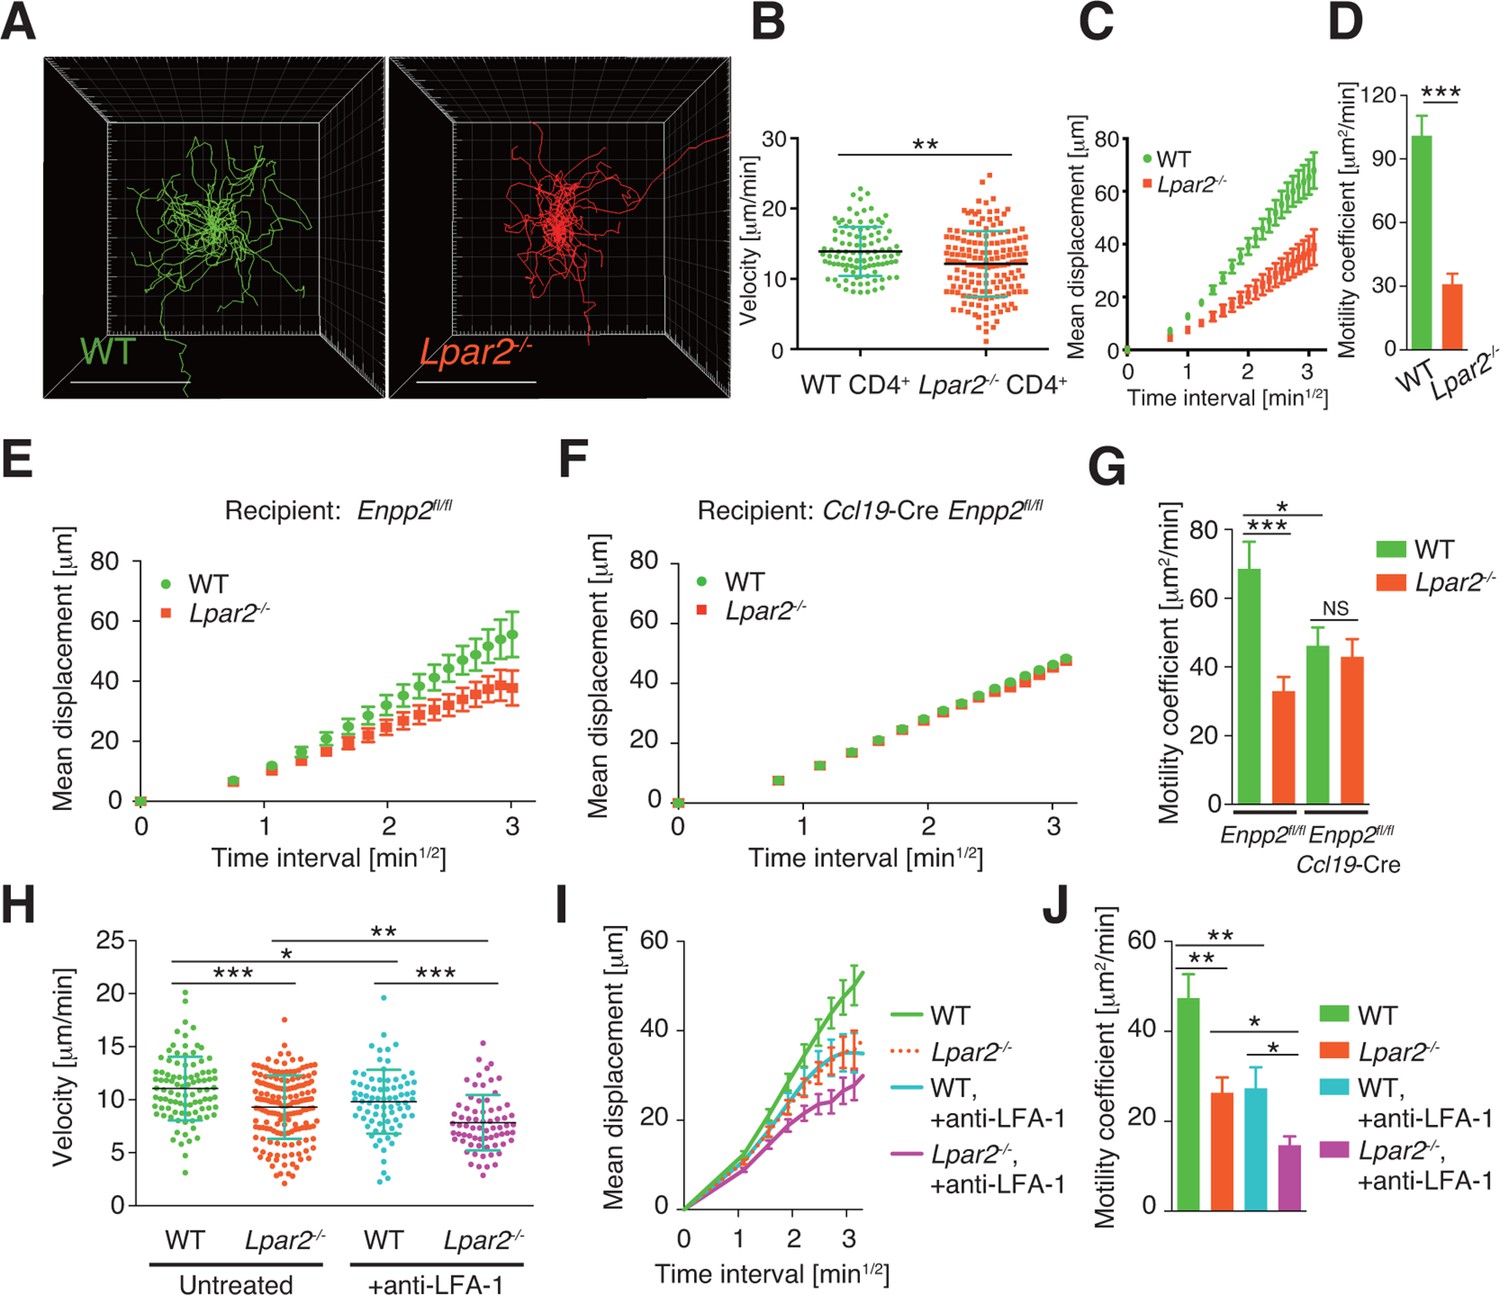
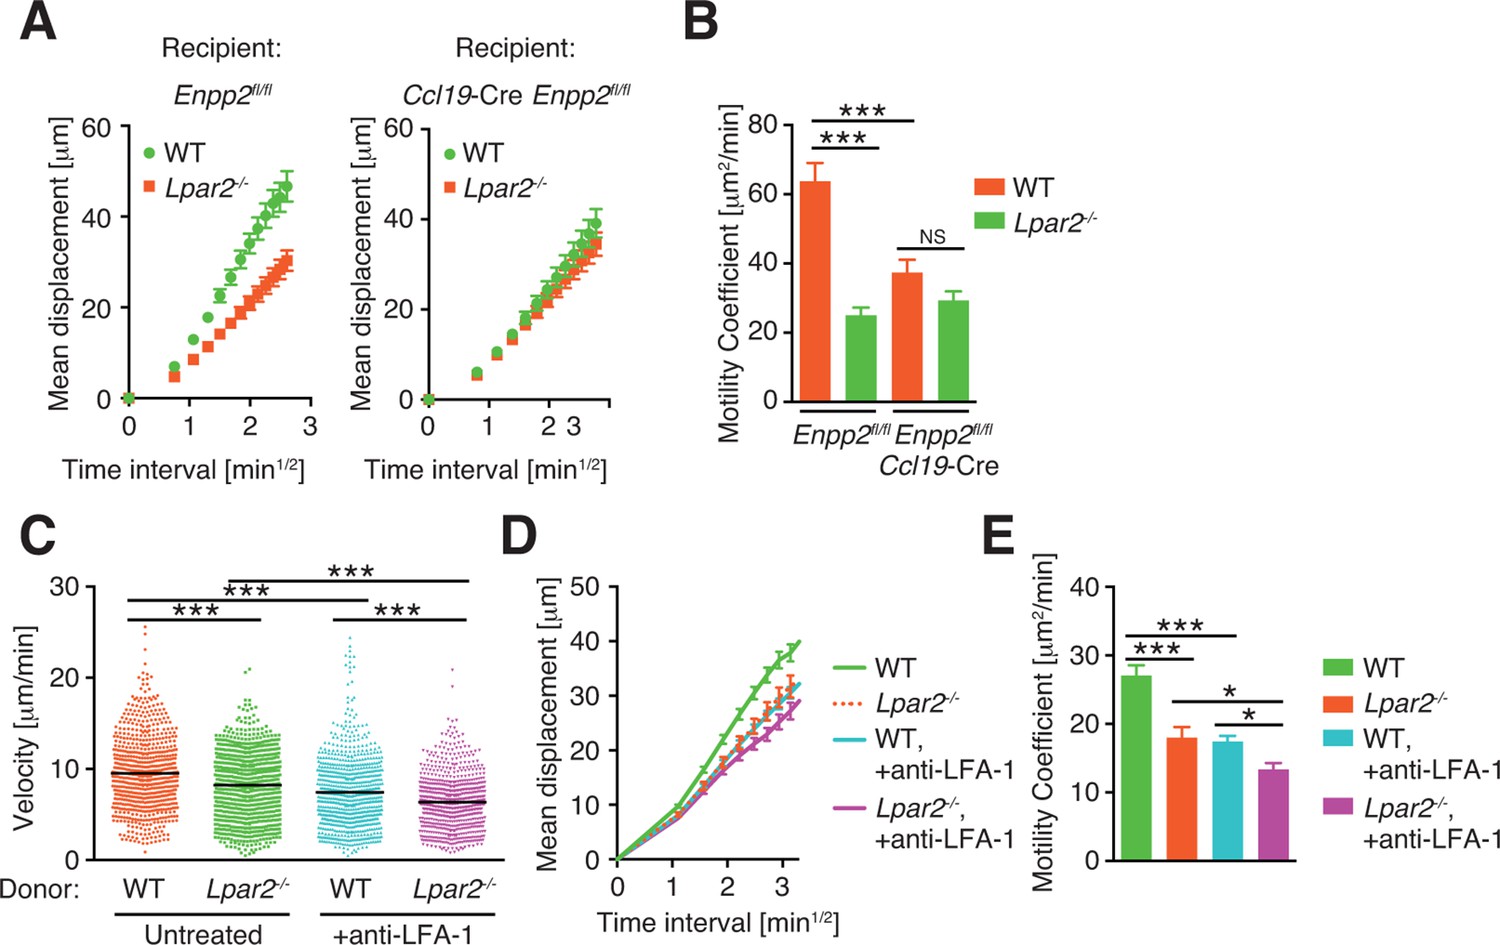
Lpar2 deficiency attenuates intranodal T-cell migration.
(A–D) Analysis of the intranodal migration of WT and Lpar2-/- CD4+ T cells in the PLN of WT mice by intravital two-photon microscopy. CD4+ T cells from eGFP-expressing mice (green, 5 x 10⁶ cells) mixed with an equal number of CMTMR-labeled Lpar2-/- CD4+ T cells (red) were injected into WT mice; the transferred cells' internodal migration was analyzed by intravital two-photon microscopy 15–25 hr later (Figure 5—figure supplement 1). (A) Translated tracking of CD4+ T-cell migration with a common origin. (B-D) Analysis of T cell motility. See also Figure 5—figure supplement 2. (B) Average cell velocity. Each dot represents the average velocity of an individual cell; bars indicate the median. (C) Mean displacement plot. (D) Motility coefficient. (E–G) The intranodal migration of WT and Lpar2-/- CD4+ T cells in the PLN of Ccl19-Cre Enpp2fl/fl or Enpp2fl/fl mice. Lpar2-/- CD4+ T cells and WT CD4+ T cells were mixed in equivalent numbers and injected into Enpp2fl/fl (E) or Ccl19-Cre Enpp2fl/fl mice (F). The mean displacement (E, F) and motility coefficient (G) are shown. (H–J) The intranodal migration of WT and Lpar2-/- CD4+ T cells in the presence of anti-LFA-1 blocking antibody. (H) Average cell velocity. (I) Mean displacement plot. (J) Motility coefficient. Data are representative of at least three (A–D, H–J) or, two (E–G) independent experiments. Pooled data of two photon microscopic analyses are shown in Figure 5—figure supplement 3. Data represent the mean ± SD (B, H) or mean ± SEM (C–G, I, J). Differences between groups were evaluated by Student’s t-test (B, D, G, J) or one-way ANOVA (H). *P < 0.05, **P < 0.005, ***P < 0.0005. Bars: 100 μm.
Figure 5—figure supplement 1
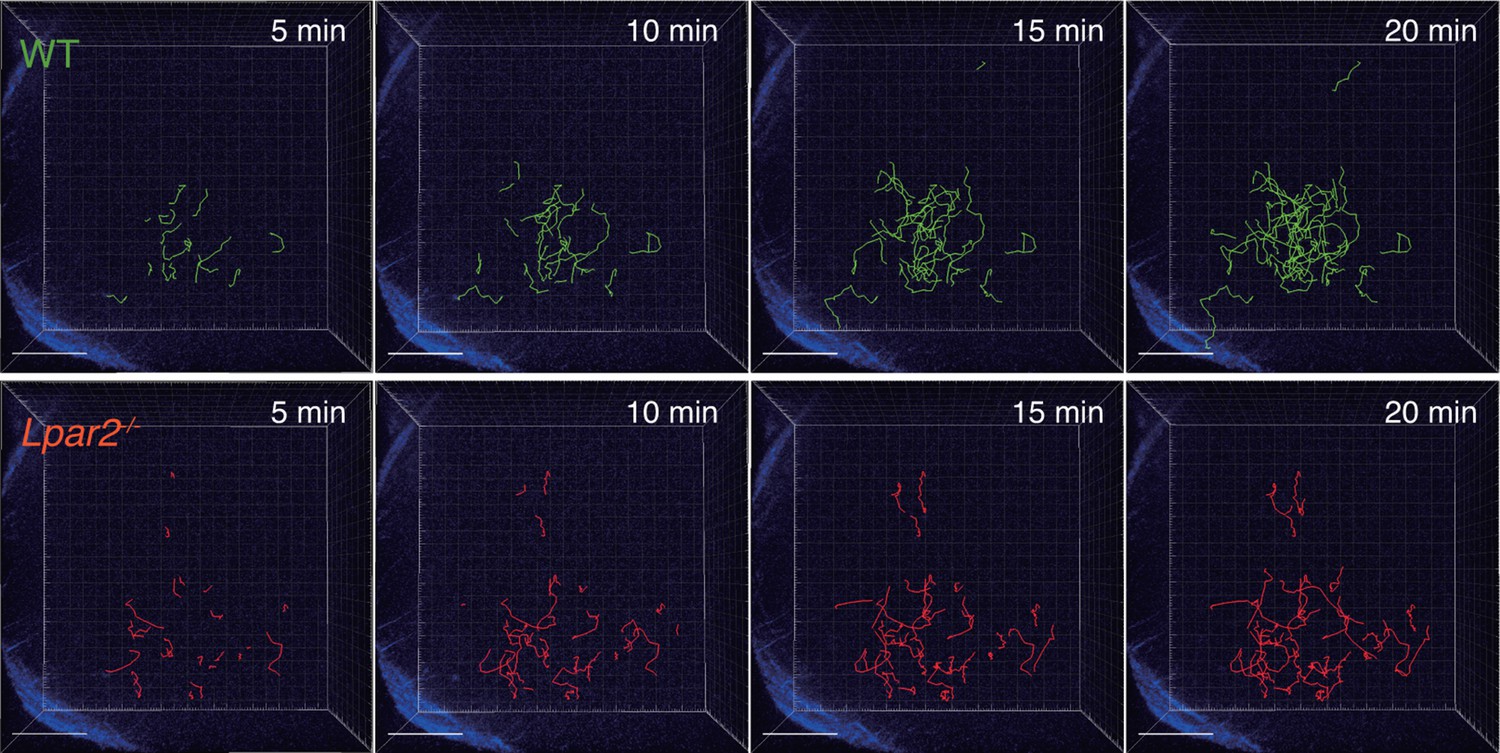
Tracking of WT and Lpar2-/- T cells in popliteal LN using intravital two-photon microscopy.
CD4+ T cells from eGFP-expressing mice (green, 5 x 10⁶ cells) mixed with an equal number of CMTMR-labeled Lpar2-/- CD4+ T cells (red) were injected into WT mice; the transferred cells' intranodal migration was analyzed by intravital two-photon microscopy 15–25 hr later. Secondary harmonic signals are indicated in blue. The T-cell migration was tracked by Imaris software.
Figure 5—figure supplement 2
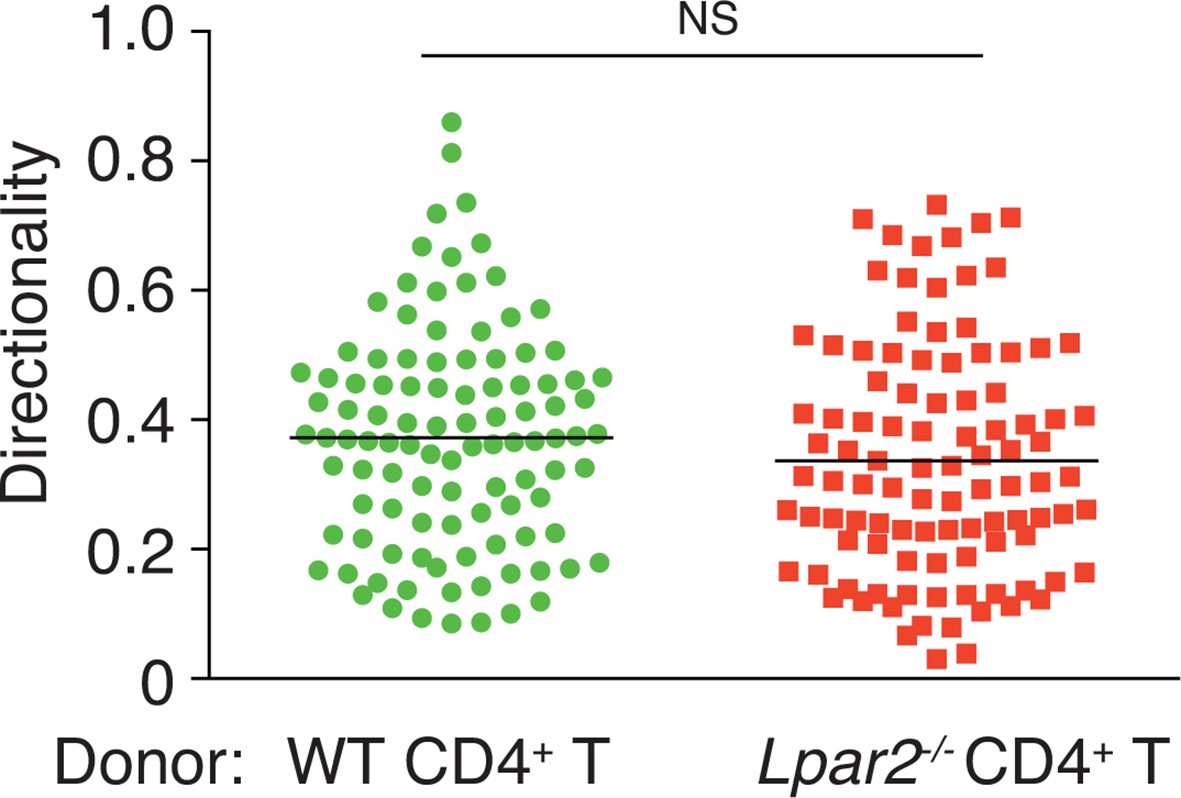
Directionality of WT and Lpar2-/- CD4+ T-cell movement in WT LNs.
Directionality was calculated by dividing cells’ net displacement by the total path length. The data were pooled from three independent experiments.
Figure 5—figure supplement 3
Pooled data of cell behaviors analyzed by intravital two-photon microscopy.
(A, B) Motility of WT and Lpar2-/- CD4+ T cells in Enpp2fl/fl or Ccl19-Cre Enpp2fl/fl LNs. Mean displacement plot (A) and motility coefficient (B) are shown. (C–E). Motility of WT and Lpar2-/- CD4+ T cells in WT LNs before and after the injection of anti-LFA-1 antibody. Velocity (C), mean displacement plot (D) and motility coefficient (E) are shown. The data were pooled from two (A, B) or three (C–E) independent experiments. Differences between groups were evaluated by one-way ANOVA (B, C, and E). *P < 0.05, **P < 0.005, ***P < 0.0005.
Figure 6
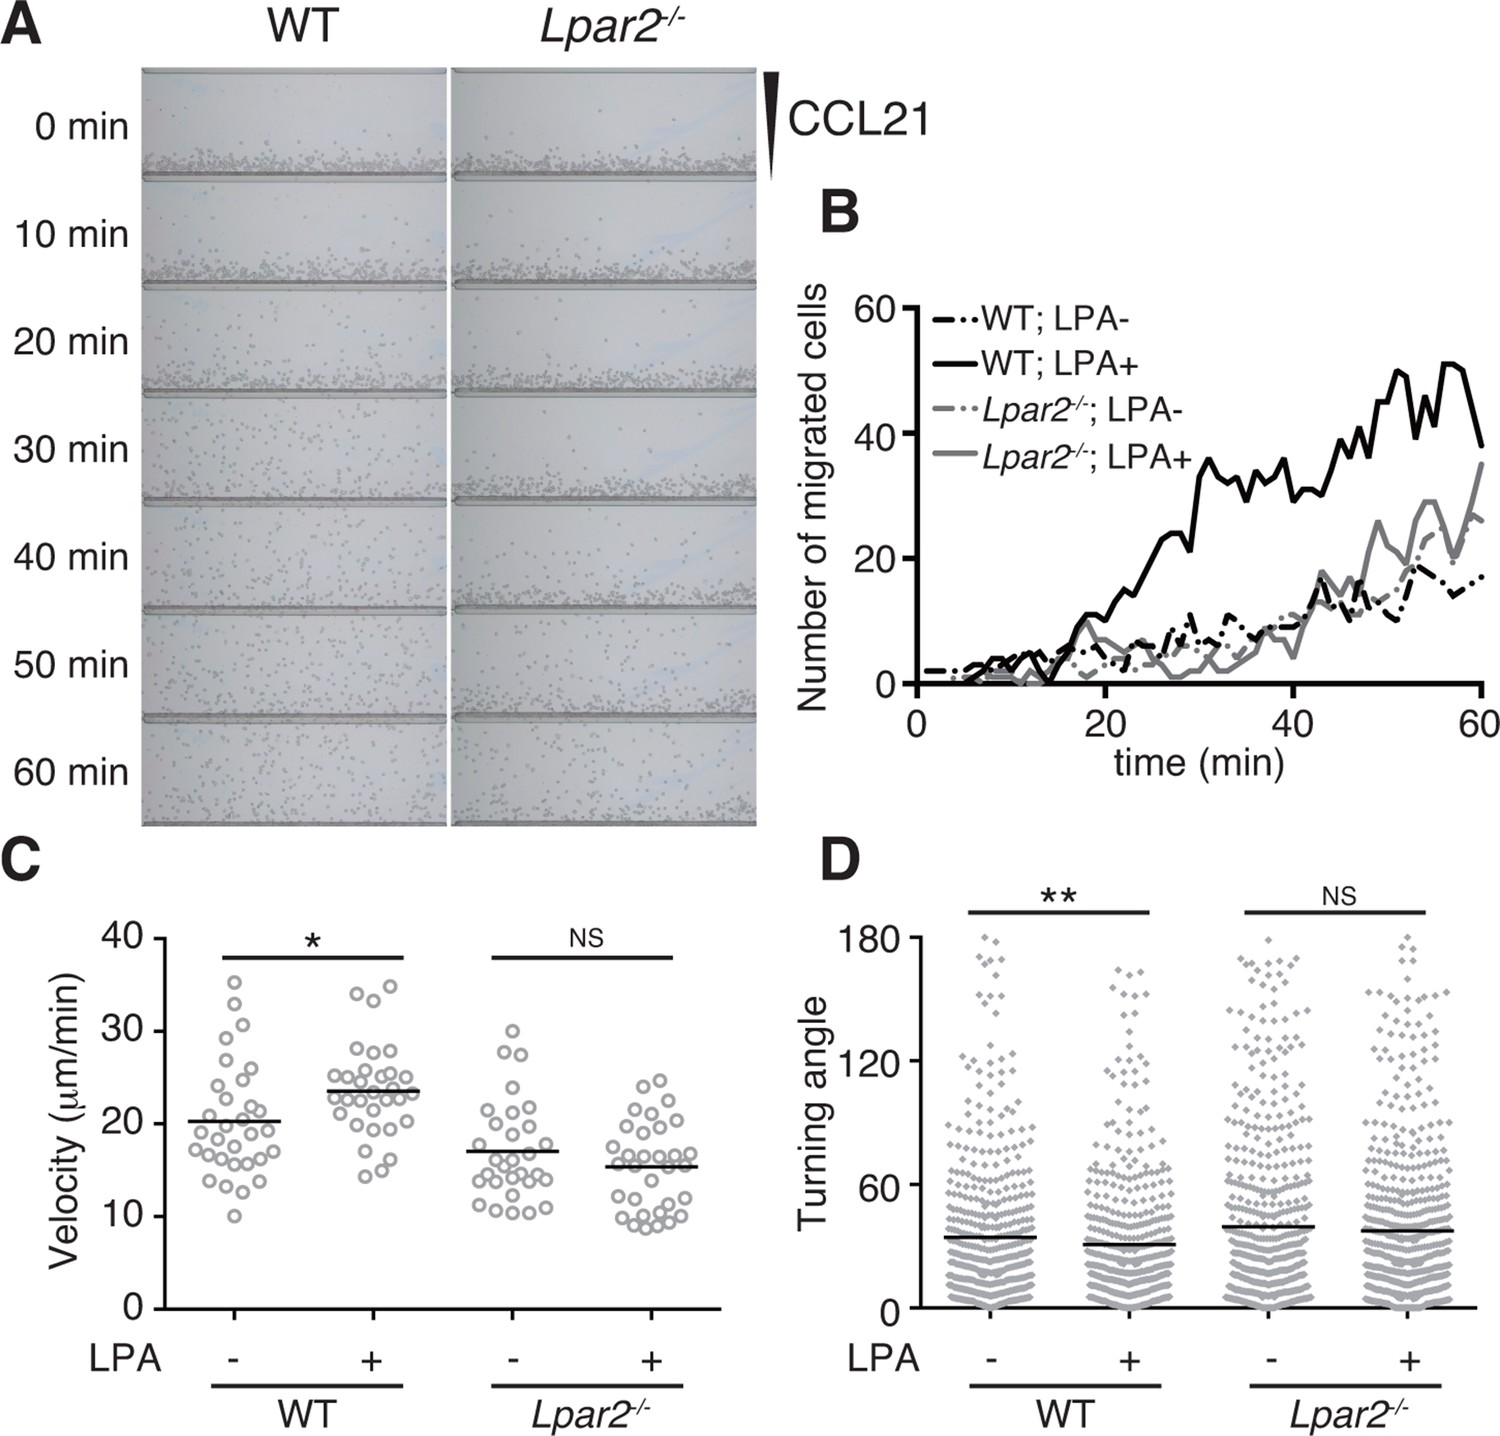
LPA/LPA2-mediated signaling promotes T-cell migration on a 2D surface.
CD4+ T cells from WT or Lpar2-/- mice were left untreated or were treated with LPA (1 μM) and immediately loaded on one side of an EZ-Taxiscan chamber, and medium containing CCL21 (100 ng) was applied on the other side. (A) Cell migration on a surface coated with ICAM-1-Fc was monitored at 1-min intervals. (B) Cells that migrated toward the CCL21-containing contra-wells were counted, and the (C) average cell velocity and (D) turning angle were calculated. Bars represent the median. Differences between groups were evaluated by Student’s t-test. *P < 0.05, **P < 0.005.
Figure 7
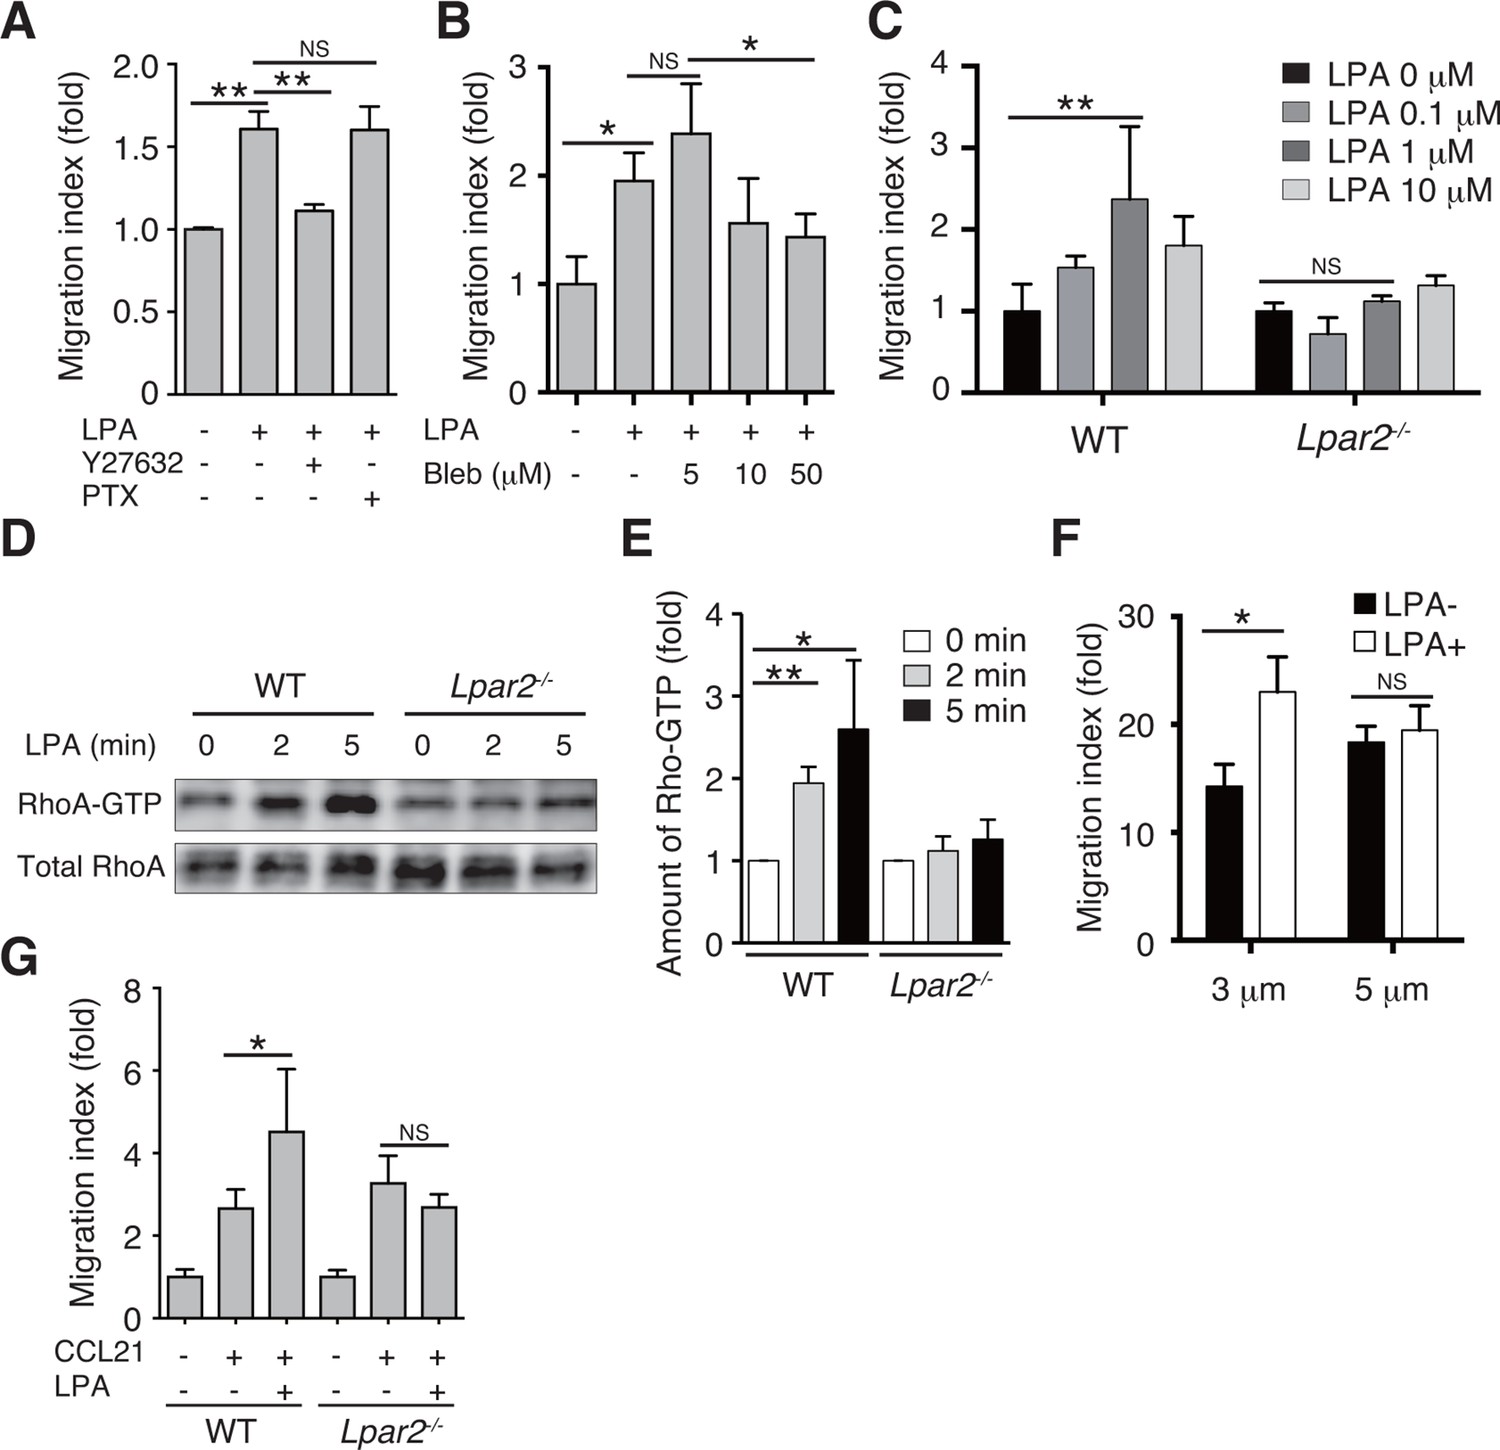
LPA/LPA2 axis regulates T-cell migration in a Rho/ROCK/myosin II-dependent manner.
(A, B) The involvement of ROCK-myosin II signaling in LPA-enhanced cell migration across narrow pores. Lymphocytes were pretreated with the indicated concentrations of blebbistatin (Bleb), Y27632 (10 μM), or PTX (100 ng/ml), and were added with LPA to the upper chamber of a Transwell apparatus with a 3-μm-pore filter. After 2 hr, the migrated CD4+ T cells in the lower chambers were counted by flow cytometry. (C) Role of LPA2 in the LPA-induced chemokinesis of CD4+ T cells. WT or Lpar2-/- lymphocytes were added with various concentrations of LPA to the upper chamber. (D) Role of LPA2 in the LPA-induced activation of RhoA. WT and Lpar2-/- T cells were incubated with 1 μM LPA for the periods indicated, and were lysed immediately thereafter. RhoA-GTP in the lysates was pulled down using Rhotekin and was detected with an anti-RhoA antibody. (E) The relative band intensities of LPA-treated WT and Lpar2-/- T cells, normalized to untreated WT and Lpar2-/- T cells, respectively. (F) Effect of LPA on CD4+ T cell migration through Transwell membranes with a pore diameter of 3 or 5 μm. WT lymphocytes pretreated with or without LPA (1 μM) were applied to the upper chamber, and CCL21 (200 ng/ml) was added to the lower chamber. (G) Role of LPA2 in LPA-induced enhancement of CD4+ T cell chemotaxis toward CCL21. WT or Lpar2-/- lymphocytes were added with LPA (1 μM) to the upper chamber and CCL21 (200 ng/ml) was added to the lower chamber. Data are representative of two (A, B) or at least three (C–G) independent experiments (n = 3 per group). Data were evaluated by one-way ANOVA (A–C, F, G) or Student’s t-test (E) and represent the mean ± SD. *P < 0.05, **P < 0.005.
Figure 8
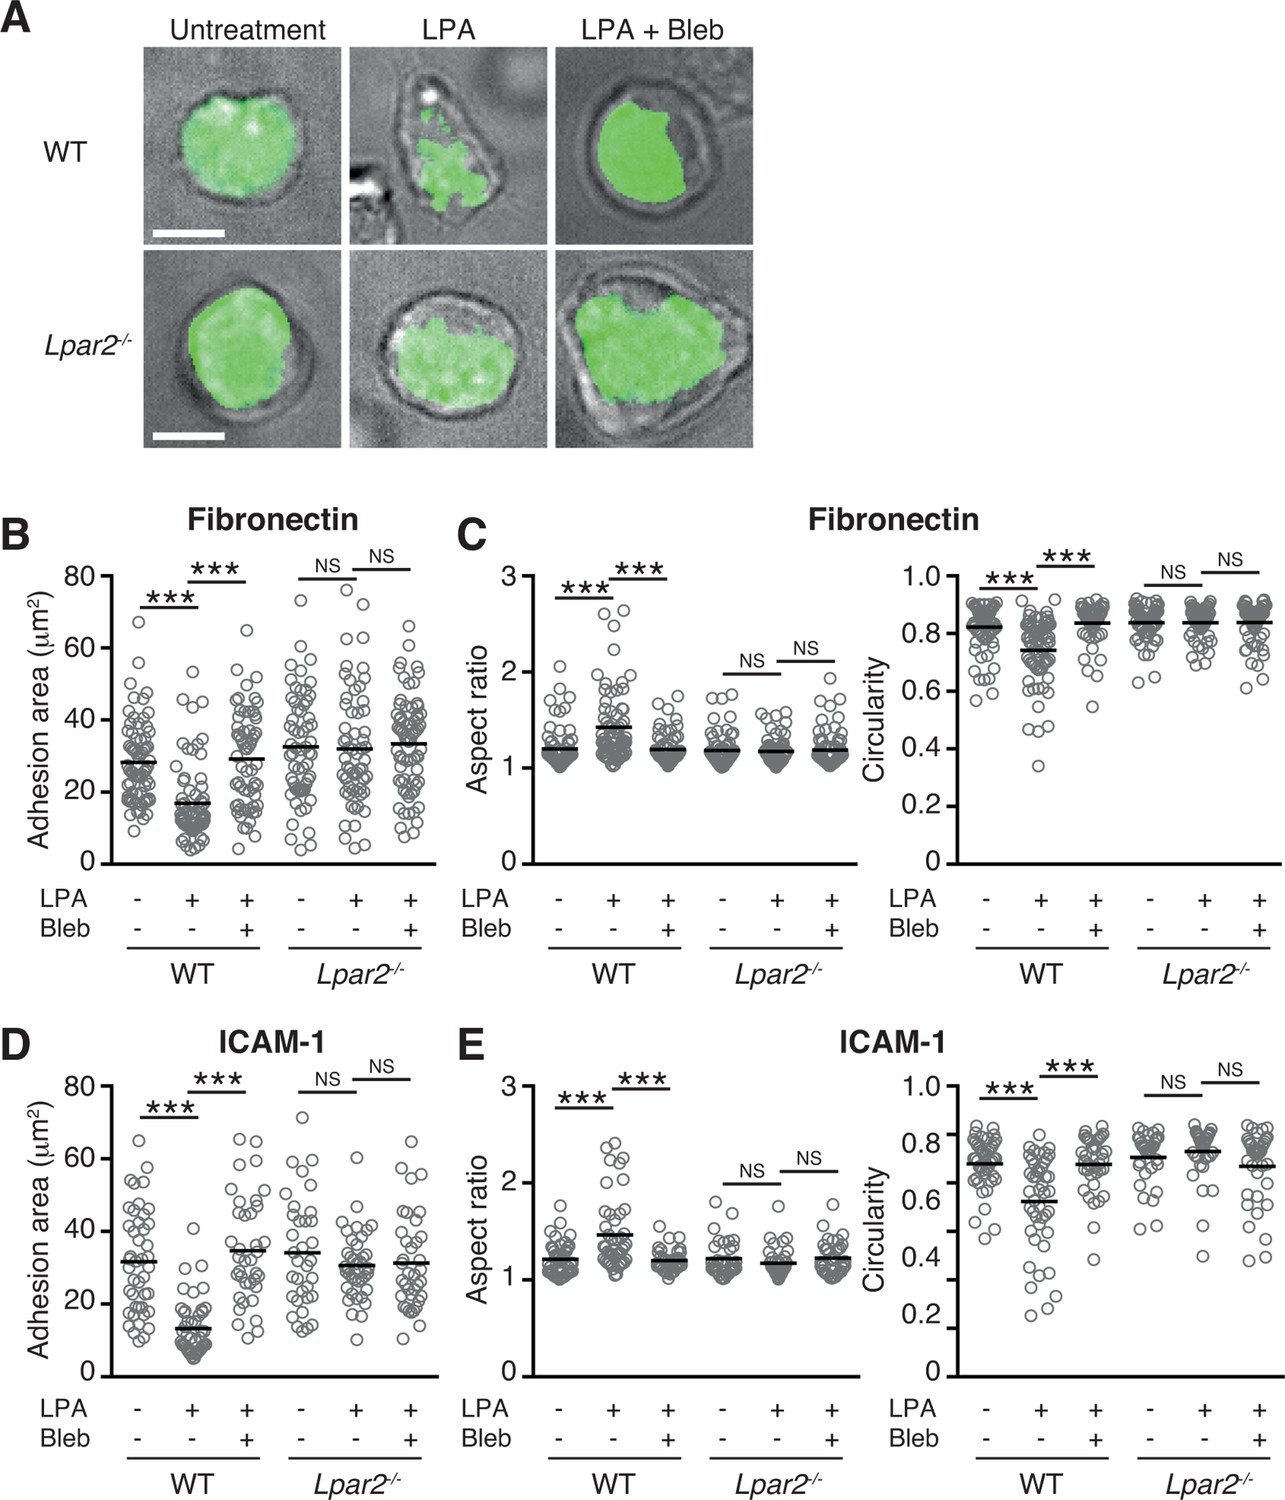
LPA/LPA2 axis limits T cell-adhesion area on adhesive substrates.
(A–C) Role of the LPA/LPA2 axis in T cell adhesion and morphology. CMFDA-labeled T cells were incubated on a fibronectin- (A–C) or ICAM-1- (D, E) coated slide glass, pretreated with or without blebbistatin (50 μM), and stimulated with LPA (1 μM). The adhesion area of CD4+ cells was assessed by TIRF microscopy (green) (A-B, D). Aspect ratio (cell length/cell breadth) and circularity (4 x π x area/perimeter2) (C, E) were assessed by bright-field images. Bars: 5 μm. Data are pooled from two independent experiments. Differences between groups were evaluated by one-way ANOVA. ***P < 0.0005.
Figure 9 with 1 supplement
LPA/LPA2 axis promotes T-cell motility in a confined 3D environment.
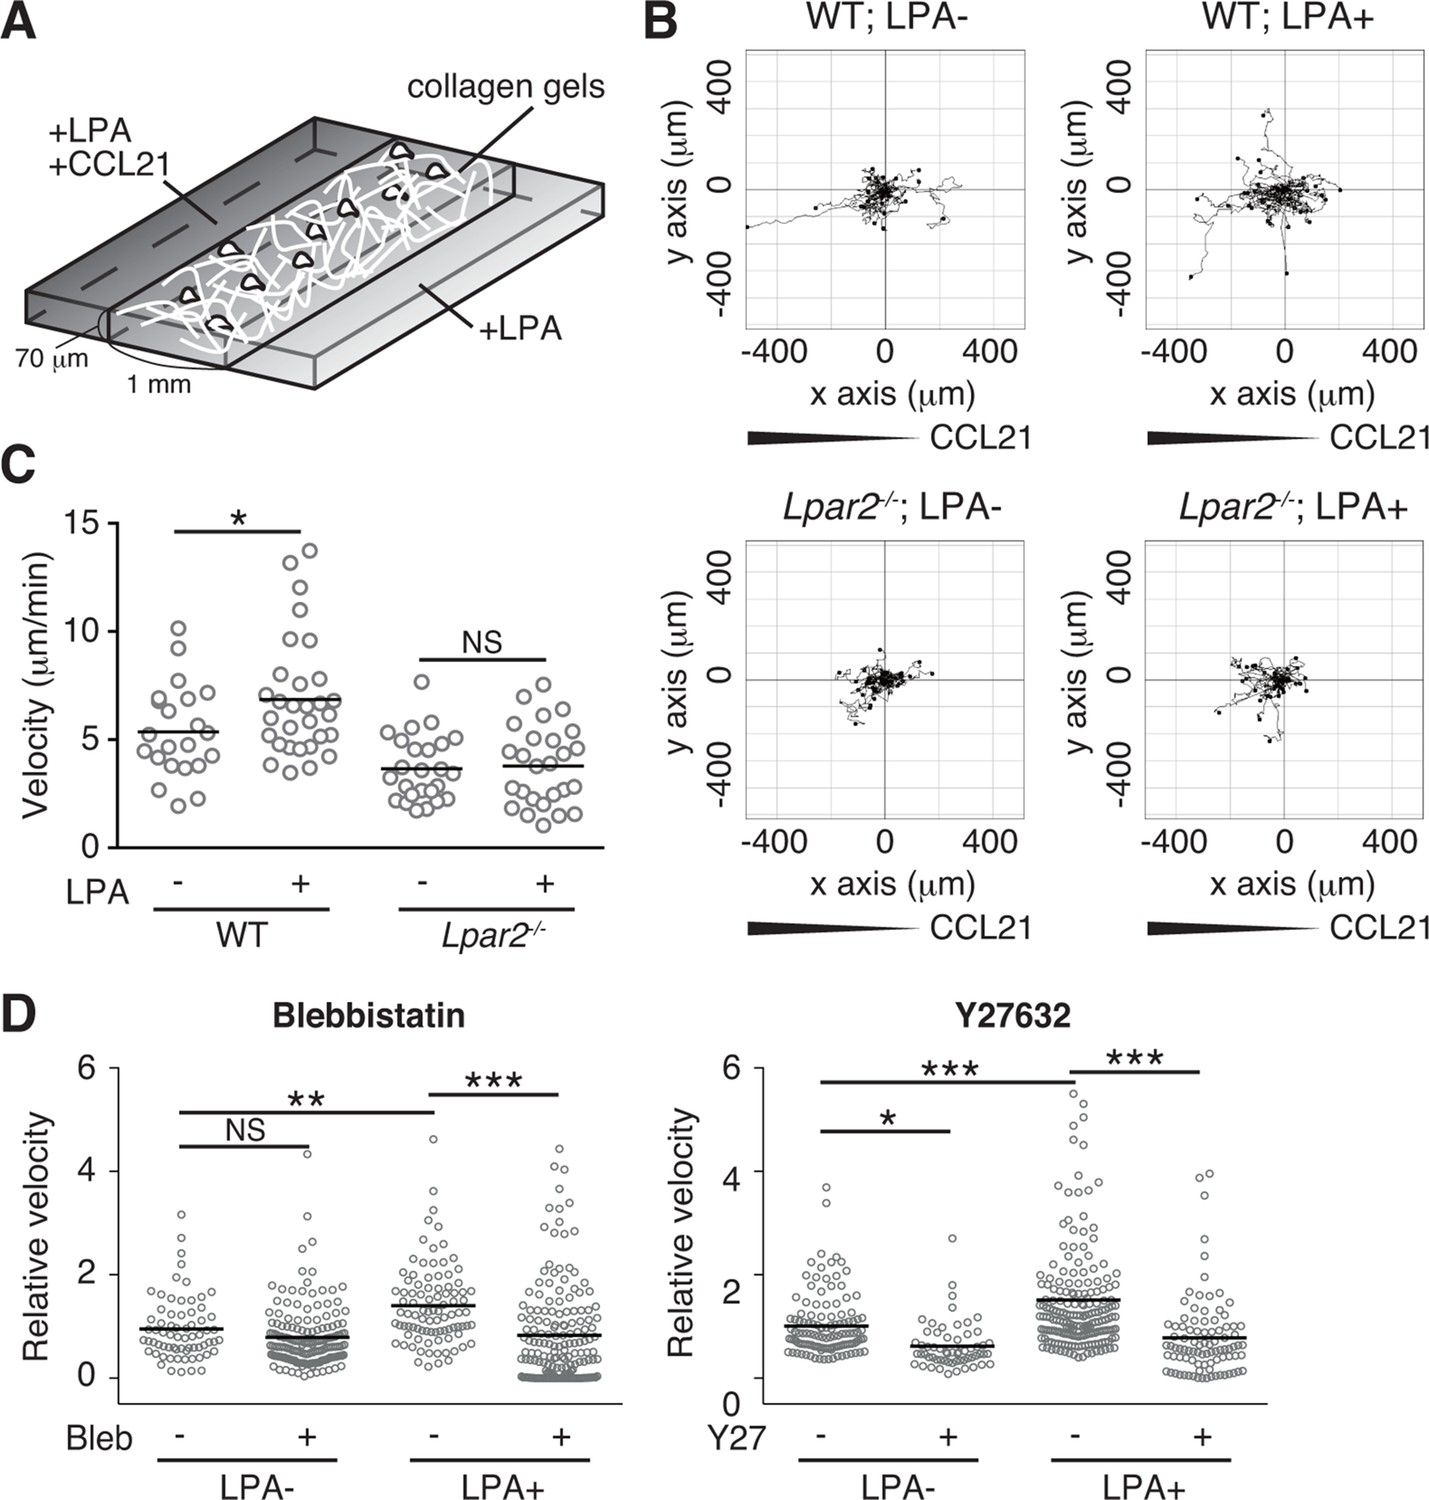
(A) Illustration of the 3D migration assay. The cell suspension was mixed with collagen gel (1.6 mg/ml). CCL21 (5 μg/ml) was loaded into one side of the gel, and LPA (5 μM) was applied to both sides. The migration of eGFP-expressing CD4+ T cells or their Lpar2-/- counterparts was recorded for 120 min by time-lapse microscopy. (B) Manual tracking of T cell motility. (C) T cell velocity. See also the directionality of T cell movement in Figure 9—figure supplement 1. (D) Involvement of myosin II/ ROCK in LPA-induced T cell motility. After eGFP-expressing CD4+ T cells and WT counterparts were treated with vehicle and indicated inhibitors, respectively, they were mixed with the collagen gel and monitored for cell migration. Data are representative of two independent experiments (B, C) and pooled from two independent experiments (D). Differences between groups were evaluated by Student’s t-test (C) or one-way ANOVA (D). *P < 0.05, **P < 0.005, ***P < 0.0005.
Figure 9—figure supplement 1

Effect of LPA on the directionality of T-cell movement in 3D collagen gel.
WT and Lpar2-/- CD4+ T cells were mixed with collagen gel (1.6 mg/ml). After applying CCL21 into one side of the gel, the T-cell migration in the collagen gel in the presence or absence of LPA was monitored by time-lapse microscopy. Directionality of cell migration was calculated as (net displacement)/(total path length).
Videos
Video 1
FRC-specific ATX ablation reduced the velocity of T cells in LNs.
Intravital two-photon microscopy was used to analyze the intranodal migration of eGFP-expressing CD4+ T cells (green) 15 hr after the cells were injected into Enpp2fl/fl (left) or Ccl19-Cre Enpp2fl/fl mice (right). Data shown are representative of three independent experiments. Bars, 50 μm.
Video 2
Lpar2 deficiency attenuated the intranodal T-cell motility.
Intravital two-photon microscopy of the intranodal migration of eGFP-expressing CD4+ T cells (green) and CMTMR-labeled Lpar2-/- CD4+ T cells (red) in PLNs 15 hr after the cells were injected into WT mice. Data shown are representative of three independent experiments. Bar, 100 μm.
Additional files
-
Supplementary file 1
Primer sequences for quantitative PCR analysis.
These primers were designed using Primer3 software (Sourceforge) and used for SYBR green-based real time-PCR analysis.
- https://doi.org/10.7554/eLife.10561.021
Download links
A two-part list of links to download the article, or parts of the article, in various formats.
Downloads (link to download the article as PDF)
Open citations (links to open the citations from this article in various online reference manager services)
Cite this article (links to download the citations from this article in formats compatible with various reference manager tools)
Fibroblastic reticular cell-derived lysophosphatidic acid regulates confined intranodal T-cell motility
eLife 5:e10561.
https://doi.org/10.7554/eLife.10561


