Introduction
Some researchers already compose manuscripts and document experiments in formats that closely tie the analysis and visualisation code with the outputs, including Jupyter notebooks and R Markdown documents. The benefits this brings to the researcher includes better documentation and reproducibility of their analyses, as well as faster updating of results and visualisations as new data is added. For the reader, including this extra level of research documentation enables better comprehension and reuse of computational methodologies. So, how might publishers better support the sharing of research in these enriched forms? Do readers want to be able to interact with, reproduce or modify computational analyses? In which research areas are these technologies most relevant?
In order to better understand the demand for new features to support executable research articles, we conducted a survey including questions about how familiar the community are with current reproducible research tools and which features supporting these tools they would be most likely to use if they were to be provided. The survey questions are available here.
We surveyed eLife authors, reviewers and readers over the course of one week in June, with the survey advertised by email, in our weekly digest of new articles (eTOC) and on social media. We received 152 complete responses: the key results are shared in this blogpost.
Summary of findings
The results of this survey affirm that there are researchers who already document their workflows and results in a way that could allow readers to understand and build on this work more readily. As may be expected, these tools are currently most widely used in more computationally-intensive research areas - Computational and Systems Biology, Genomics and Evolutionary Biology, and Neuroscience - but researchers in general are interested in learning and adopting more computational practises.
Being able to view and download the data and code associated with a research article directly from the online publication was identified as a key feature of interest highlighting that raising the visibility of these assets is an important feature. Respondents were also likely to submit their manuscript in a file format that preserves the data and code alongside the text, particularly if they were already users of such formats (R Markdown, Jupyter notebooks), and to interact online with these assets in a way that allows them to gain additional insight into the research publication they are reading.
Several issues and limitations with implementing more computationally reproducible articles were highlighted. For example, it may not be possible to share research involving large or complex datasets and computational scripts in a format other than the traditional manuscript. Any infrastructure would need to manage dependencies, accommodate versioning, and deliver computational outputs with sufficient speed to be more useful than computing locally. Finally, the imbalance between author burden - including the time taken to produce well-documented assets and the effort to learn these new methods - and third party benefit is a concern, and one which may prevent some researchers from engaging with these technologies without appropriate incentivisation.
The results are described in greater detail below.
Next steps
We thank all who responded to our survey. The results have identified problems areas to focus on and highlighted potential features to prioritise as we explore how to support researchers to share and consume more computationally reproducible research.
We are grateful to the many researchers who added messages of support and welcomed future interactions regarding our investigations. We will be following up in due course. If you would like to share your experiences regarding the use of reproducible research documents, or to be involved in future discussions, please email Naomi at innovation@elifesciences.org.
Detailed results
Who took the survey
The top three research categories that the respondents worked within were Neuroscience (34%), Biochemistry (28%), and Computational and Systems Biology (28%). Other notable research areas were Cell Biology, Genomics and Evolutionary Biology, and Biophysics and Structural Biology (Figure 1).
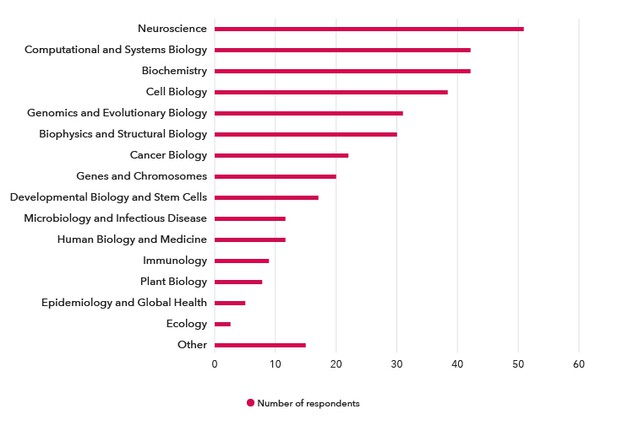
Figure 1. Which research area(s) do you work in? The frequency of respondents working within each research category (fuscia).
Of the 152 respondents, over half (84) were group leaders and 38 were post-docs (Figure 2).
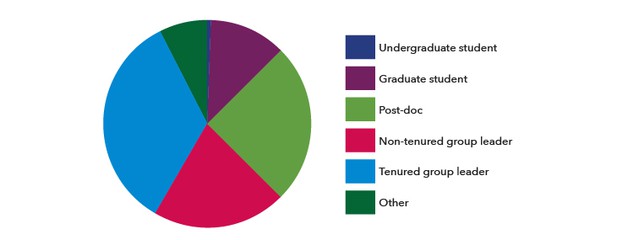
Figure 2. Which option best describes your career stage?.
Familiarity with existing reproducible research tools
Just under half the respondents had previously used R Markdown and/or Jupyter notebooks in their research (Figure 3); both are popular formats for documenting code with the computational outputs. Of note, 42% of respondents had not used R for their research; they were not asked about R Markdown. Interestingly, the respondents who had previously used R Markdown and/or Jupyter notebooks worked mainly within the computationally-intensive research areas of Computational and Systems Biology, Genomics and Evolutionary Biology, and Neuroscience (Figure 4).
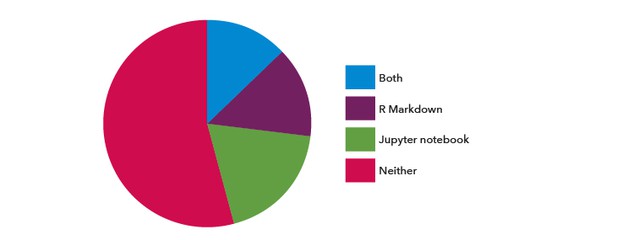
Figure 3. The proportion of respondents who answered yes to the questions ‘have you ever used R Markdown in your research?’ and/or ‘have you ever used Jupyter notebooks in your research?’.
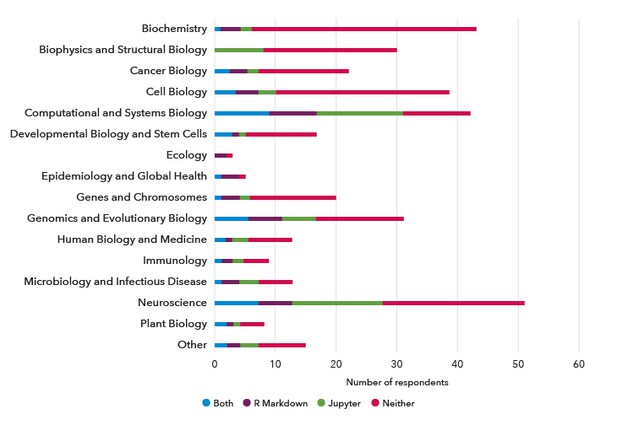
Figure 4. The number of respondents with prior usage of R Markdown and/or Jupyter notebooks according to research category.
We asked the respondents who had not used these formats, or were not sure if they had, what reason(s) prevented them from using this in their research (Table 1). The major reason why respondents did not use R was not knowing how, whilst a lack of awareness of the tool was the main blocker for using R Markdown and Jupyter notebooks.
| R | R Markdown | Jupyter notebook | |
|---|---|---|---|
| I don't know what _ is | 13 (20%) | 18 (38%) | 62 (60%) |
| I don’t know how to use __ | 28 (43%) | 14 (30%) | 25 (24%) |
| I don’t use __ | 24 (37%) | 14 (30%) | 24 (23%) |
| My colleagues do not use __ | 8 (12%) | 10 (21%) | 18 (17%) |
| It’s not appropriate for my research | 6 (9%) | 4 (9%) | 9 (9%) |
| I cannot share my research through a journal in this format | Not asked | 1 (2%) | 3 (3%) |
| There’s no incentive to use __ | 12 (18%) | 11 (23%) | 12 (12%) |
| Other | 20 respondents left comments. Some suggested they would like to learn R, or would learn it if they felt able to or were not already comfortable with an alternative. | 14 respondents left comments, noting that they use or prefer alternatives, whilst others noted an interest in using it having now that they have been introduced to it. | 17 respondents left comments, noting that they used R-based and other tools instead, or that they would use Jupyter if they had Python code. |
Table 1. The respondents who had not or were not sure if they had used R, R Markdown and Jupyter notebooks were asked ‘What prevents you from using __ for your research?’ for each tool. The number of respondents for each question was 65, 47 and 102, respectively.
Demand for features of an executable article
Considering how to improve the sharing of data and code and to bring these assets closer to the research narrative, the activities of greatest interest to the respondents in this survey were, in order of greatest likelihood:
- Viewing and downloading the code and data underlying the research directly from the online article
- Interacting online with the data, code and/or plots in the article to gain additional insight
- Submitting the manuscript in a file format that preserves code and data alongside the text
There was more mixed interest in being able to modify the code and run this new version online and being able to run the original code online (Figure 5).
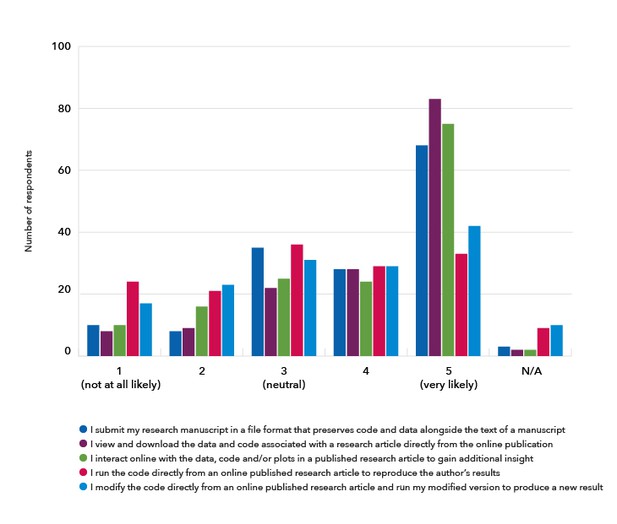
Figure 5. The respondents were asked to rate the likelihood of using a particular feature of an executable article.
Submitting a reproducible research document
The respondents noted that submitting their research in a more reproducible format would need to be as practical and achievable for authors as possible: “It would help if all publishers would agree to one common format for code and data, so researchers could all work in that format from the start.” Adding extra work was a concern, as was the data and/or code being too complex to share in this way. Researchers who already document their research in more reproducible formats were in favour of the publisher supporting this: “For each manuscript I have a directory with all data, code, manuscript files etc. I think the future is for journals to host this. The current situation (at most journals) that a compressed PDF appears online with most data hidden is outdated.”
Accessing the underlying data and code
Being able to easily locate, access and download the data and code underlying a research article was seen as a useful feature, pointing to the inadequacies of the current system: “I have gotten so frustrated trying to get data and from articles (so I can analyze them myself) and not being able to find the data or code. Numerous times authors have neglected to respond to me or been impossible to contact. In other cases the documentation for the code has been so inadequate that it's difficult to impossible to use.” The practicality of managing dependencies and versions was flagged, whilst some respondents felt that existing data and code sharing mechanisms need not be duplicated by the publisher.
Interacting with figures and results
Those in support of being able to interact with the data, code and/or plots online showed interest in using R Shiny and Plot.ly-style graphs, and pointed out benefits including helping less computationally literature users to interact, and that this “could eliminate the need for countless supplementary figures in many cases (e.g. exploring the effect of parameters on results)”. Those against the idea again referred to the lack of time for authors and the impracticality of producing these assets.
Reproducing computations online
Reproducing a computational result was not seen to be particularly useful beyond the first few reproductions, and only for results that were particularly significant or relevant, or “in case of serious doubts about the analysis of the data.” Concerns were raised over the practicality for analyses with high computation requirements and regarding dependency management. It was felt that researchers should be trusted to do the analysis correctly, whilst anyone wishing to explore the data and code would do so on their own machines and have the prerequisite knowledge to do so.
Modifying computations for new analyses
The respondents had mixed opinions over the utility of providing a feature that would enable the reader to modify and re-run computations underlying the research article. One saw this as “a killer feature especially if results can be returned in near real-time” whilst another added caveats: “The level of annotation and documentation required for this would be huge but certainly beneficial to the field. A code badly written by a biologist should not prevent publication of the result as long as it does what it claims it does.” Practicalities such as dependency management, delivering the necessary compute power with enough speed, and variable code quality were flagged as concerns.
Supporting specific formats
We also asked the respondents who had used R Markdown and/or Jupyter notebooks before whether they would be likely to submit a research manuscript in one of these specific formats, or to present their research in these formats as a complement to the research article. The majority of respondents indicated they were very likely to do so (Figure 6).
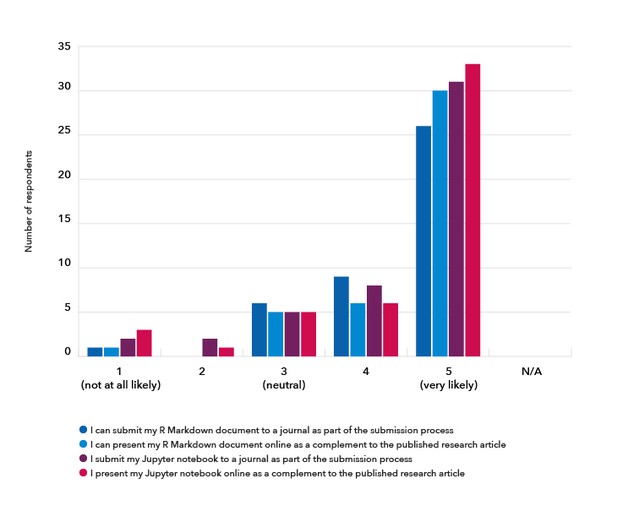
Figure 6. The respondents were asked how likely they would be to use features specific to R Markdown (42 respondents) or Jupyter notebooks (48 respondents), were they to be made available.
Some respondents detailed concerns about these formats, including the potential infeasibility due to the complexity and size of datasets, as well as “the potential for this to add significantly to the work required to submit and to review papers”. Respondents noted the need to manage dependencies across computational environments, that these notebook formats are not suitable for protected data (such as patient data), and that “different parts of the analysis protocol may require different languages” - this flexibility would need to be accommodated.
However, the benefits of sharing research in these formats were also highlighted: “Having the code available for analysis workflows would really speed up research. For instance, one could copy and improve a workflow for another data set”, and “it could allow an entirely new kind of interaction between authors and readers”. Furthermore, several respondents revealed that they were already composing research manuscripts using these tools, and highlighting that there could be better support of this workflow.
Peer review
Supporting greater transparency of the original workings (data and code) underlying research publications could have implications for peer review. The respondents who had conducted peer review before (129; 84%) said they would be likely to make use of a file format that links the text, code and data during peer review, if this were available (Figure 7). The majority of reviewers would download this file to review the reproducibility of a result (34.7%) whilst 36.2% may do depending on the situation: having the time to do so would be a factor, and this would only be useful for particularly important or suspicious results. The remaining respondents would not (9.5%) or were not sure (19.7%).
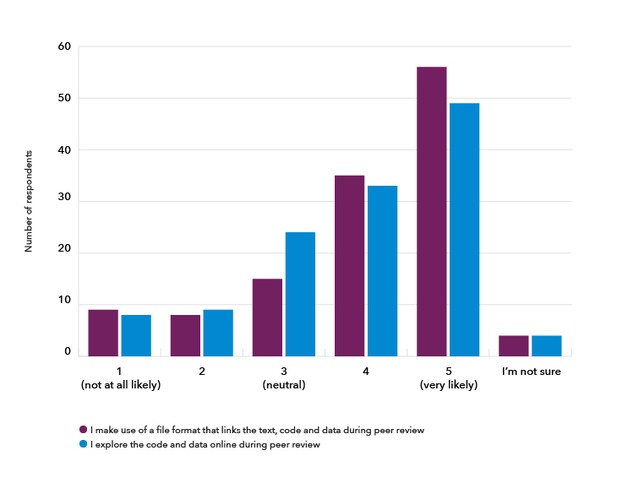
Figure 7. 129 respondents were asked how likely they were to use a file format that links the text, code and data underlying the research manuscript under review, or sections of it, such that they could view the methods and data used to compute results and generate plots, if the publisher were to make this available (purple), and how likely they were to use, explore code and data online during peer review, in order to assess the results and interpretations in the research manuscript without using their own tools and resources (blue).
If we were to make it possible to explore the code and data online during peer review, the majority of reviewers felt they would be likely to use this (Figure 7), noting that this would be favourable if it saved the reviewer’s time and if it meant reducing the learning curve for computational reproducibility. However, some felt it would be better to download and run locally in order to be thorough and to trust the output, whilst others noted the extra burden on reviewers.
Current practises and attitudes to data and code sharing
Sharing research in a computationally reproducible format would require authors to be willing to share the underlying data and code. Therefore, we asked the survey respondents about their current data and code sharing practises.
We first asked what types of data were produced in their research and coded the free-text responses. Most respondents produced simple datasets, such as excel files and time series data (74%), and a substantial number of respondents listed microscopy images (45%), sequencing data (36%), wet lab images (35%), and more complex data types, such as crystal structure data (27%). A small minority of respondents produced personal or clinical data (4%), or other types of data, including mathematical models or computational scripts (7%).
The majority of respondents had shared data (68%) and code (72% of the 115 respondents who used or produced code during their research; Table 2). Data was most frequently shared as supplementary files with a manuscript, whilst code was most often shared via an online open-access repository, such as Github.
| Do you share... | ...data? | ...code? |
|---|---|---|
| Yes, of which: | 103 (68%) | 78 (72%) |
| - Via an online open-access repository | 66 | 55 |
| - As supplementary files with the research manuscript | 77 | 44 |
| - Via a website (lab or personal) | 41 | 33 |
| No | 39 (26%) | 29 (27%) |
| I'm not sure | 9 (6%) | 2 (2%) |
Table 2. Respondents were asked ‘Have you ever shared the data underlying your research as an open-access resource?’ (151 responses), and those who use or produce code were asked ‘Have you ever shared the code underlying your research data analysis or visualisation as an open-access resource?’ (115 responses).
We asked all respondents what prevented them or would prevent them from sharing their research data and code (128 free-text comments for data, 81 for code). The most common reason preventing the sharing of both data and code was the time and effort it takes to make these shareable, including annotation and formatting, with little incentive or perceived benefit. The data file being too large or complex to easily upload or share was frequently identified as a blocker, as was a lack of suitable repositories for certain data. For code, other preventative reasons were the burden of supporting secondary users, fearing that the code is not good enough quality, not having any code to share yet, and the specific lack of a citation practice for shared code. There were also concerns that some research code is too specialist or environment-dependent to be worth sharing. Other blockers identified were related to licensing, intellectual property, or other legal issues, fear of “scooping”, not knowing how, and not being supported by peers to do so. Despite the identified blockers, a substantial minority (22 respondents; 27%) stated they had no reason not to share code.
For the latest in innovation, eLife Labs and new open-source tools, sign up for our technology and innovation newsletter. You can also follow @eLifeInnovation on Twitter.


