Sex-biased regulatory changes in the placenta of native highlanders contribute to adaptive fetal development

  1. State Key Laboratory of Genetic Resources and Evolution, Kunming Institute of Zoology, Chinese Academy of Sciences, Kunming 650223, China
  2. Kunming College of Life Science, University of Chinese Academy of Sciences, Beijing 100101, China
  3. Fukang Obstetrics, Gynecology and Children Branch Hospital, Tibetan Fukang Hospital, Lhasa 850000, China
  4. State Key Laboratory of Primate Biomedical Research, Institute of Primate Translational Medicine, Kunming University of Science and Technology, Kunming, China
  5. Center for Excellence in Animal Evolution and Genetics, Chinese Academy of Sciences, Kunming 650223, China

Editors

  • Reviewing Editor
    Ziyue Gao
    University of Pennsylvania, Philadelphia, United States of America
  • Senior Editor
    Molly Przeworski
    Columbia University, New York, United States of America

Joint Public Review:

This manuscript by Yue et al. aims to understand the molecular mechanisms underlying the better reproductive outcomes of Tibetans at high altitude by characterizing the transcriptome and histology of full-term placenta of Tibetans and compare them to those Han Chinese at high elevations.

The approach is innovative, and the data collected are valuable for testing hypotheses regarding the contribution of the placenta to better reproductive success of populations that adapted to hypoxia. The authors identified hundreds of differentially expressed genes (DEGs) between Tibetans and Han, including the EPAS1 gene that harbors the strongest signals of genetic adaptation. The authors also found that such differential expression is more prevalent and pronounced in the placentas of male fetuses than those of female fetuses, which is particularly interesting, as it echoes with the more severe reduction in birth weight of male neonates at high elevation observed by the same group of researchers (He et al., 2022).

This revised manuscript addressed several concerns raised by reviewers in last round. However, we still find the evidence for natural selection on the identified DEGs--as a group--to be very weak, despite more convincing evidence on a few individual genes, such as EPAS1 and EGLN1.

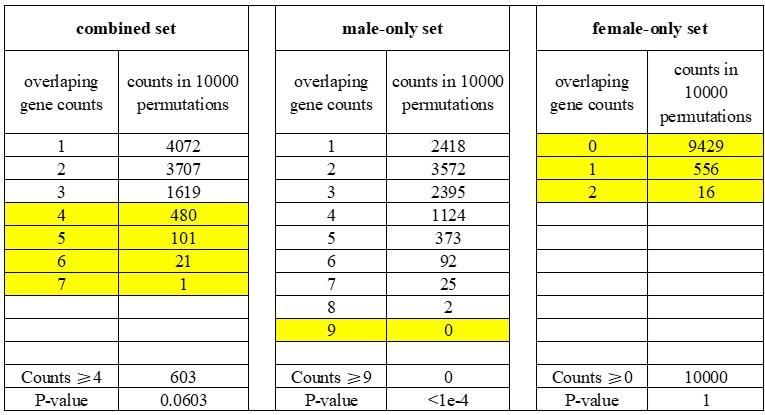
The authors first examined the overlap between DEGs and genes showing signals of positive selection in Tibetans and evaluated the significance of a larger overlap than expected with a permutation analysis. A minor issue related to this analysis is that the p-value is inflated, as the authors are counting permutation replicates with MORE genes in overlap than observed, yet the more appropriate way is counting replicates with EQUAL or MORE overlapping genes. Using the latter method of p-value calculation, the "sex-combined" and "female-only" DEGs will become non-significantly enriched in genes with evidence of selection, and the signal appears to solely come from male-specific DEGs. A thornier issue with this type of enrichment analysis is whether the condition on placental expression is sufficient, as other genomic or transcriptomic features (e.g., expression level, local sequence divergence level) may also confound the analysis.

The authors next aimed to detect polygenic signals of adaptation of gene expression by applying the PolyGraph method to eQTLs of genes expressed in the placenta (Racimo et al 2018). This approach is ambitious but problematic, as the method is designed for testing evidence of selection on single polygenic traits. The expression levels of different genes should be considered as "different traits" with differential impacts on downstream phenotypic traits (such as birth weight). As a result, the eQTLs of different genes cannot be naively aggregated in the calculation of the polygenic score, unless the authors have a specific, oversimplified hypothesis that the expression increase of all genes with identified eQTL will improve pregnancy outcome and that they are equally important to downstream phenotypes. In general, PolyGraph method is inapplicable to eQTL data, especially those of different genes (but see Colbran et al 2023 Genetics for an example where the polygenic score is used for testing selection on the expression of individual genes).

We would recommend removal of these analyses and focus on the discussion of individual genes with more compelling evidence of selection (e.g., EPAS1, EGLN1)

Author response:

The following is the authors’ response to the previous reviews.

Reviewing Editor's comments:

There appears to be several mistakes/missing details in the additional statistical analyses reported in their response to Reviewer #'1 comments:

(1) Detecting differentially expressed genes (DEGs):

Reviewer #1 suggested adding an interaction term between sex and environment (ethnicity) in identifying DEGs. The authors performed ANCOVA analysis with sex and ethnicity as covariates (but not the interaction) and found sex explained more variance. This is not what the reviewer asked for, and the results do not help identify DEGs.

We understand the reviewer’s suggestion about identification of DEGs using sex × ethnicity interaction. However, we could not find an appropriate tool to make such analysis, though we have carefully searched it in the literature. It should be noted that the interaction analysis between sex and environment was only designed to study genotype data rather than gene expression data. Besides, considering that we have added multiple covariates in our DEG detection, adding an interaction term between sex and environment (ethnicity) in identifying DEGs make the formulation too complex to resolve using current tools. Alternatively, we have made a linear regression model to test the explanation of sex for DEG detection in the revision (see details below). We would appreciate if the reviewer could provide any available tools, or previous studies conducting interaction analysis for DEG identification.

(2) Overlap between DEGs and genes under positive selection in Tibetans (TSNGs)

The authors claimed that the overlaps are significantly enriched in "sex-combined" set (p=0.048) and "male-only" set (p=9e-4), but it seems that the authors calculated the p-values incorrectly. Based on the histogram shown in Fig 3R (left penal), at least 750 out of 10,000 permutations led to 4 genes in overlap and there are additional permutations with 5 or more genes in overlap, so the p-value for the sex-combined set cannot be 0.048. In addition, the permutation procedure is somewhat questionable: it is unclear whether randomly sampling 192 genes from the human genome is reasonable choice, without matching for relevant gene features.

As we explained in the response to Reviewer-1, we agree with the reviewer’s point that random sampling of genes in permutation should be extracted from genes expressed in each tissue rather than the entire genome. Based on this updated random sampling procedure, we redid the analysis, and our previous conclusions remain unchanged.

(3) Polygenic adaptation signal based on eQTL information:

The PolyGraph method is designed for highly polygenic traits with causal variants spread across the genome. However, the genetic architecture of the expression of a gene is much less polygenic with at most few cis- eQTLs per gene, so the PolyGraph model does not apply for expression of individual genes. On the other hand, eQTLs for different genes are associated with different "traits", so they cannot be simply aggregated together for PolyGraph analysis. Based on the Methods description, it is unclear how the authors ran the PolyGraph analysis on eQTLs practically and whether this practice is appropriate for detecting polygenic adaptation signal on gene expression.

We understand the reviewer’s concern on polygenic adaptation analysis. In this study, we tested whether the estimated polygenic scores from eQTLs (estimated using sums of allele frequencies at independent eQTLs weighted by their effect sizes) were significantly enriched in Tibetans compared to other populations. The detailed descriptions of polygenic test are provided in the response to Reviewer-1.

Reviewer #1 (Public Review):

The revised manuscript new presented 1) a permutation-based test for the significance of the overlap between DEGs and genes with positive selection signals in Tibetans, and 2) polygenic adaptation test for the eQTLs. I make my suggestions in detail as below:

Major Comments

(1) My previous concern regarding the DEG analysis remains unresolved. Although the authors agreed in their response that the difference between the male- and female-specific DEGs are insufficient to the difference between sex-combined and sex-specific DEGs (Figure S6). However, the results section still states the opposite pattern between males and females as a decisive reason for the difference (p. 9, lines 236-239). Again, I would like to recommend the authors to test alternative ways of analysis to boost statistical power for DEG detection other than simply splitting data into males and females and performing analysis in each subset. For example, the authors may consider utilizing gene by environment interaction analysis schemes here biological sex as an environmental factor.

To evaluate the effect of gene expression of each layer by sex, we adopted two strategies: 1) to calculate the variance explained by sex from the expression data; 2) to evaluate the statistical significance of association between sex from the expression data.

Firstly, we observed a significantly higher variance explained by sex than by ethnicity in six layers of the placenta (see details in our previous response to reviewers).

Then, we performed a linear regression model to test whether gender affects the gene expression. For each gene, a linear regression model was made by using R glm function with sex as covariates: glm (gene expression ~ sex). We discovered 5,865 genes significantly associated with sex, and most of them were located on the sex chromosomes. We observed 62.63% genes overlapped with those genes with opposite differential directions between the sex-combined and the sex-specific analyses.

Considering the opposite direction of DEGs is likely only one of the explanations for the discrepancy between the sex-combined and the sex-specific DEGs, and there might be alternative mechanism for this phenomenon, we have tune down the description of this point in the revised manuscript:

“Considering 62.63% of DEGs (248/396) with an opposite direction of between-population expression divergence in males and females, respectively (Figure S6), we reckon that there might be other factors such as sample size or cell composition affecting the identification of DEGs, which could cancel out the differences in the sex-combined analysis.” (Page 9)

(2) Multiple testing schemes are still sub-optimal in some cases. Most of all, the p-values in the WGCNA analysis (p. 11), the authors corrected for the number of traits (n=12) after adjusting for the correlation between them. However, they did not mention whether they counted for the number of modules they tested at all (n=136 and 161 for males and females, respectively). Whether they account for the number of modules will make a substantial difference in the significance threshold, please incorporate and describe a proper multiple testing scheme for this analysis.

We understand the reviewer’s point. Indeed, for multiple testing schemes, we considered both the number of traits and the number of modules. For the number of modules, multiple testing correction is already imbedded in WGCNA, as described in the published studies (Li et al. 2018; Zeng et al. 2023).

(3) Evidence for natural selection on the observed DEG pattern is still weak and not properly described.

(1) For the overlap between DEGs and TSNGs, the authors introduced a permutation-based test, but used a total set of genes in the human genome as a comparison set (p. 25, lines 699-700). I believe that the authors should sample random sets of genes from those already expressed in each tissue to make a fair comparison.

We agree with the reviewer’s point that random sampling of genes in permutation should be extracted from genes expressed in each tissue, which is a fair comparison between the observed and the simulated counts of the overlapped genes.

Therefore, for each permutation, we randomly extracted 192 genes from all the placenta expressed genes identified from the seven layers (17,284 genes in total), and we overlapped them with DEGs of the three sets (female + male, female only, and male only) and counted the gene numbers. After 10,000 permutations, we constructed a null distribution for each set, and found that the overlaps between DEGs and TSNGs were significantly enriched in the “sex-combined” set (p-value = 0.0123) and the “male-only” set (p-value < 1e-4), but not in the “female-only” set (p-value = 0.0572) (Figure R1). This result suggests that the observed DEGs are significantly enriched in TSNGs when compared to the set of random sampling, especially for the DEGs from the “male-only” set.

Author response image 1.

The distribution of 10,000 permutation tests of counts of the overlapped genes between 192 TSNGs and the DEGs randomly selected from the expressed genes in the placenta. The red-dashed lines indicate the observed values based on the randomly selected DEGs.

(2) The entire polygraph analysis for polygenic adaptation is poorly described. The current version of the Methods does not clarify i) for which genes the eQTLs are discovered, 2) how the authors performed the eQTL analysis, iii) how the authors polarized the effect, and iv) how they set up a comparison between the eQTLs and the others.

Considering the RNA-seq data of placenta mostly represent the transcriptomes of the newborns according to our analysis on maternal-fetal compositions of each dissected layer, we conducted eQTL analysis using the fetal genotypes and the placental tissue gene expression data (TPM) using R package MatrixEQTL (https://github.com/andreyshabalin/MatrixEQTL), and the altitude and maternal age were taken as covariates. We take a window 1 Mb upstream and 1 Mb downstream around each SNP to select genes or expression probes to test. Associations between these SNP–gene combinations are calculated using linear model. This tool can distinguish local (cis-) and distant (trans) eQTLs. We performed separate corrections for multiple testing.

Finally, we detected 5,251 eQTLs (involving 319 eGenes), covering the SNPs significantly associated with gene expression (p-value < 5e-8). To identify the signatures of polygenic selection in Tibetans using eQTL information, we removed those SNPs in linkage disequilibrium (r2 > 0.2 in 1000 Genome Project) and obtained 176 independent eQTLs as input into PolyGraph (Racimo et al. 2018). QB (Racimo et al. 2018) and QX (Berg and Coop 2014) framework are used in Polygraph to determine whether the estimated polygenic scores exhibit more variance among populations than null expectation under genetic drift, by retrieving the summary statistics from the eQTL set.

In this study, we focused on testing whether the estimated polygenic scores from eQTLs (estimated using sums of allele frequencies at independent eQTLs weighted by their effect sizes) were significantly enriched in Tibetans compared to other populations. The significance was evaluated by comparing to 10,000 sets of the control SNPs. Each set of control SNPs was randomly drawn from the genomic SNPs, and contained an equal number of SNPs as the eQTLs matched one-to-one by minor allele frequency.

The PolyGraph result showed that Tibetans have a clear signature of polygenic selection on gene expression (Bonferroni-corrected p-value = 0.003, Figure S12). In other words, the frequency of alleles associated with gene expression (up-regulation or down-regulation) were specifically enriched in Tibetans, a signal of positive selection.

Minor comments (1) In Figure S1, the amount of variance explained by PC1 and PC2 need to be corrected. PC1 explains less variance than PC2 (0.11 vs 0.68%).

It was a typing error that mixed up the variances between PC1 and PC2. We have corrected it in the revised version.

(2) In the section "Sex-biased expression divergence ..." (p. 8), the authors are using the term "gender" instead of sex. Considering that they are talking about the biological sex of each infant, I believe that sex is a more appropriate term to be used than gender.

Following the reviewer’s suggestion, we rephrased “gender” as “sex” in the revised manuscript to describe the biological differences between females and males.

Reviewer #3 (Public Review):

More than 80 million people live at high altitude. This impacts health outcomes, including those related to pregnancy. Longer-lived populations at high altitudes, such as the Tibetan and Andean populations show partial protection against the negative health effects of high altitude. The paper by Yue sought to determine the mechanisms by which the placenta of Tibetans may have adapted to minimise the negative effect of high altitude on fetal growth outcomes. It compared placentas from pregnancies from Tibetans to those from the Han Chinese. It employed RNAseq profiling of different regions of the placenta and fetal membranes, with some follow-up of histological changes in umbilical cord structure and placental structure. The study also explored the contribution of fetal sex in these phenotypic outcomes.

A key strength of the study is the large sample sizes for the RNAseq analysis, the analysis of different parts of the placenta and fetal membranes, and the assessment of fetal sex differences.

A main weakness is that this study, and its conclusions, largely rely on transcriptomic changes informed by RNAseq. Changes in genes and pathways identified through bioinformatic analysis were not verified by alternate methods, such as by western blotting, which would add weight to the strength of the data and its interpretations. There is also a lack of description of patient characteristics, so the reader is unable to make their own judgments on how placental changes may link to pregnancy outcomes. Another weakness is that the histological analyses were performed on n=5 per group and were rudimentary in nature.

For the three weaknesses raised by the reviewer, here are our responses:

(1) Considering that our conclusions largely rely on the transcriptomic data, we agree with reviewer that more experiments are needed to validate the results from our transcriptomic data. However, this study was mainly aimed to provide a transcriptomic landscape of high-altitude placenta, and to characterize the gene-expression difference between native Tibetans and Han migrants. The molecular mechanism exploration is not the main task of this study, and more validation experiments are warranted in the future.

(2) For the lack of description of patient characteristics, actually, we provided three-level results on the placental changes of Tibetans: macroscopic phenotypes (higher placental weight and volume), histological phenotypes (larger umbilical vein walls and umbilical artery intima and media; lower syncytial knots/villi ratios) and transcriptomic phenotypes (DEG and differential modules). Combined with the previous studies, these placenta changes suggest a better reproductive outcome. For example, the placenta volume shows a significantly positive correlation with birth weight (R = 0.31, p-value = 2.5e-16), therefore, the larger placenta volume of Tibetans is beneficial to fetal development at high altitude. In addition, the larger umbilical vein wall and umbilical artery intima and media of Tibetans can explain their adaptation in preventing preeclampsia.

(3) For the sample size of histological analyses, we understand the reviewer’s concern that 5 vs. 5 samples are not very large in histological analyses. This is because it was difficult to collect high-altitude Han placenta samples, and we only got 13 Han samples, from which we selected 5 infant sex matched samples.

Minor point:

I feel the authors have responded well to the other reviewer comments. However, I am disappointed that the authors did not address my comment related to the validation of their RNAseq data. In particular, they failed to add new data that verifies and supports their RNAseq findings on pathways affected. This is imperative as their conclusions are based solely on the RNAseq analysis. The only other comment I have is that they should add a description of all abbreviations, including those in the supplementary information (like Table S12).

For experimental validation of transcriptome, we understand the concern of reviewer. However, as we mentioned before, this study was mainly aimed to provide a transcriptomic landscape of high-altitude placenta, the molecular mechanism exploration is not the main task of this study, and more validation experiments are warranted in the future. Actually, we have tune down the description of power from transcriptomic data for explanation of biological difference, and called for the further functional validations in the future:

“the transcriptome data is insufficient to explain the underlying molecular mechanisms of genetic adaptation in Tibetans. Future single-cell transcriptome analysis and functional validations of the candidate genes are warranted to reveal the responsible cell types and the molecular pathways.” (highlighted in Page 20)

For abbreviations of the manuscript, according to the reviewer’s suggestion, we added descriptions of all abbreviations of this study in corresponding position (Table S1 and S12).

References

Berg JJ, and Coop G (2014). A population genetic signal of polygenic adaptation. PLoS Genet 10(8): e1004412.

Li J, et al. (2018). Application of Weighted Gene Co-expression Network Analysis for Data from Paired Design. Sci Rep 8(1): 622.

Racimo F, Berg JJ, and Pickrell JK (2018). Detecting Polygenic Adaptation in Admixture Graphs. Genetics 208(4): 1565-1584.

Zeng JF, et al. (2023). Functional investigation and two-sample Mendelian randomization study of neuropathic pain hub genes obtained by WGCNA analysis. Frontiers in Neuroscience 17.

  1. Howard Hughes Medical Institute
  2. Wellcome Trust
  3. Max-Planck-Gesellschaft
  4. Knut and Alice Wallenberg Foundation