Decisions about the research reviewed by eLife are all made by editors who are active researchers in biology and medicine. As eLife works to make peer review more equitable, we also endeavour to better embody the same principle in how we grow eLife’s editorial boards. We aspire to have an editorial community that reflects the diverse, international research communities that we serve. We are committed to understanding and addressing the biases that exist both in our processes and in research more broadly that mean that some groups remain under-represented among our decision-makers while others are over-represented.
To understand our progress in these areas and where we have work to do, we recently invited all eLife editors to tell us about their identities and backgrounds via an optional online form. Overall, we received more than 290 responses, representing 40% of all eLife editors, or 51% of Senior Editors and 36% of Reviewing Editors. With one exception, all questions were answered by at least 92% of respondents.
Together the responses, described below, give an insight into the visible and invisible diversity of our editorial community. The incompleteness of the data does mean it is possible that the results are not representative of our editorial boards overall, especially as it is perhaps reasonable to assume that someone’s motivation or comfort around sharing this kind of information is not independent from their personal identities. This is an issue that we will be exploring further. Nonetheless, where we could compare the new data to reliable existing data, we have since confirmed that the self-reported responses do cover a representative cross-section of editors in terms of geography and, for Reviewing Editors, career stage (see next two sections for details).
Questions and comments about this report are welcome. Please feel free to share your feedback using the annotation tool or via email: edi@elifesciences.org. Anonymous feedback may also be shared via this form.
Report prepared by:
Stuart King, Research Culture Manager
Geography
Research is a global endeavour. Our existing records provide reliable information about where our editors are based around the world. We know that 57% of all eLife editors work in North America, 29% work in Europe and 11% in Asia. Researchers in Oceania make up 3% of our editors, while our editors in Africa and South America combined represent less than 1% (Figure 1). Though our editorial community has grown by 30% compared to the start of last year – with almost a third of our editors having joined eLife since January 2020 – the geographic distribution has largely remained constant, with the proportion of editors in each region changing by about 1% at most.
The self-reported responses show a very similar geographic distribution to our existing data, and include responses from editors in 28 of the 35 countries currently represented on our editorial boards. This coverage reassuringly suggests that national differences in attitudes related to sharing personal information have not significantly biased the responses we have received.
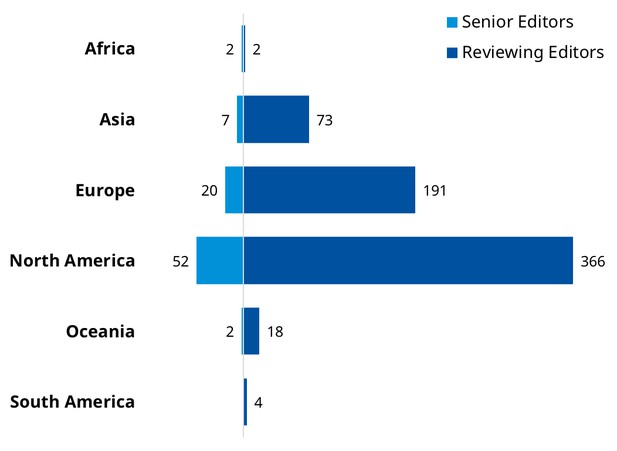
Figure 1: Geographic distribution of eLife editors by continent. Based on the country of primary affiliation for 654 Reviewing Editors and 83 Senior Editors (737 editors total). For reporting purposes, eLife’s Editor-in-Chief and five Deputy Editors are considered to be Senior Editors. Data correct as of April 1, 2021.
Career stage
eLife is acutely aware of the unique pressures faced by researchers at the early and middle stages of their careers. Over the last few years, we have recorded the career stages of eLife’s Reviewing Editors, using the following definitions in which an independent investigator refers to someone who has secured funding to support a research group:
- Early-career researchers have no more than five years’ experience as an independent investigator
- Mid-career researchers have between six and fifteen years of experience as independent investigators
- Late-career researchers are independent investigators with more than fifteen years of such experience
Among the 262 editors who shared details about their career stage via the self-reporting form, 8% are early-career researchers, 42% are mid-career researchers and 50% are late-career researchers.
Historically, late-career researchers made up the majority of eLife Senior and Reviewing Editors. In recent years, however, we have set about creating opportunities for more researchers to participate on our editorial boards regardless of their career stage. Among the editors who joined eLife’s editorial boards most recently, around 17% are early-career researchers while 54% are mid-career researchers (Figure 2). Broken down by the editor’s role, the self-reported data indicate that, overall, early- and mid-career researchers now make up a third of the Senior Editors (33%) and more than half of the Reviewing Editors (56%).
As for the geographic data (see above), the distribution of the self-reported career stages is consistent with our previous records, suggesting we have responses from a representative cross-section of editors at different stages in their research careers.
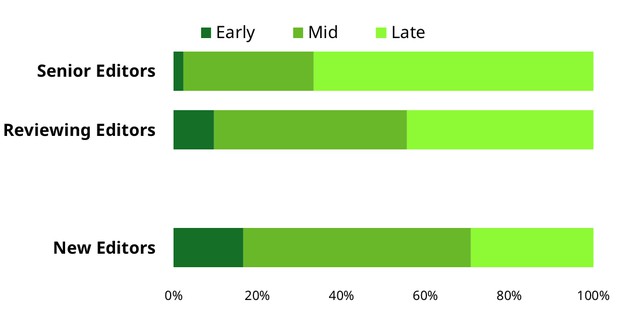
Figure 2: Career-stage distribution of eLife editors. Early-career researchers have up to five years’ experience as an independent investigator; mid-career researchers are independent investigators with between six- and fifteen-years of experience; and late-career researchers are independent investigators with more than fifteen years of experience. Based on self-reported responses from 42 Senior Editors and 207 Reviewing Editors. “New editors” includes the 72 self-reported responses from editors who have joined since the start of January 2020. Figures exclude editors who didn’t provide a year of independence or selected “Prefer not to say”. For reporting purposes, eLife’s Editor-in-Chief and Deputy Editors are considered to be Senior Editors. Data correct as of April 1, 2021.
Disability and long-term health conditions
Disabled researchers are vastly underrepresented in science and become less and less represented as you move along a traditional academic career path. For example, while disabled people and people with disability are thought to make up around one-fifth of working-age populations, based on where data is available, they likely represent less than 5% of full-time academics at institutions in the United States and United Kingdom.
This lack of representation relative to the wider population is also reflected in our editorial boards. Overall, 1.4% of eLife editors identify as disabled (out of 288 responses), while 3.2% reported experiencing barriers or limitations in their day-to-day activities related to a disability, health condition or impairment, meaning that they meet the Equality Act 2010 definition of a person with disability (out of 285 responses).
Family educational background
Education is a driver of social mobility, yet university student populations regularly do not reflect the wider communities from which they are drawn. Students from wealthy backgrounds, for example, are more likely than students from lower income backgrounds to go to university. Students with more educated parents also pursue a degree more often than those from families with few qualifications, while “first-generation students”, who are the first in their family to attend university, commonly experience barriers that are not faced by students with graduate parents.
Among eLife editors, 26% were first-generation students (out of 289 responses), while 70% had, at the age of 18, at least one parent or guardian with a university degree or equivalent (out of 286 responses). This second figure is comparable to biology professors in the United States, for example, where 68% had parents who held a degree or higher, but is considerably more than, for example, the general population’s figure of 22%.
Gender identity
Exact figures vary from region to region, but women, on average, remain less represented than men in the scientific workforce of most countries. People with minority genders are also thought to be underrepresented in scientific careers, and are very likely to have experienced exclusionary behaviours in the workplace.
At eLife, we want our editorial boards to provide an equitable experience for people of all genders. As part of this, we have been working towards gender parity for several years. However, much of the data we used previously to monitor and report on these efforts was not self-reported. This means that figures that we have shared in the past are possibly inaccurate, as some editors may have inadvertently been misgendered when compiling the data. We acknowledge now how this practice was exclusionary, and have since committed to only using self-reported gender data for these purposes going forward.
In total, 287 editors shared their gender via the form: 131 are women (45.6%); 155 are men (54.0%) and one is non-binary (0.3%; Figure 3). One eLife editor also identifies as trans (0.4%, out of 270 responses); trans is an umbrella term for people whose gender identity differs from what is typically associated with the sex they were assigned at birth.
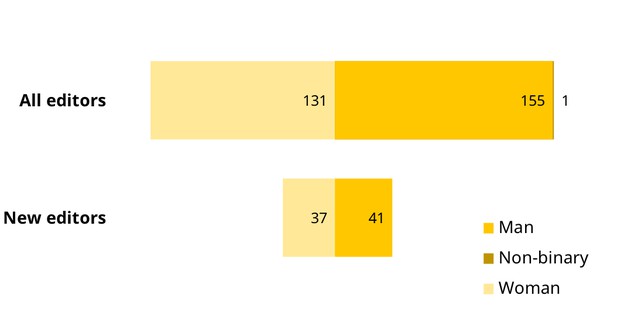
Figure 3: Gender identity of eLife editors. “All editors” includes self-reported gender from 287 individuals, including both Senior and Reviewing Editors. “New editors” includes 78 responses from editors who joined eLife since January 1, 2020. Based on self-reported data. Data correct as of April 1, 2021.
The lack of historical self-reported data on gender data means we cannot reliably report on how the gender balance of our editors has changed over time. There are indications, however, that our recruitment over the past year would not have significantly changed the gender balance we see at present; within the 78 responses from new editors who joined since the start of 2020, 47% are women and 53% are men (Figure 3).
Gender balance among our editors varies with career stage. Men outnumber women among the late- or mid-career editors, while women outnumber men among early-career editors (Figure 4). This trend is also evident in gender differences in the lengths of our editors’ research careers: the average man serving as an eLife editor has 20 years of experience since becoming an independent investigator, compared to 15 years for the average woman who is an eLife editor.
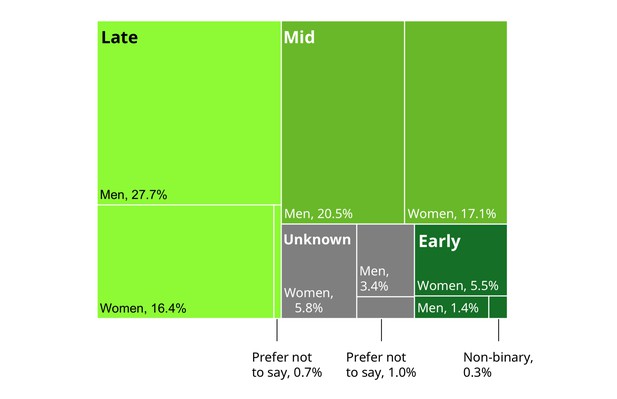
Figure 4: Career stage of eLife editors by gender identity. Based on self-reported responses from 292 editors. Definitions of career stages are the same as those in Figure 2. Data correct as of April 1, 2021.
Race and ethnicity
Up until last year, our efforts to address the lack of diversity on our editorial boards had not specifically considered race or ethnicity. We changed that in 2020, with a focus on recruiting more Black scientists. We are confident that we have since made progress in this area, and we are looking to use self-reported race and ethnicity data to help us build on this and monitor our progress.
Race and ethnicity are two concepts related to human ancestry; both are social constructs and thus how they are conceived often depends on the individual’s unique social context. Overall, 15% of eLife editors self-identify as a member of a minority or underrepresented group based on their race or ethnicity (Figure 5). When considering how this intersects with gender, this breaks down as 18% of women and 14% of men. As before, while our data does not yet permit us to report how this has changed over time, there is evidence of our recent refocusing of our recruitment process within the self-reported responses. Among editors who joined since the start of 2020, 23% identify as a member of a minority or underrepresented group based on their race or ethnicity.
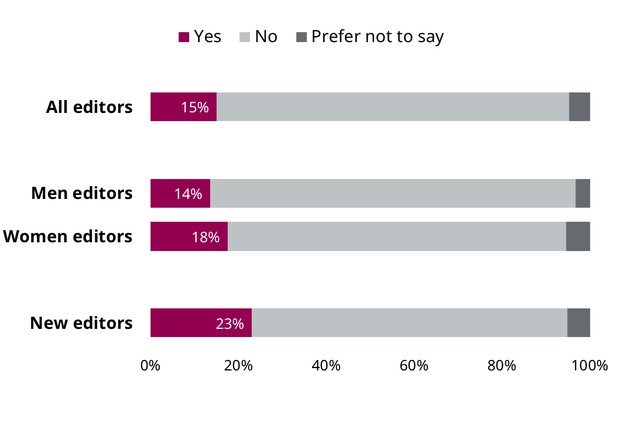
Figure 5: Percentage of eLife editors who identify as a member of a minority or underrepresented group based on their race or ethnicity. Based on self-reported responses from 292 editors overall, with a breakdown for gender identity (for 155 men and 131 women) and for 78 ‘new editors’ who started since January 1, 2020. Data correct as of April 1, 2021.
There is no accepted framework or recognised best practice for reporting on race or ethnicity across international groups: the language and terminology used varies from person to person, within and between countries, and continues to change. To approach collecting this data in an inclusive way, we therefore provided editors with the option to describe their race and ethnicity in their own words via an open-ended question. In total, 159 editors did so and, after correcting for variations in spelling and punctuation, there were 56 unique answers. These ranged from single words, to short lists that included percentages of different backgrounds, to longer answers that provided the individual’s personal experiences of their identity.
Collecting this data in this format has its advantages and disadvantages. It does, however, allow us to reconsider the responses against a number of different frameworks that are currently under development or that may be developed in the future. It can also help inform us where the options used in existing frameworks may fall short or be unsuitable for different populations. For the purposes of this report, we have initially considered the data against an amalgamation of groupings based on different national census questions (Figure 6). We anticipate that we will revise this approach in the future, in line with updated recommendations and community feedback.
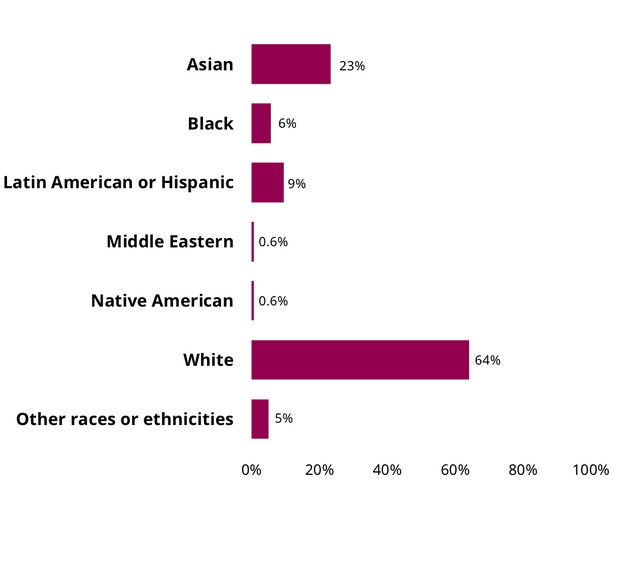
Figure 6: Racial and ethnic diversity among eLife editors. Figure based on self-reported responses from 159 editors. “Asian” also includes people who specifically identify as East Asian, South Asian or South East Asian. “Black” also includes people who identify as African American. “Latin American or Hispanic” also includes people who identify as either Latina, Latino or Latinx. “White” also includes people who identify as Caucasian or of European descent. “Other races and ethnicities” includes people who described their race or ethnicity as “mixed”, Jewish or as a “visible minority”. Respondents could give multiple responses when describing their race or ethnicity; thus, the total exceeds 100%. Data correct as of April 1, 2021.
It is also worth noting that this open-ended question had a lower response rate than any other question on the form, meaning that this data is possibly less reliable. There also appears to be a bias in who answered this question. Specifically, 86% of editors who identified as a member of a racial or ethnic minority or underrepresented group also described their race or ethnicity, compared to 50% of editors who did not identify as such. This means that our data potentially overestimates the proportion of editors from underrepresented and minority groups and underestimates those from majority groups. This is something that we will specifically monitor and report on again in the future.
Sexual orientation
Though research on this element of identity is scarce and complicated, estimates suggest that people who identify as a sexual minority are typically less represented in the scientific workforce than expected. Within our editorial community, 4.1% of eLife editors identify as a member of a minority group based on their sexual orientation (Figure 7). For comparison, in surveys of wider populations, around 2.2% to 5.2% of people identify as bisexual, lesbian or gay, while an additional small percentage of people identify with other non-heterosexual identities.
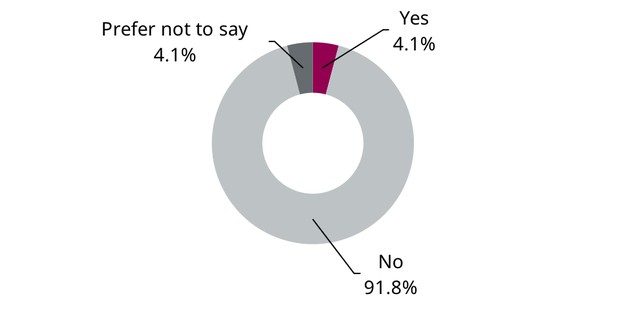
Figure 7: Percentage of eLife editors who identify as a member of a minority or underrepresented group based on their sexual orientation. Based on self-reported responses from 292 editors. Data correct as of April 1, 2021.
Next steps
By providing a means for editors to share information about their identities and backgrounds, we are now better equipped to design actions to reduce inequities in eLife’s processes and practises. Going forward, the data will guide how we grow our editorial community and will allow us to more readily report on the success and failings in our efforts to improve the representation of wider research communities among our editors. We will also use the data to assess the extent to which our editorial boards provide an equitable experience for all, and to monitor our progress in making peer review itself fairer.
As a more complete understanding of the individuals who make up our editorial community would assist us in all of these tasks, in parallel, we will look to encourage more responses from existing editors and are taking steps to integrate the self-reporting form into the routine onboarding process for new editors too.
Finally, while our immediate ambitions are to better reflect the diversity of research communities and provide an equitable experience for all within eLife’s editorial boards, we are also committed to ongoing efforts to promote greater equity, diversity and inclusion for those working in research overall. Change will take time, and we are prepared to work until we see that change realised.


