Research: Sci-Hub provides access to nearly all scholarly literature
- University of Pennsylvania, United States
- Bidwise, Inc, United States
- Deakin University, Australia
- University of Texas at Austin, United States
- Goethe University, Germany
Figures
Figure 1 with 1 supplement
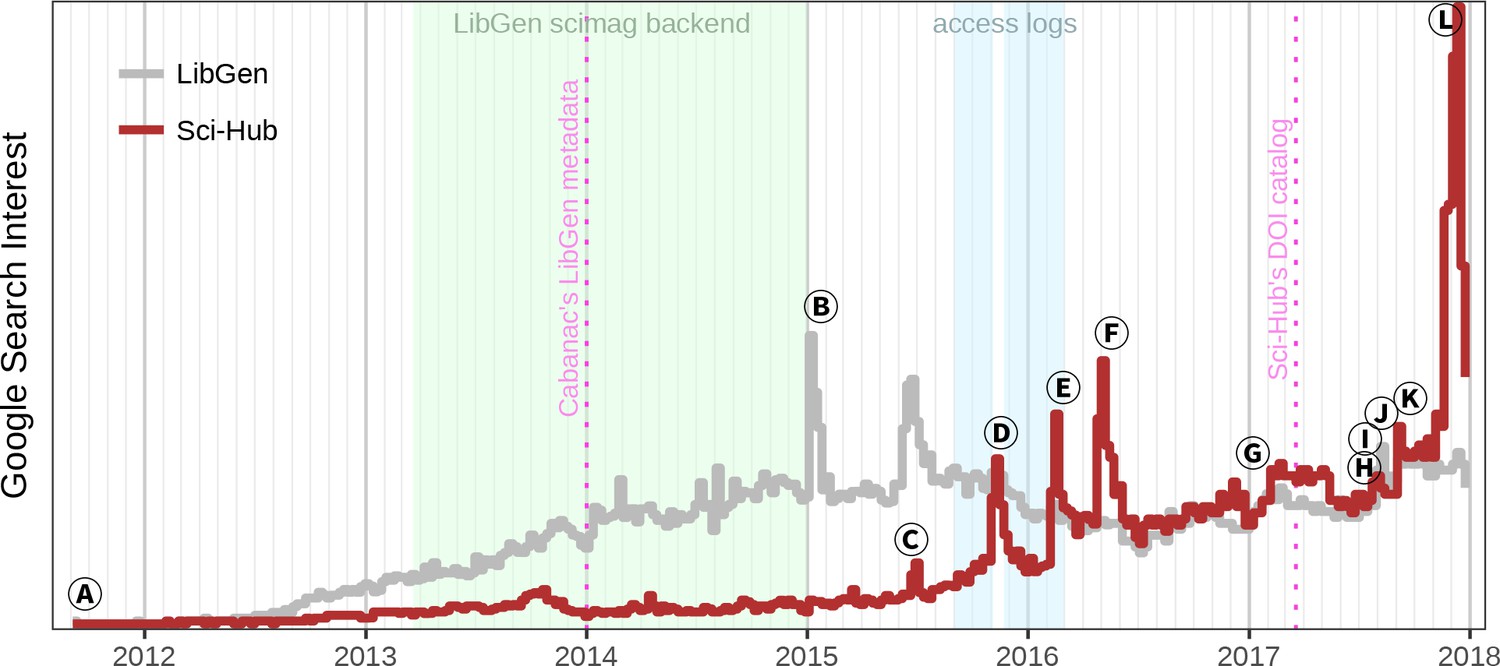
The history of Sci-Hub.
Weekly interest from Google Trends is plotted over time for the search terms “Sci-Hub” and “LibGen”. The light green period indicates when Sci-Hub used LibGen as its database for storing articles (Elbakyan, 2017). Light blue indicates the collection period of the Sci-Hub access logs that we analyze throughout this study (Elbakyan and Bohannon, 2016). Based on these logs and newly released logs for 2017, Figure 1—figure supplement 1 shows the number of articles downloaded from Sci-Hub over time, providing an alternative look into Sci-Hub’s growth. The first pink dotted line represents the collection date of the LibGen scimag metadata used in Cabanac’s study (Cabanac, 2016; Cabanac, 2017). The second pink dotted line shows the date of Sci-Hub’s tweeted DOI catalog used in this study. The events indicated by the letters (A), (B), (C) … are explained in the main text.
Figure 1—figure supplement 1
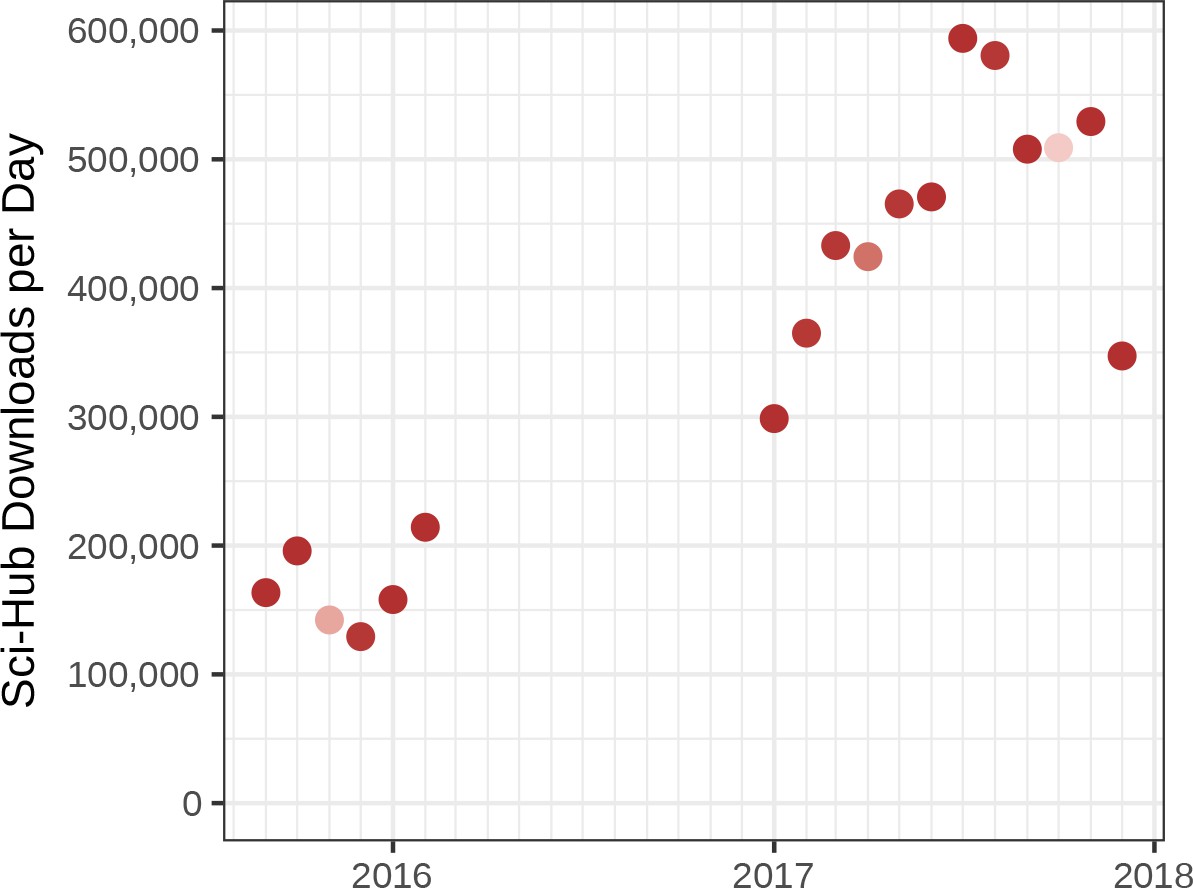
Downloads per day on Sci-Hub for months with access logs.
The number of articles downloaded from Sci-Hub is shown over time. Sci-Hub access logs were combined from two releases: (Elbakyan and Bohannon, 2016) covering 27,819,963 downloads from September 2015 to February 2016 and (Tzovaras, 2018) covering 150,875,862 downloads from 2017. The plot shows the average number of downloads per day for months with data. There were 54 days within the collection periods without any logged access events, due presumably to service outages or server misconfiguration. Hence, we ignored days without logs when computing monthly averages. Point color indicates the proportion of days with logs for a given month. For example, November 2015 and October 2017, which were missing logs for 17 and 23 days respectively, are thus lighter. The December 2017 dropoff in downloads likely reflects the effect of domain suspensions that occurred in late November (Silver, 2017). Unlike the Sci-Hub log analyses elsewhere in this study, this plot does not filter for valid articles (i.e. DOIs in our Crossref-derived catalog of scholarly literature).
Figure 2
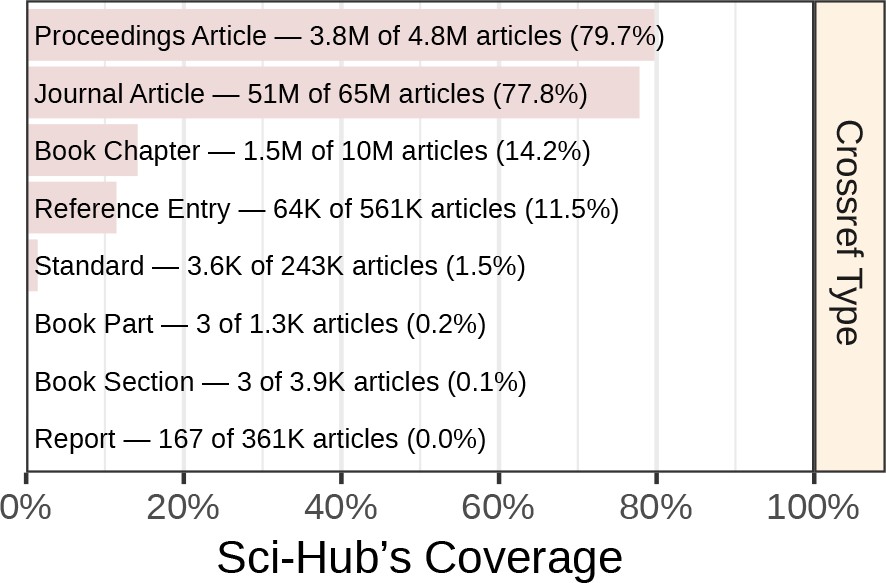
Coverage by article type.
Coverage is plotted for the Crossref work types included by this study. We refer to all of these types as “articles”.
Figure 3
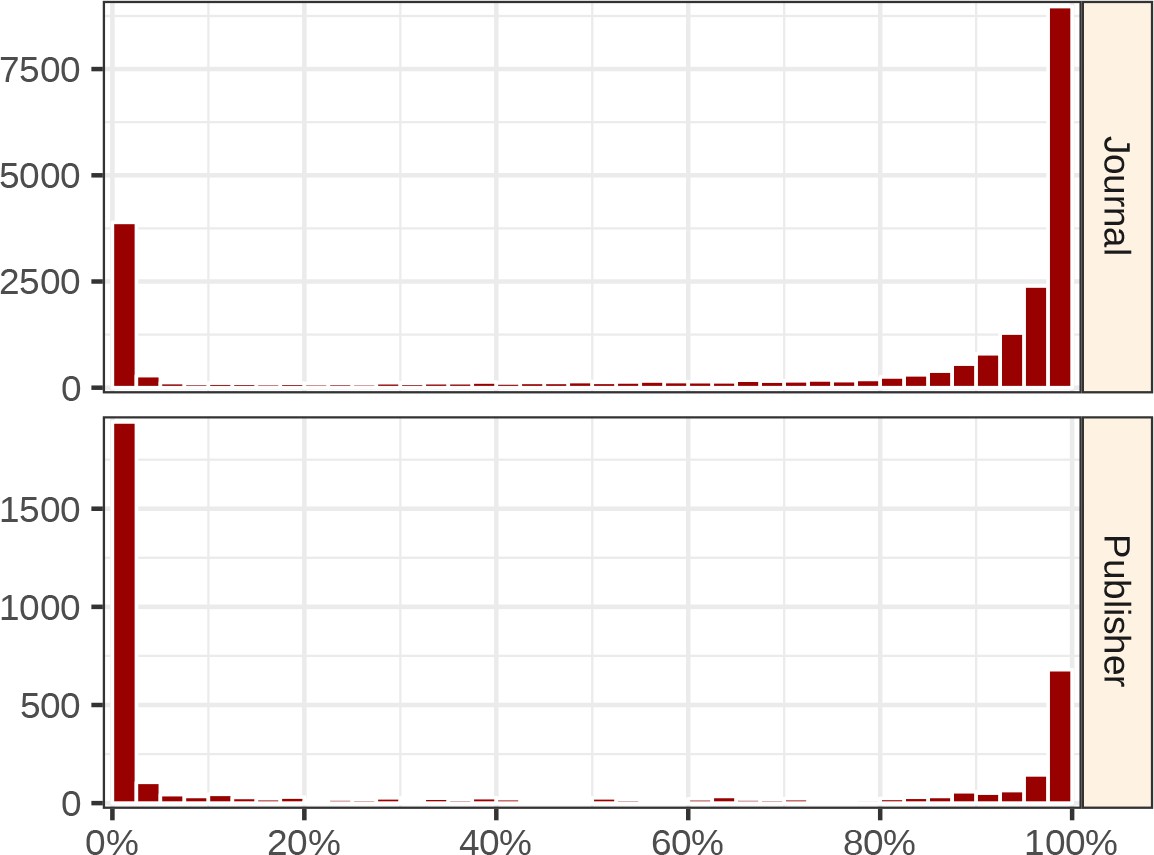
Distributions of journal & publisher coverages.
The histograms show the distribution of Sci-Hub’s coverage for all 23,037 journals (top) and 3,832 publishers (bottom). Each bin spans 2.5 percentage points. For example, the top-left bar indicates Sci-Hub’s coverage is between 0.0%–2.5% for 3,892 journals.
Figure 4 with 1 supplement
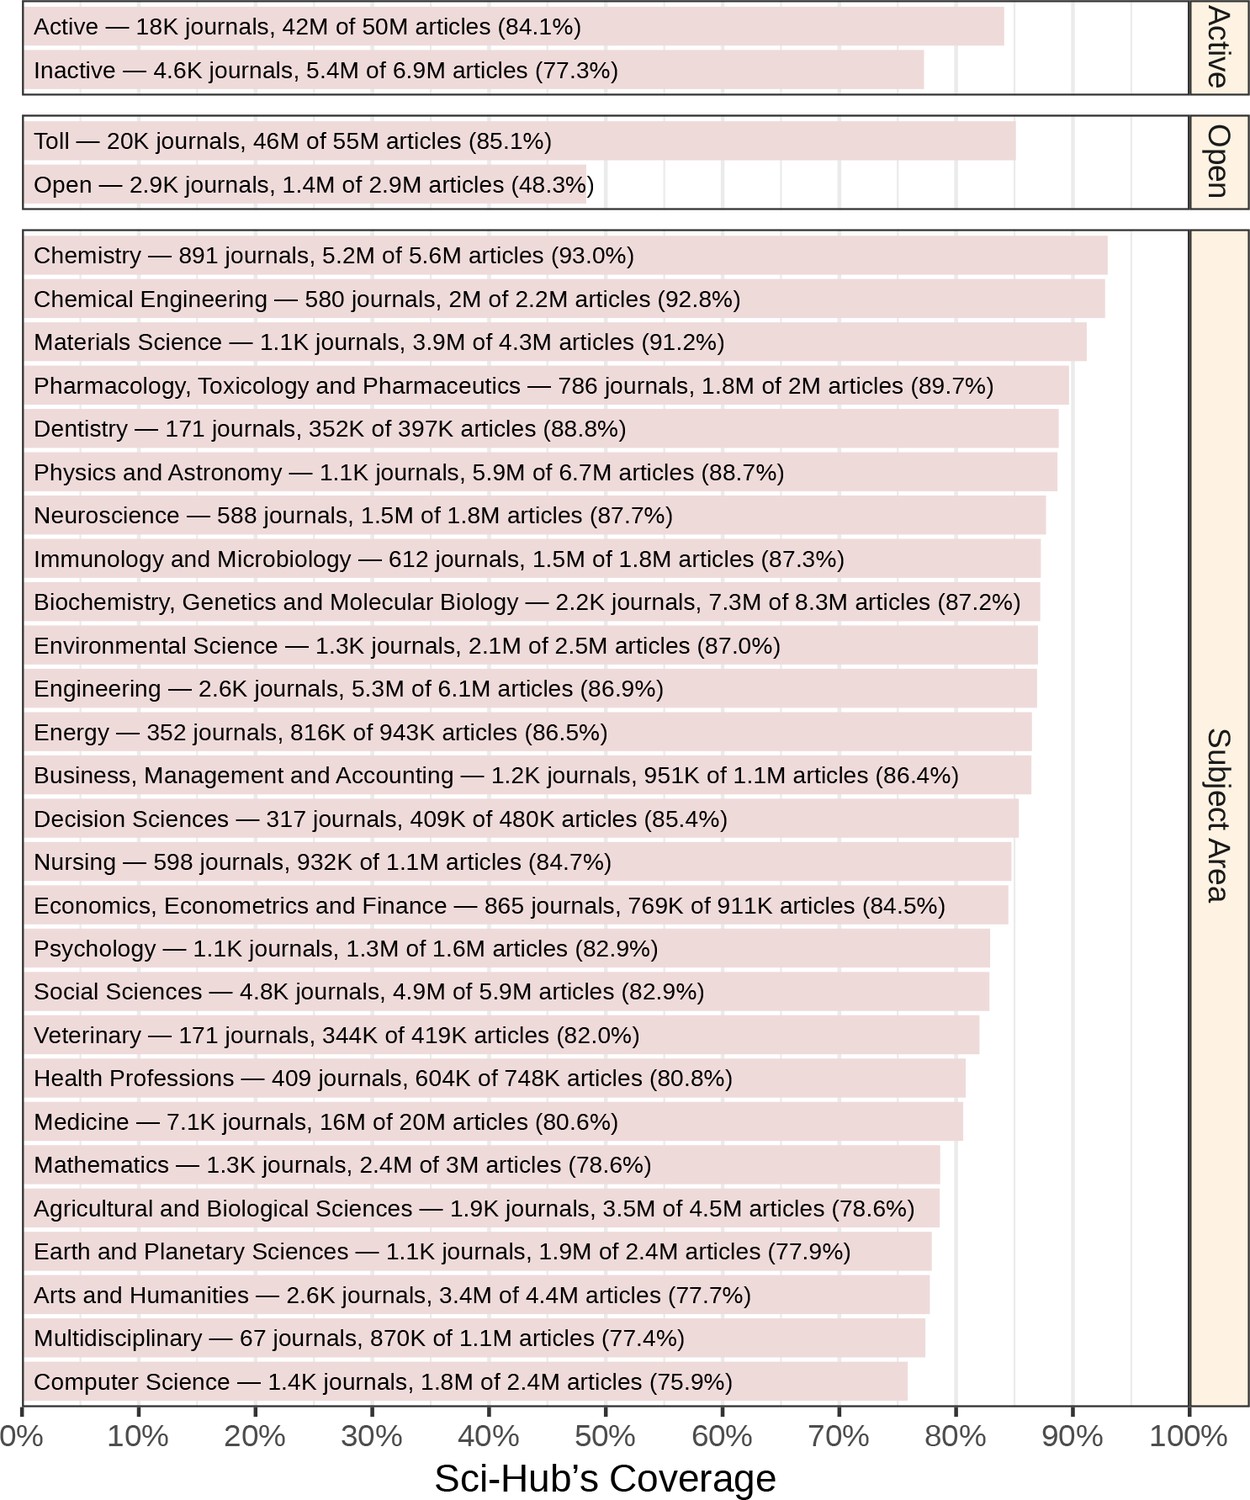
Coverage by journal attributes.
Each bar represents Sci-Hub’s coverage of articles in journals with the specified attributes, according to Scopus. Active refers to whether a journal still publishes articles. Open refers to whether a journal is open access. Subject area refers to a journal’s discipline. Note that some journals are assigned to multiple subject areas. As an example, we identified 588 neuroscience journals, which contained 1.8 million articles. Sci-Hub possessed 87.7% of these articles.
Figure 4—figure supplement 1
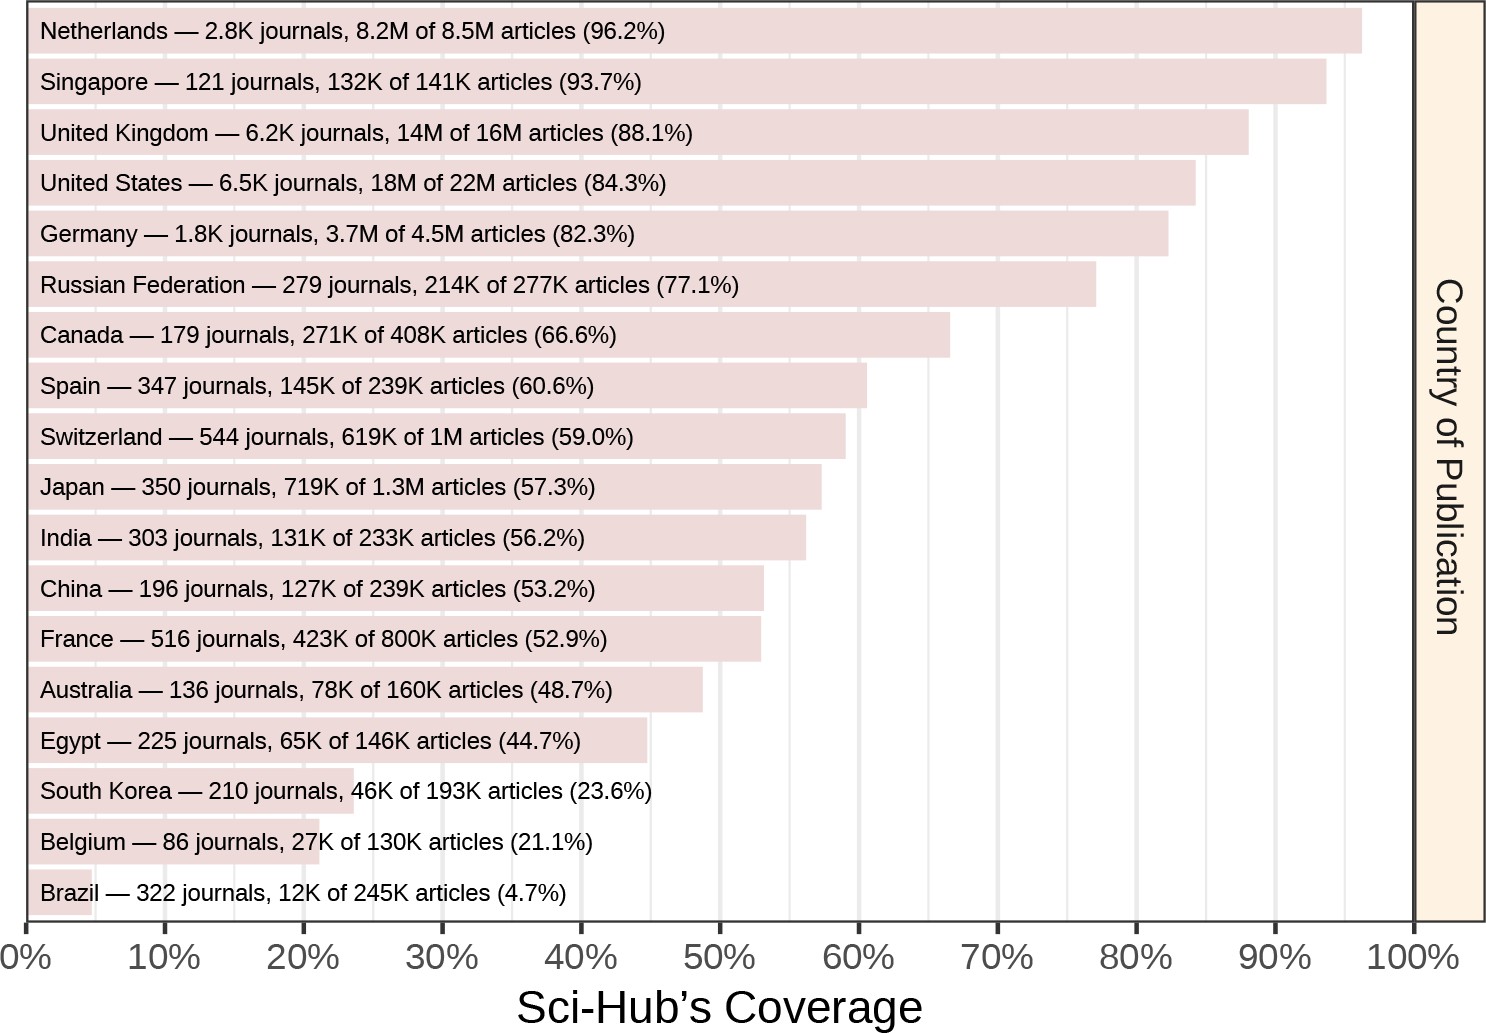
Coverage by country of publication.
Scopus assigns each journal a country of publication. Sci-Hub’s coverage is shown for countries with at least 100,000 articles.
Figure 5
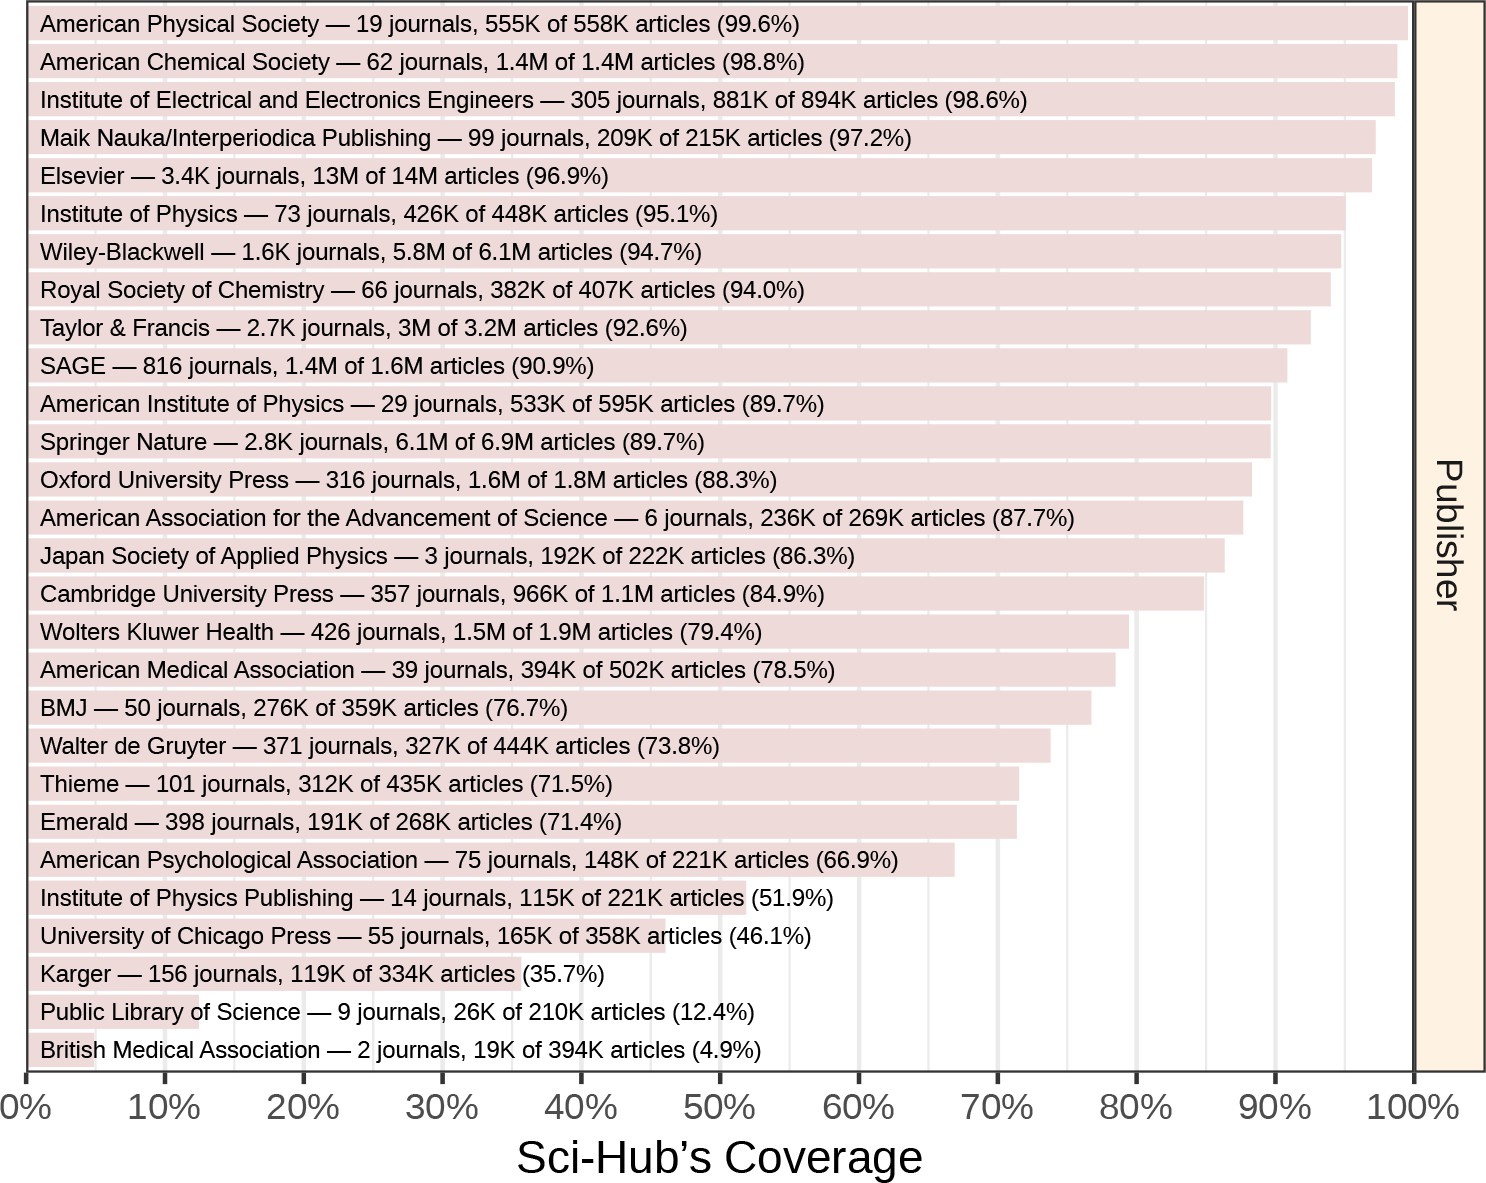
Coverage by publisher.
Article coverage is shown for all Scopus publishers with at least 200,000 articles.
Figure 6 with 1 supplement
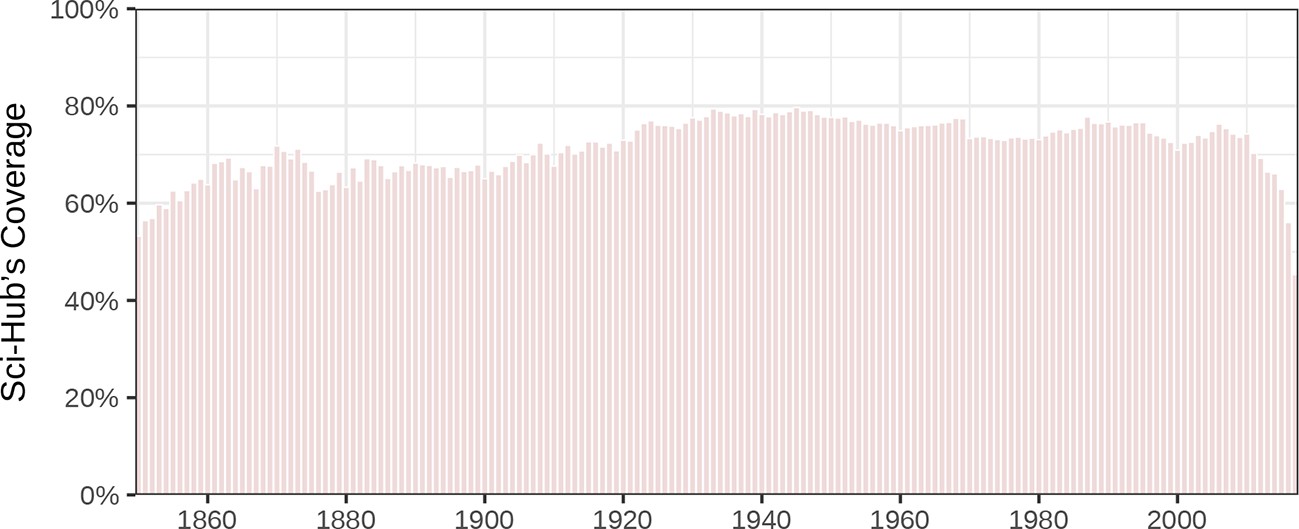
Coverage of articles by year published.
Sci-Hub’s article coverage is shown for each year since 1850.
Figure 6—figure supplement 1
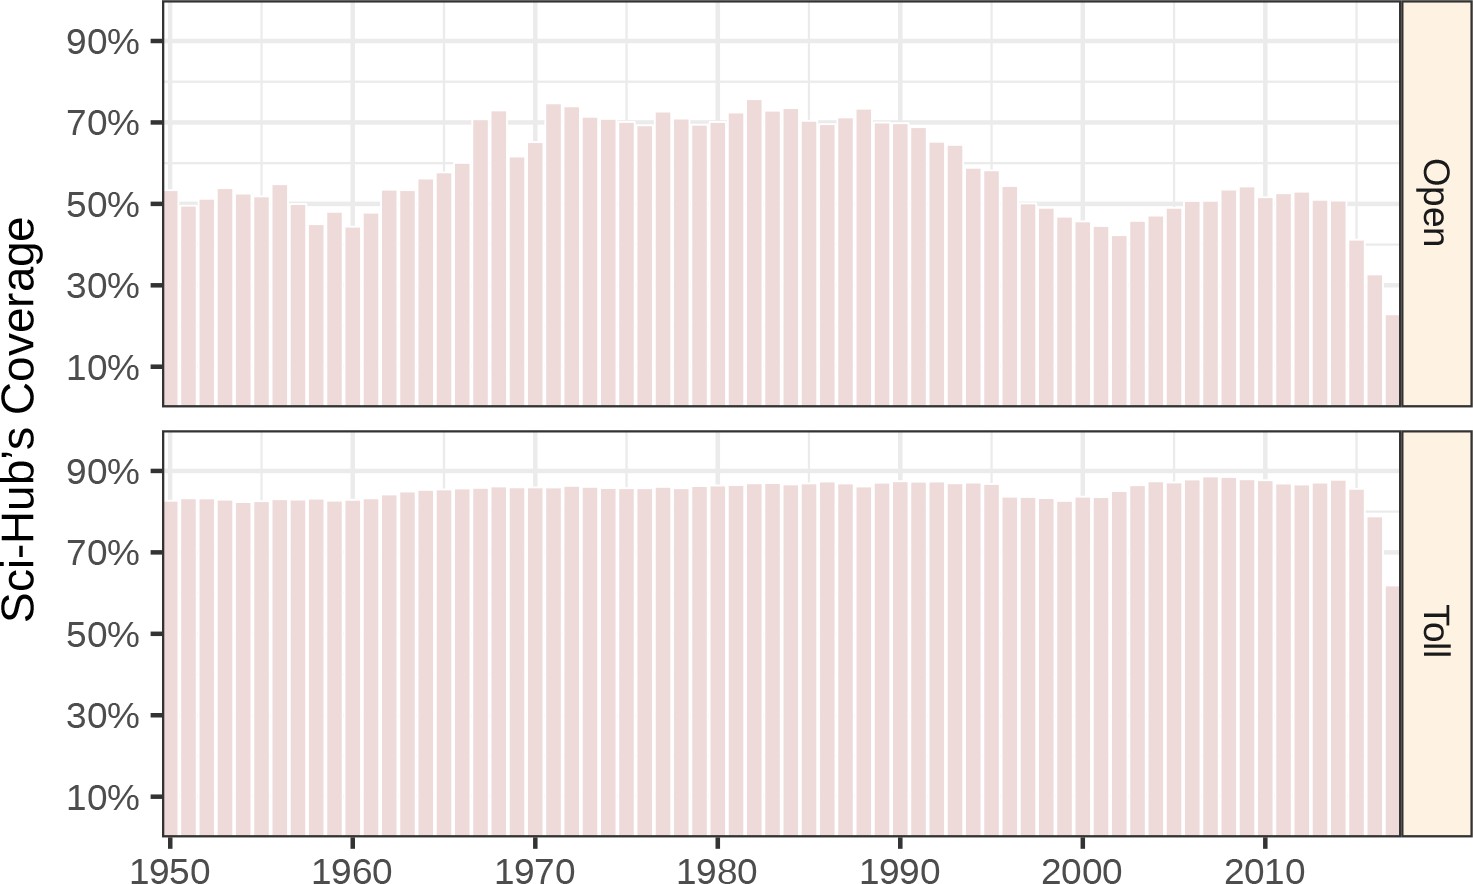
Coverage of articles by year published and journal access status.
Sci-Hub’s coverage is shown separately for articles in open versus toll access journals, for each year since 1950.
Figure 7 with 1 supplement
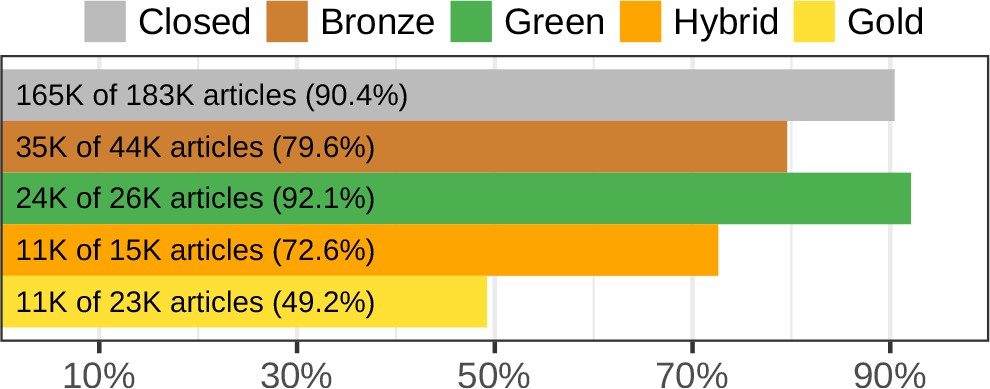
Sci-Hub’s coverage by oaDOI access status.
Using oaDOI calls from the State of OA study, we show Sci-Hub’s coverage on each access status. Gray indicates articles that were not accessible via oaDOI (referred to as closed). Here, all three State of OA collections were combined, yielding 290,120 articles. Figure 7—figure supplement 1 shows coverage separately for the three State of OA collections.
Figure 7—figure supplement 1
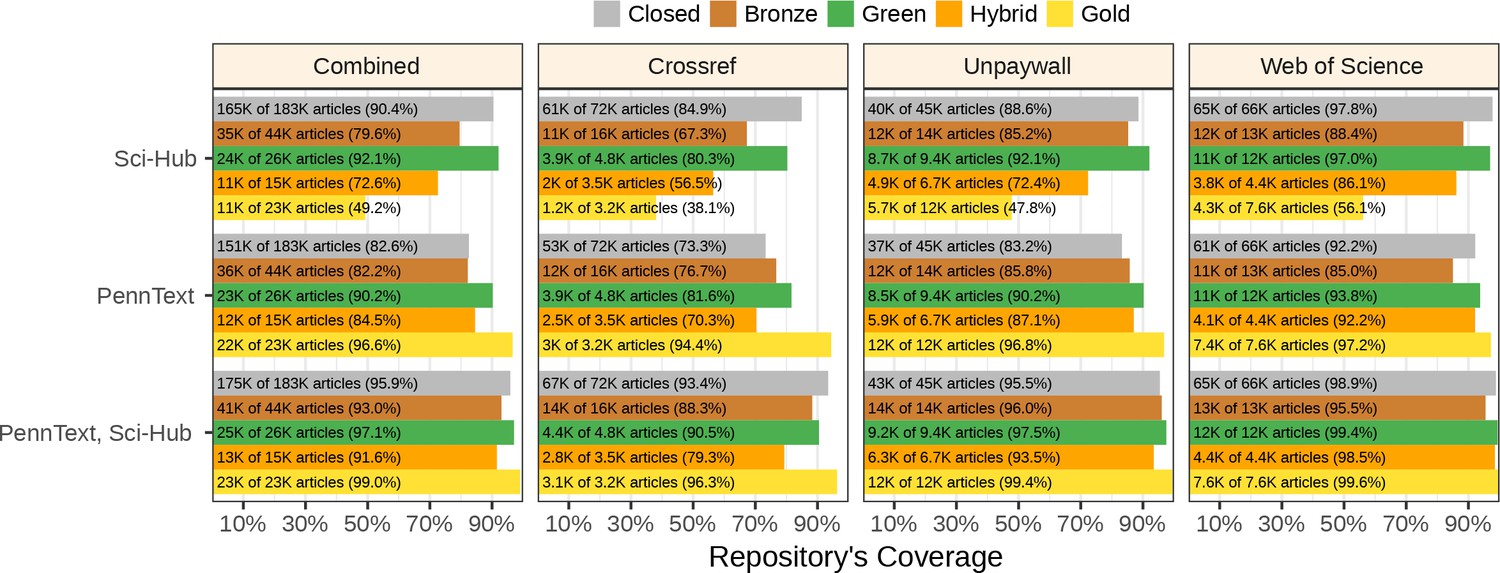
Coverage by oaDOI access status on each State of OA collection.
Coverage by oaDOI access status is shown for Sci-Hub, PennText, and the union of Sci-Hub and PennText. Each panel refers to a different State of OA collection, with Combined referring to the union of the Crossref, Unpaywall, and Web of Science collections. The Sci-Hub section of the Combined panel is the same as Figure 7. Impressively, Sci-Hub’s coverage of the closed articles in the Web of Science collection was 97.8%. This remarkable coverage likely reflects that these articles were published from 2009–2015 and classified as citable items by Web of Science, which is selective when indexing journals (Mongeon and Paul-Hus, 2015). Note that PennText does not have complete coverage of bronze, hybrid, and gold articles, which should be the case were all metadata systems perfect. These anomalies likely result from errors in both PennText (whose accuracy we estimated at 88.2%) and oaDOI (whose accuracy the State of OA study estimated at 90.4%, i.e. Table 1 of (Piwowar et al., 2018) reports 5 false positives and 43 false negatives on oaDOI calls for 500 articles).
Figure 8
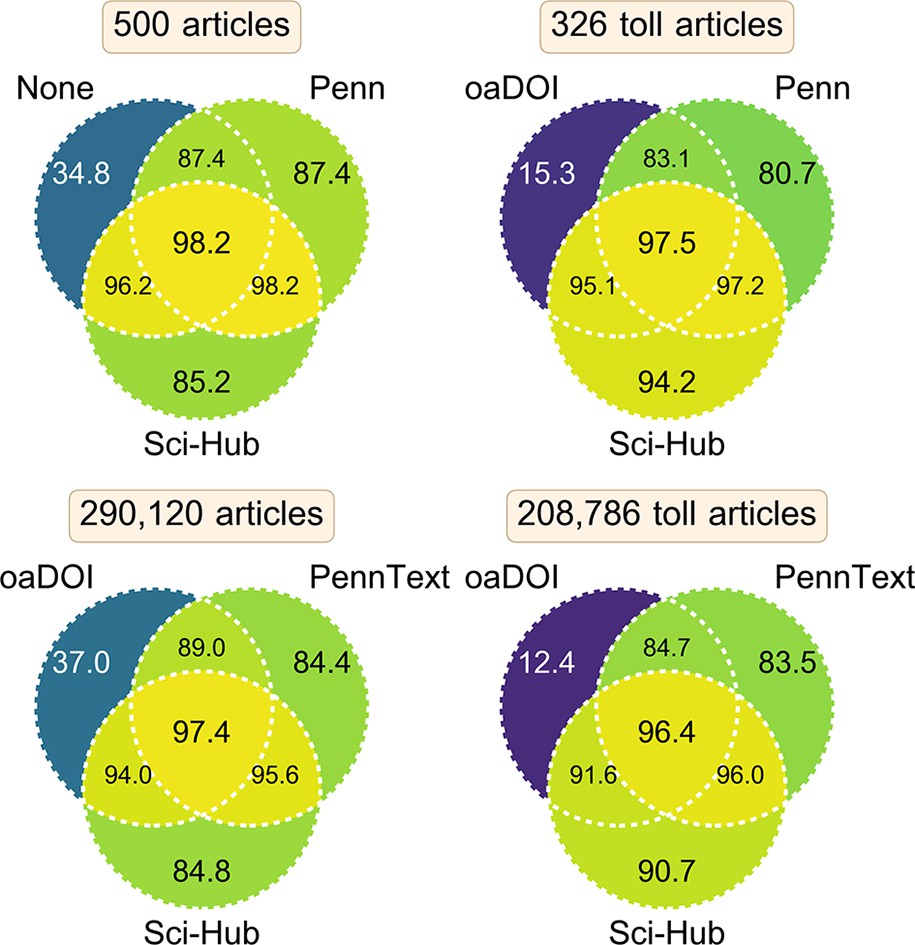
Coverage of several access methods and their combinations.
This figure compares datasets of article coverage corresponding to various access methods. These article sets refer to manually evaluated access via the publisher’s site from outside of an institutional network (labeled None) or from inside Penn’s network (labeled Penn); access according to Penn’s library system (labeled PennText); access via the oaDOI utility (labeled oaDOI); and inclusion in Sci-Hub’s database (labeled Sci-Hub). Each diagram shows the coverage of three access methods and their possible combinations. Within a diagram, each section notes the percent coverage achieved by the corresponding combination of access methods. Contrary to traditional Venn diagrams, each section does not indicate disjoint sets of articles. Instead, each section shows coverage on the same set of articles, whose total number is reported in the diagram’s title. The top two diagrams show coverage on a small set of manually evaluated articles (confidence intervals provided in the main text). The bottom two diagrams show coverage on a larger set of automatically evaluated articles. The two lefthand diagrams show coverage on all articles, whereas the two righthand diagrams show coverage on toll access articles only. Specifically, the top-right diagram assesses coverage on articles that were inaccessible from outside of an institutional network. Similarly, the bottom-right diagram assesses coverage of articles that were classified as closed or green by oaDOI, and thus excludes gold, hybrid, and bronze articles (those available gratis from their publisher).
Figure 9
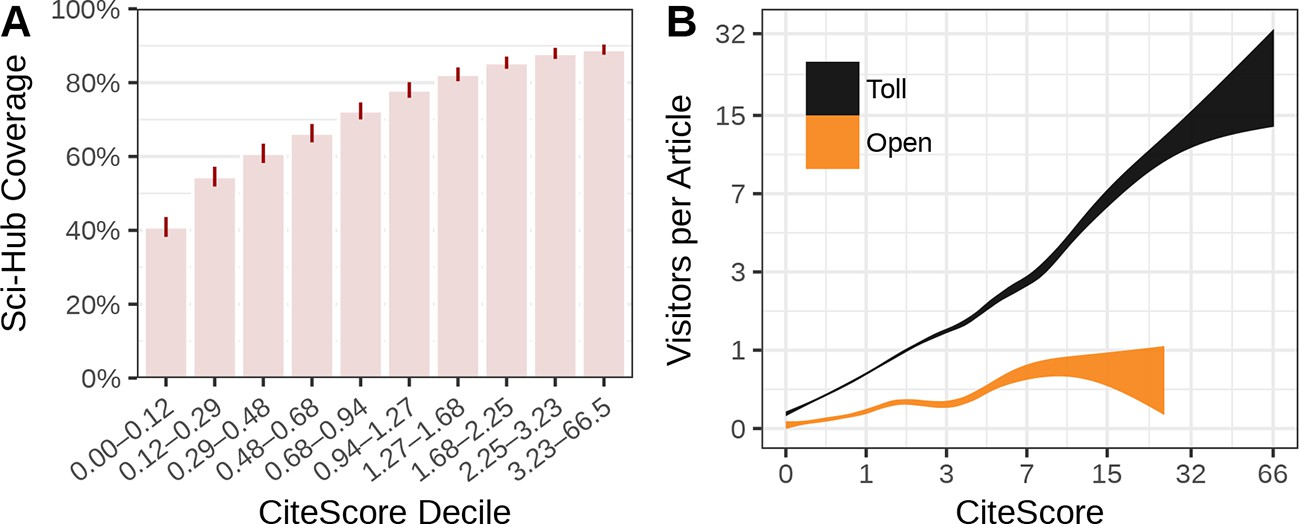
Relation to journal impact.
(A) Average coverage for journals divided into 2015 CiteScore deciles. The CiteScore range defining each decile is shown by the x-axis labels. The ticks represent 99% confidence intervals of the mean. This is the only analysis where “Sci-Hub Coverage” refers to journal-level rather than article-level averages. (B) The association between 2015 CiteScore and average visitors per article is plotted for open and toll access journals. Curves show the 95% confidence band from a Generalized Additive Model.
Figure 10 with 1 supplement
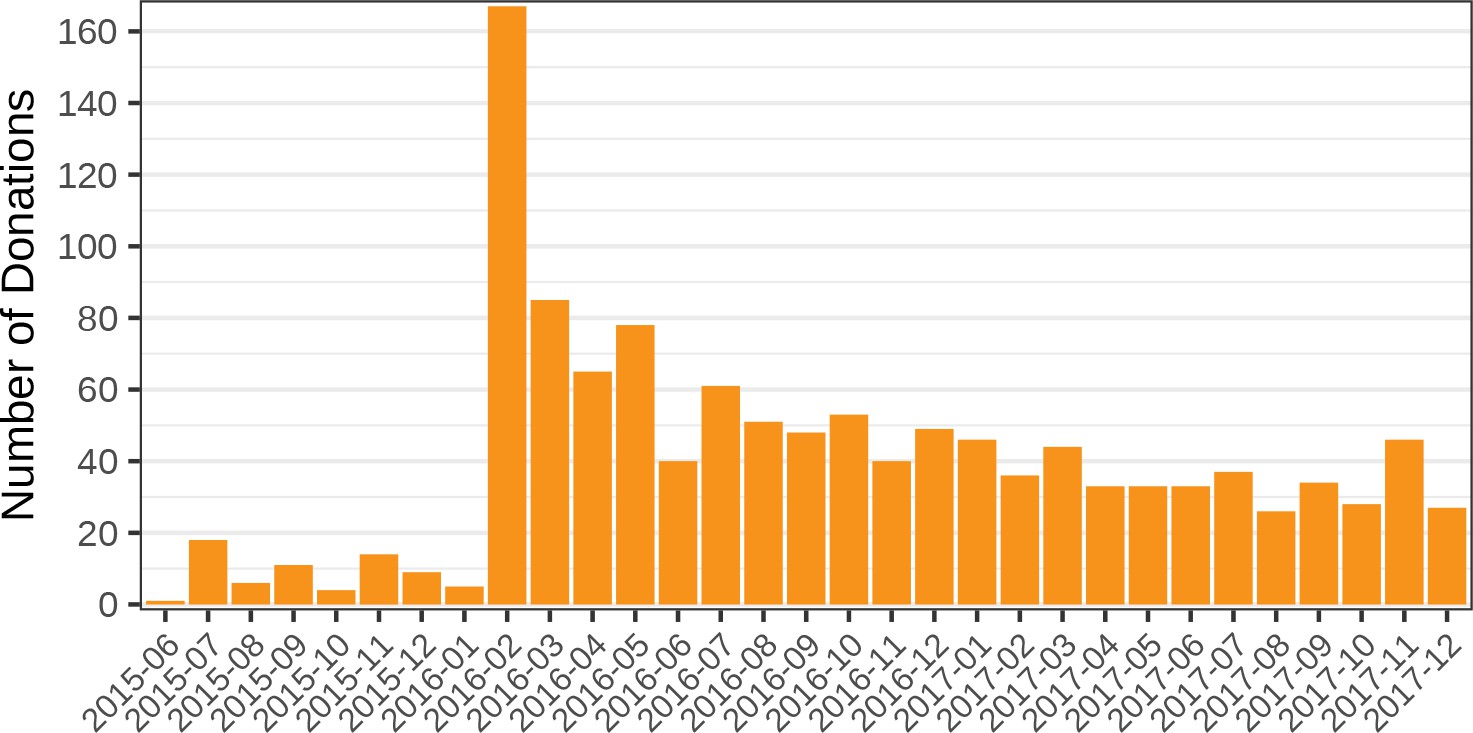
Number of bitcoin donations per month.
The number of bitcoin donations to Sci-Hub is shown for each month from June 2015 to December 2017. Since February 2016, Sci-Hub has received over 25 donations per month. Each donation corresponds to an incoming transaction to a known Sci-Hub address. See Figure 10—figure supplement 1 for the amount donated each month, valued in BTC or USD.
Figure 10—figure supplement 1
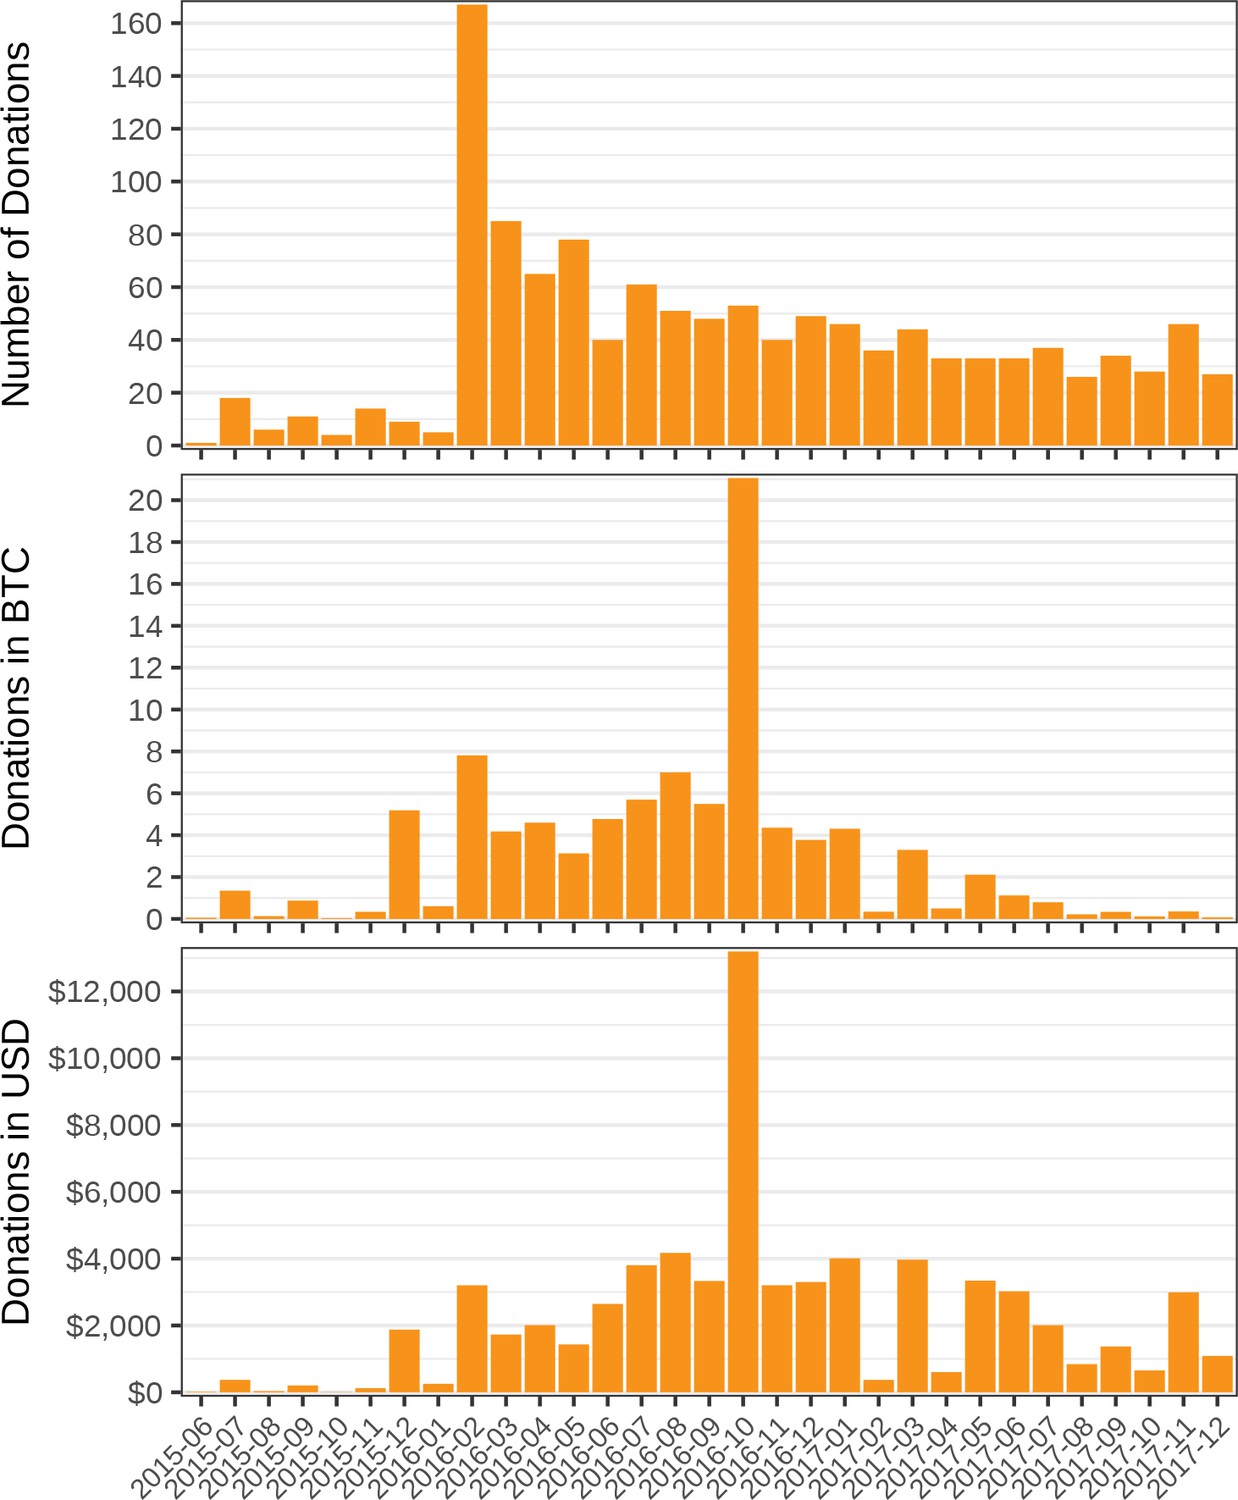
Bitcoin donations to Sci-Hub per month.
For months since June 2015, total bitcoin donations (deposits to known Sci-Hub addresses) were assessed. Donations in USD refers to the United States dollar value at time of transaction confirmation.
Figure 11 with 1 supplement
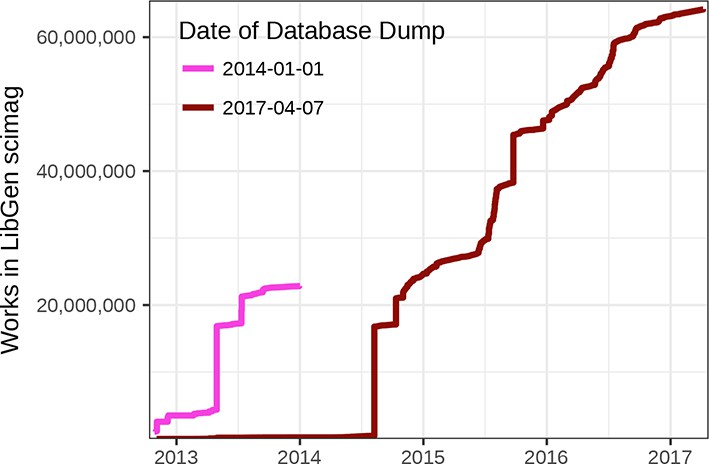
Number of articles in LibGen scimag over time.
The figure shows the number of articles in LibGen scimag, according to its TimeAdded field, for two database dumps. The number of articles added per day for the January 1, 2014 LibGen database dump was provided by Cabanac and corresponds to Figure 1 of (Cabanac, 2016). Notice the major discrepancy whereby articles from the April 7, 2017 database dump were added at later dates. Accordingly, we hypothesize that the TimeAdded field is replaced upon modification, making it impossible to assess date of first upload.
Figure 11—figure supplement 1
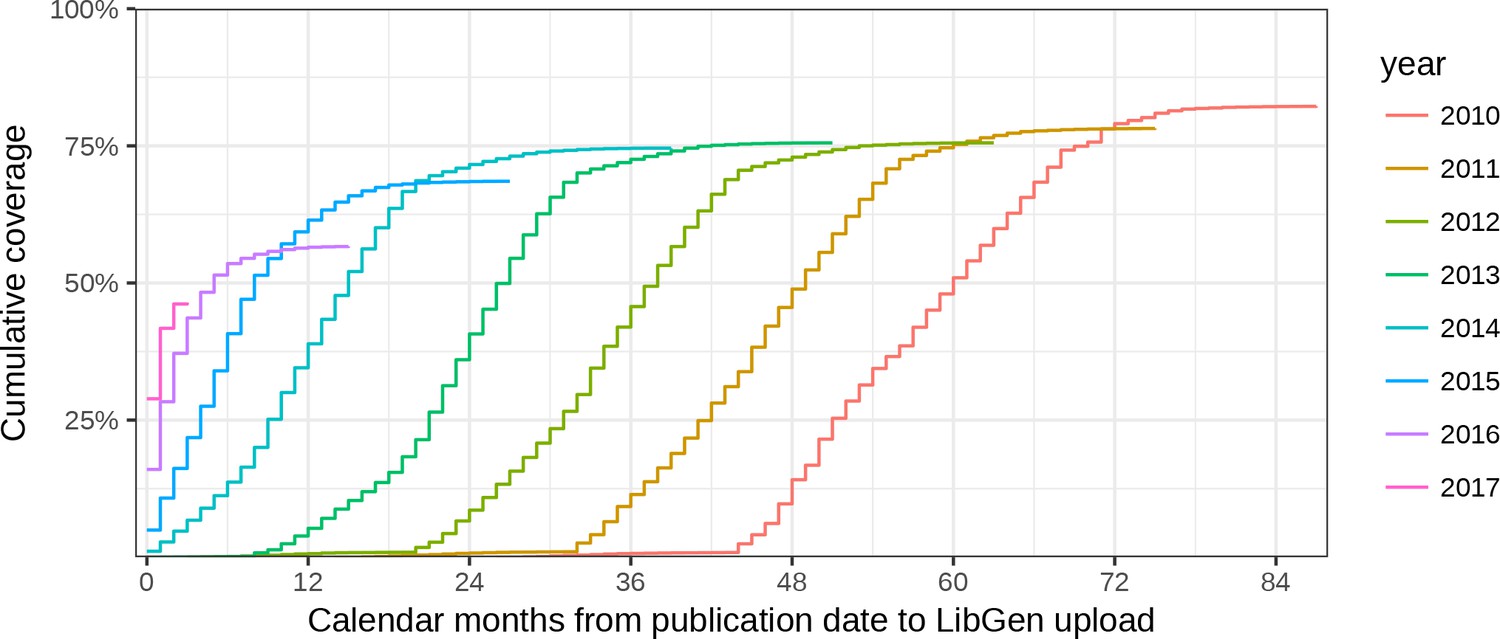
Lag-time from publication to LibGen upload.
For each year of publication from 2010–2017, we plot the relationship between lag-time and LibGen scimag’s coverage. For example, this plot shows that 75% of articles published in 2011 were uploaded to LibGen within 60 months. This analysis only considers articles for which a month of publication can reliably be extracted, which excludes all articles allegedly published on January 1. This plot portrays lag-times as decreasing over time, with maximum coverage declining. For example, coverage for 2016 articles exceeded 50% within 6 months, but appears to have reached an asymptote around 60%. Alternatively, coverage for 2014 took 15 months to exceed 50%, but has since reached 75%. However, this signal could result from post-dated LibGen upload timestamps. Therefore, we caution against drawing any conclusions from the TimeAdded field in LibGen scimag until its accuracy can be established more reliably.
Tables
Table 1
Coverage for the ten journals with the most articles.
The total number of articles published by each journal is noted in the Crossref column. The table provides the number (Sci-Hub column) and percentage (Coverage column) of these articles that are in Sci-Hub’s repository.
| Journal | Sci-Hub | Crossref | Coverage |
|---|---|---|---|
| The Lancet | 457,650 | 458,580 | 99.8% |
| Nature | 385,619 | 399,273 | 96.6% |
| British Medical Journal (Clinical Research Edition) | 17,141 | 392,277 | 4.4% |
| Lecture Notes in Computer Science | 103,675 | 356,323 | 29.1% |
| Science | 230,649 | 251,083 | 91.9% |
| Journal of the American Medical Association | 191,950 | 248,369 | 77.3% |
| Journal of the American Chemical Society | 189,142 | 189,567 | 99.8% |
| Scientific American | 22,600 | 186,473 | 12.1% |
| New England Journal of Medicine | 180,321 | 180,467 | 99.9% |
| PLOS ONE | 4,731 | 177,260 | 2.7% |
Download links
A two-part list of links to download the article, or parts of the article, in various formats.
Downloads (link to download the article as PDF)
Open citations (links to open the citations from this article in various online reference manager services)
Cite this article (links to download the citations from this article in formats compatible with various reference manager tools)
Research: Sci-Hub provides access to nearly all scholarly literature
eLife 7:e32822.
https://doi.org/10.7554/eLife.32822


