Research Culture: A survey of new PIs in the UK
- University College London, United Kingdom
- University of Sheffield, United Kingdom
Figures
Figure 1 with 2 supplements
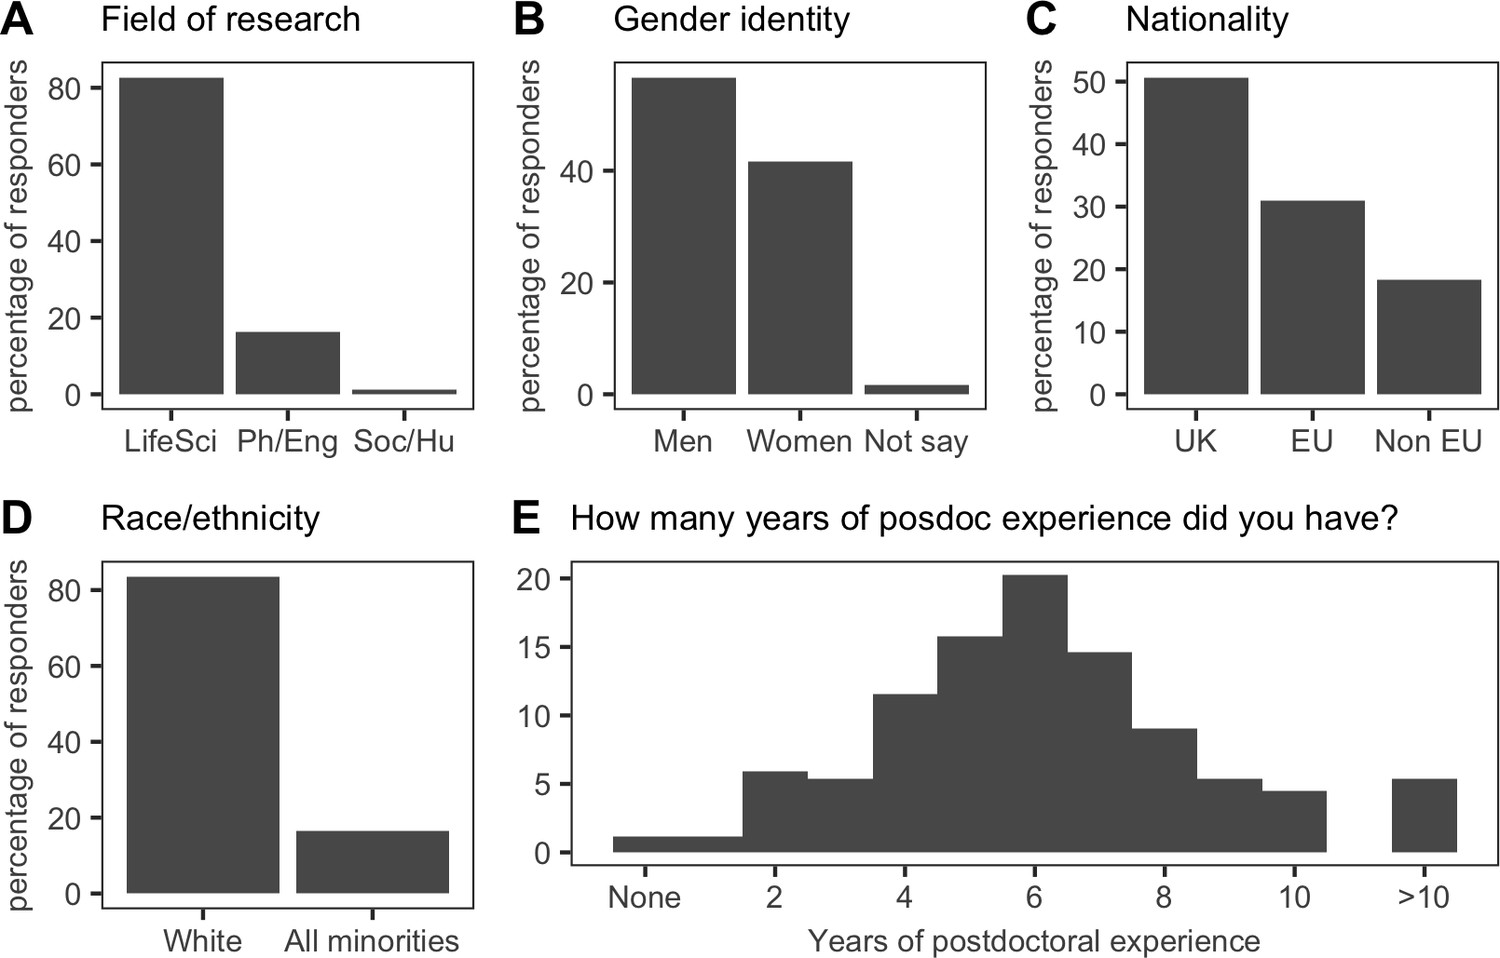
Overview of cohort demographics.
(A) 83% (302/365) of respondents classified themselves as being in the Life Sciences (LifeSci); 16% (59/365) were in the Physical Sciences and Engineering (Ph/Eng); and 1% (4/365) were from in the Social Sciences and Humanities (Soc/Hu). (B) 56.7% (207/365) of respondents were men; 41.6% (152/365) were women; and 1.6% (6/365) were ‘Prefer not to say’. (C) 51% (185/365) of respondents were from the UK; 31% (113/365) were from other EU countries; and 18% (67/365) were from the rest of the world (Non EU). (D) 84% (305/365) of respondents were white. (E) 51% (180/355) of respondents had between five and seven years of postdoc experience prior to independence. Consequently, the majority of respondents were in their mid-thirties at the time they became new PIs (see Figure 1—figure supplement 1); the most recent new PIs were the least likely to have dependents (see Figure 1—figure supplement 2).
-
Figure 1—source data 1
Summary data for Figure 1.
- https://doi.org/10.7554/eLife.46827.007
Figure 1—figure supplement 1
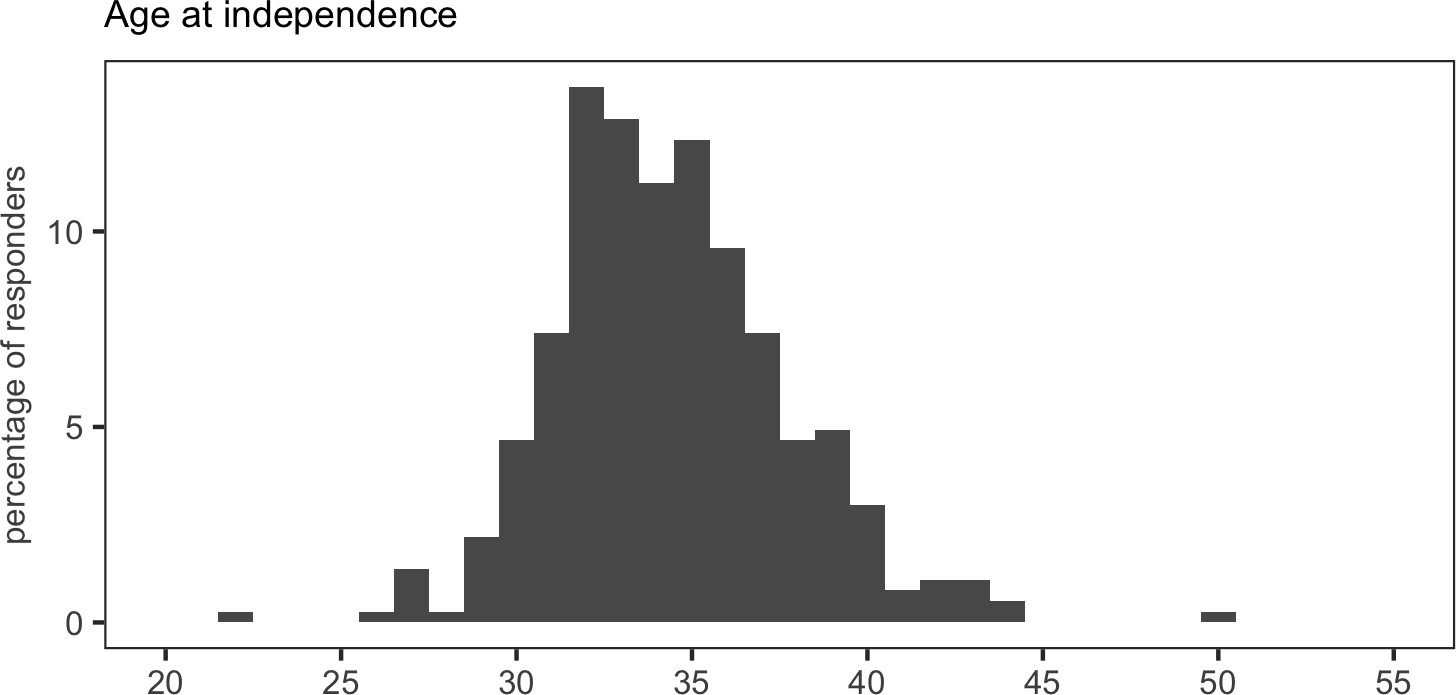
Age of respondents.
The mean age of respondents at independence was 34.
-
Figure 1—figure supplement 1—source data 1
Summary data for Figure 1—figure supplement 1.
- https://doi.org/10.7554/eLife.46827.004
Figure 1—figure supplement 2
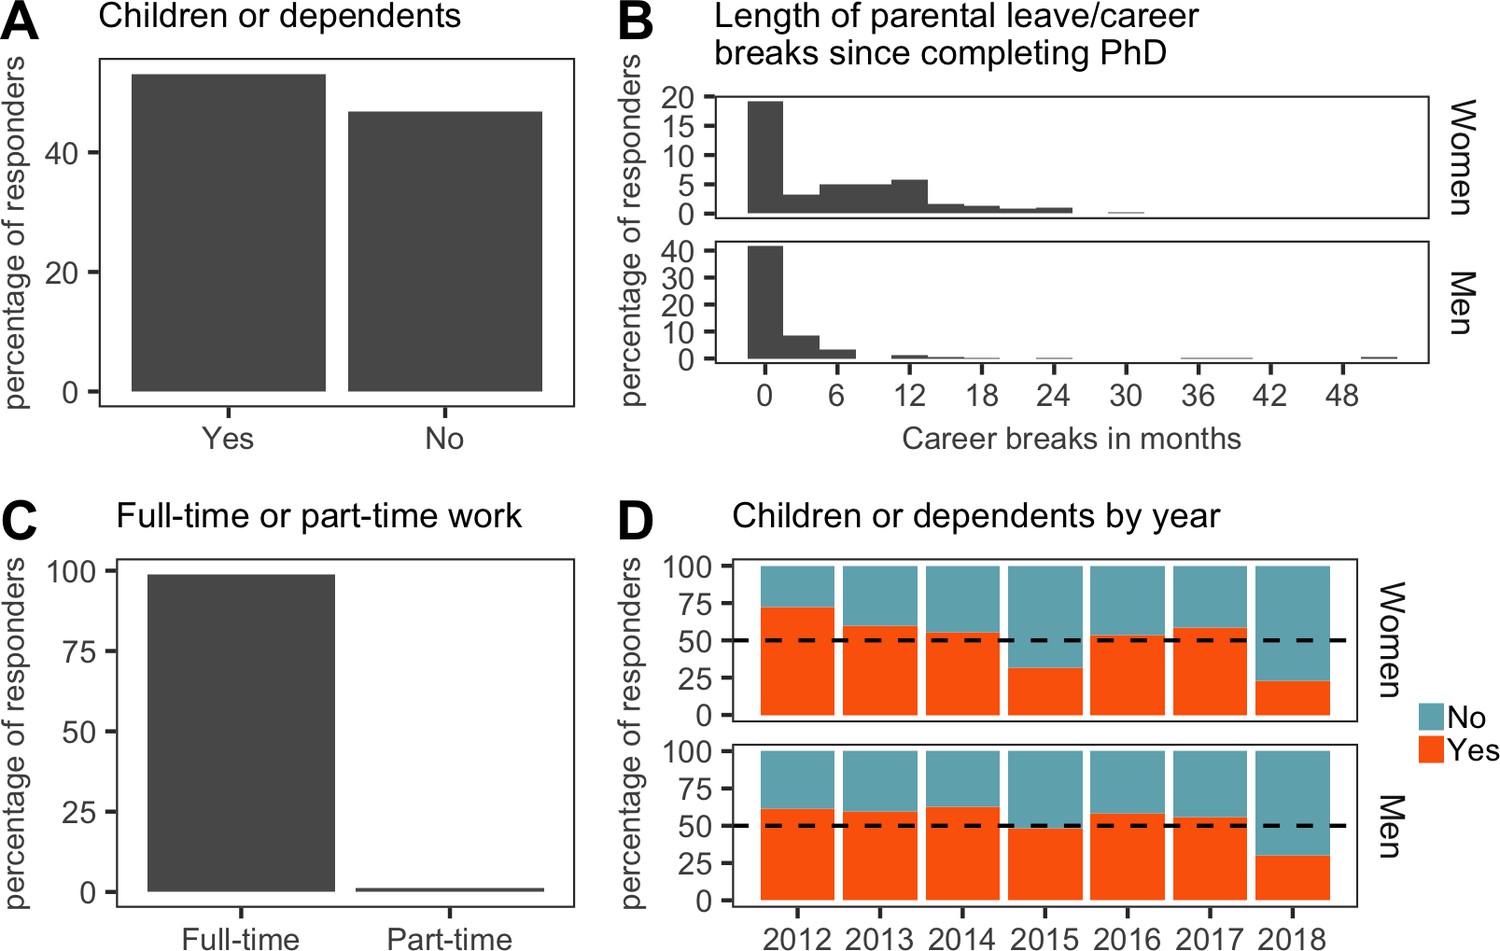
Dependents, career breaks and work patterns.
(A) 53.2% (194/365) of respondents care for dependents. (B) 56% of women and 45% of men had taken at least one career break. The average career break was 10 months for women and 5 months for men. (C) Despite a majority of respondents having dependents to take care of, just 4 of the 365 respondents worked part-time in their position. (D) The most recent female appointees in our cohort were the least likely to have dependents, and the most established female appointees were the most likely to have dependents.
-
Figure 1—figure supplement 2—source data 1
Summary data for Figure 1—figure supplement 2.
- https://doi.org/10.7554/eLife.46827.006
Figure 2
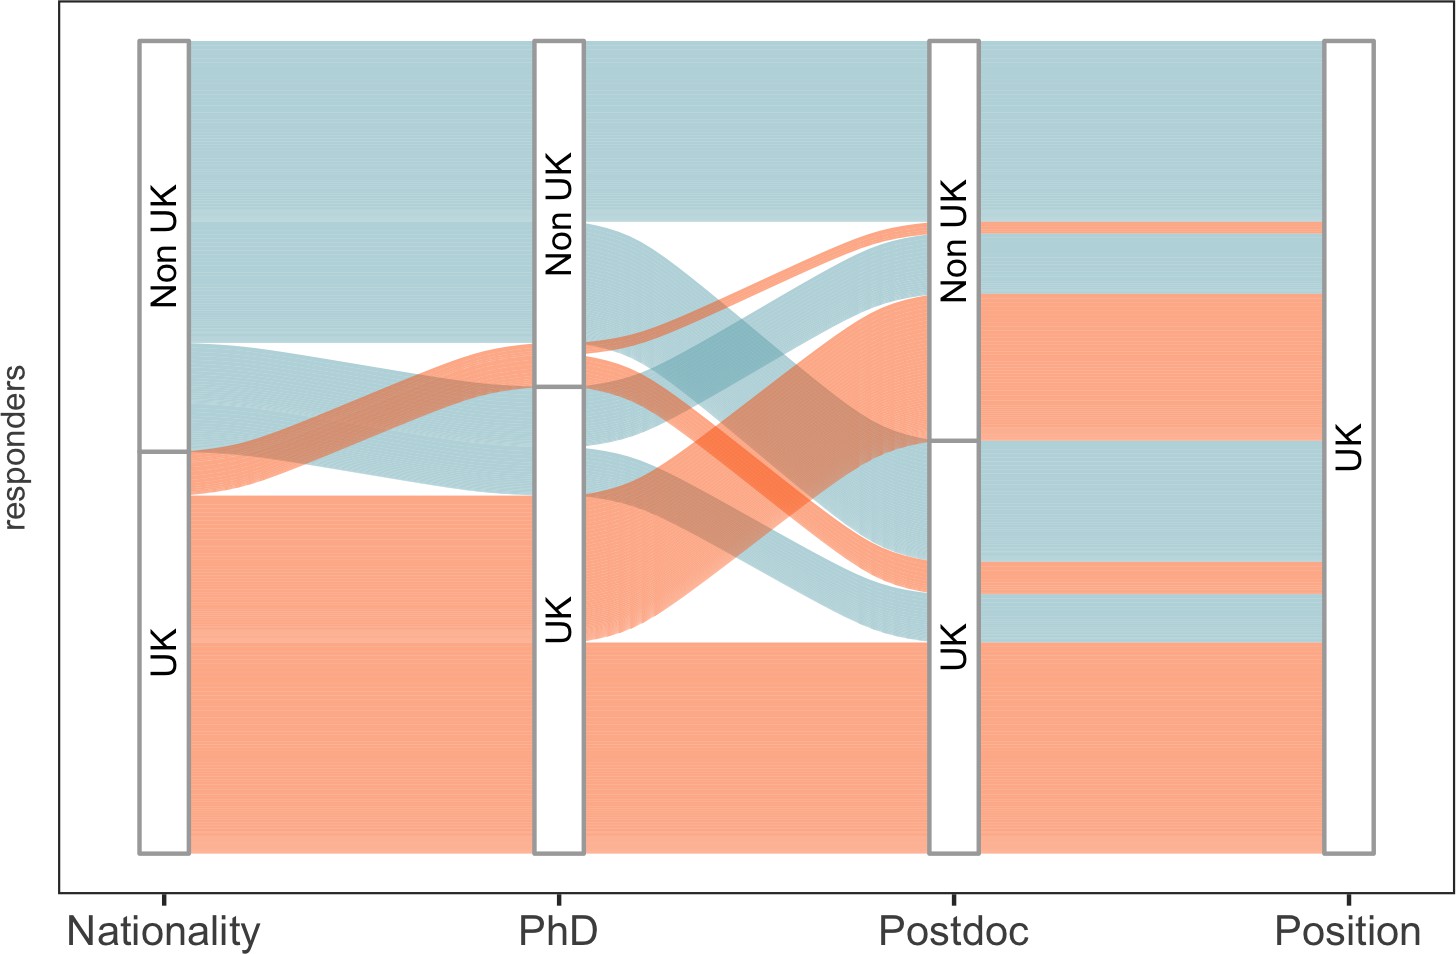
Overview of cohort mobility.
An alluvial plot of cohort migration, where line width is proportional to the percentage of respondents. Colour corresponds to the nationality (UK; orange, Non-UK; blue) of participants as they move through their careers (PhD and postdoc training). 26.8% (98/365) of respondents had spent all their career in the UK, while 22.2% (81/365) had not worked in the UK before starting as a new PI in the UK.
-
Figure 2—source data 1
Summary data for Figure 2.
- https://doi.org/10.7554/eLife.46827.009
Figure 3 with 1 supplement
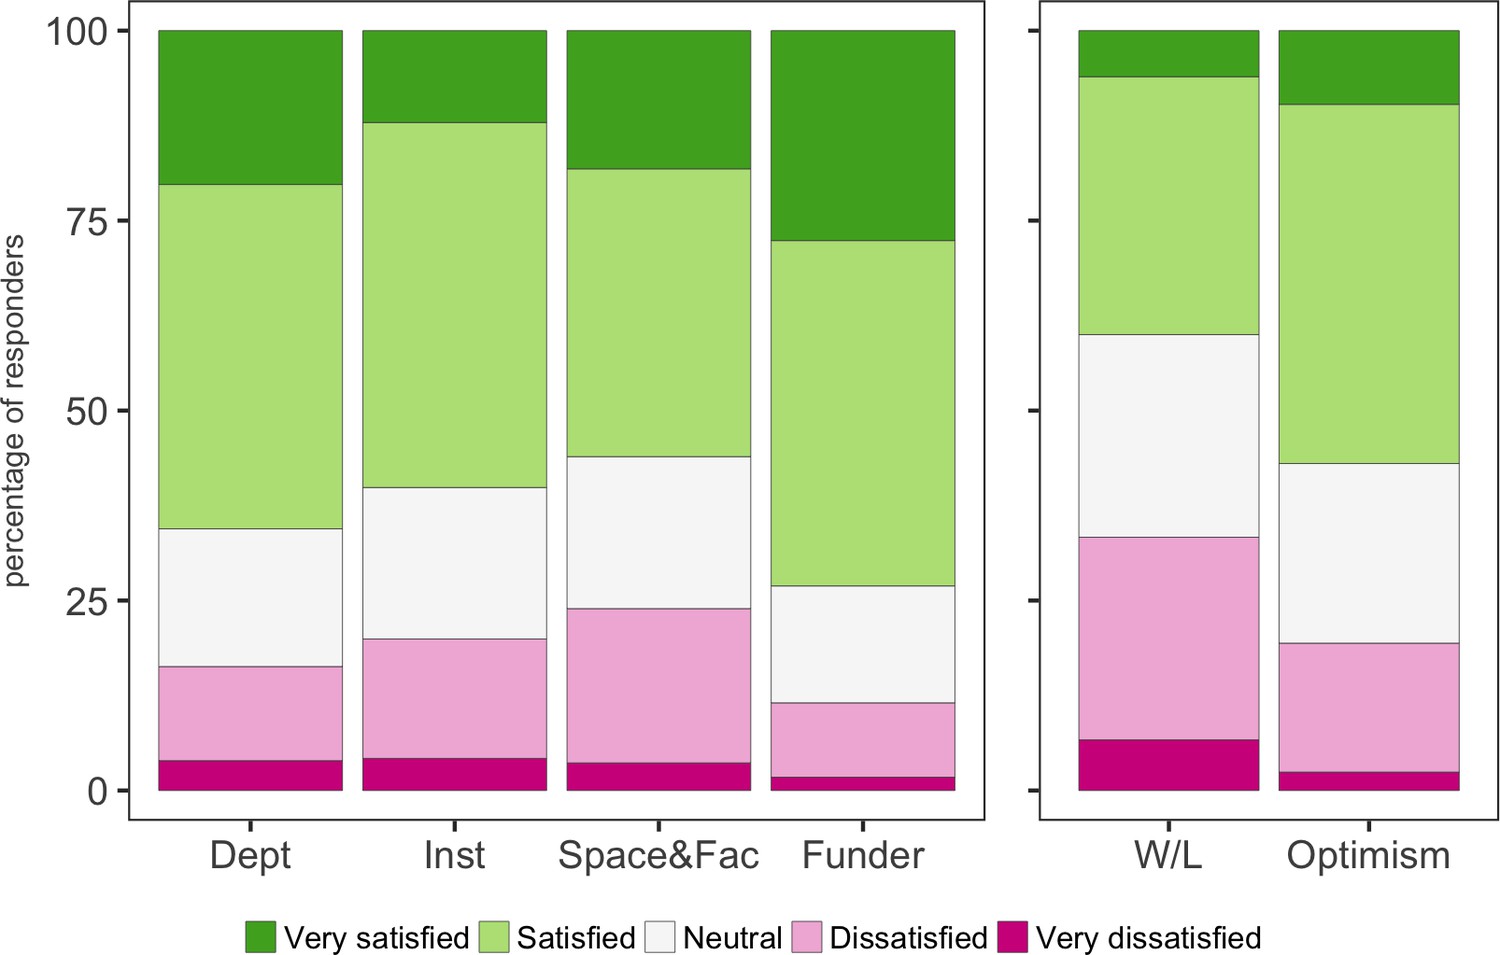
Satisfaction and optimism.
Participants were asked to rate their satisfaction with their host department (Dept), host institution (Inst), lab space and access to facilities (Space&Fac) and support from their funder (Funder). Participants were also asked how they felt about their current work-life balance (W/L) and their optimism about their future career (Optimism). With the exception of work-life balance, more than 50% of respondents replied that they were satisfied or very satisfied.
-
Figure 3—source data 1
Summary data for Figure 3.
- https://doi.org/10.7554/eLife.46827.013
Figure 3—figure supplement 1
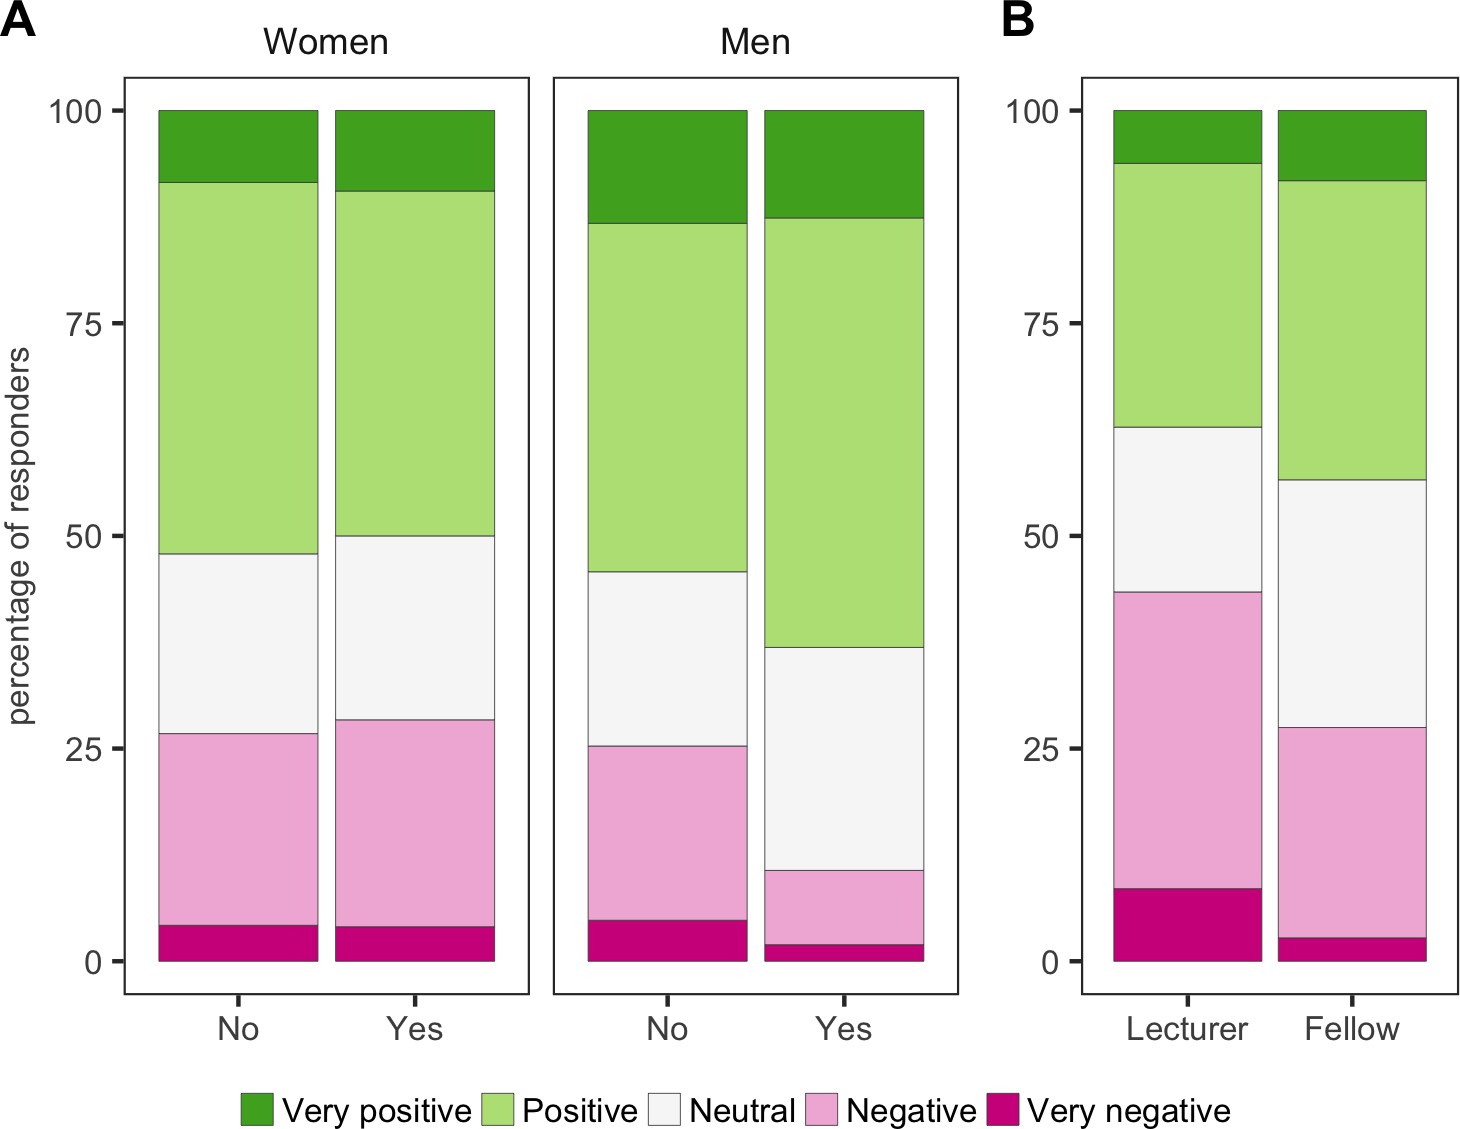
Optimism and work-life balance of subgroups.
(A) Having dependants did not affect optimism scores for new male or female PIs. (B) Lecturers were less positive about work-life balance than fellows.
-
Figure 3—figure supplement 1—source data 1
Summary data for Figure 3—figure supplement 1.
- https://doi.org/10.7554/eLife.46827.012
Figure 4
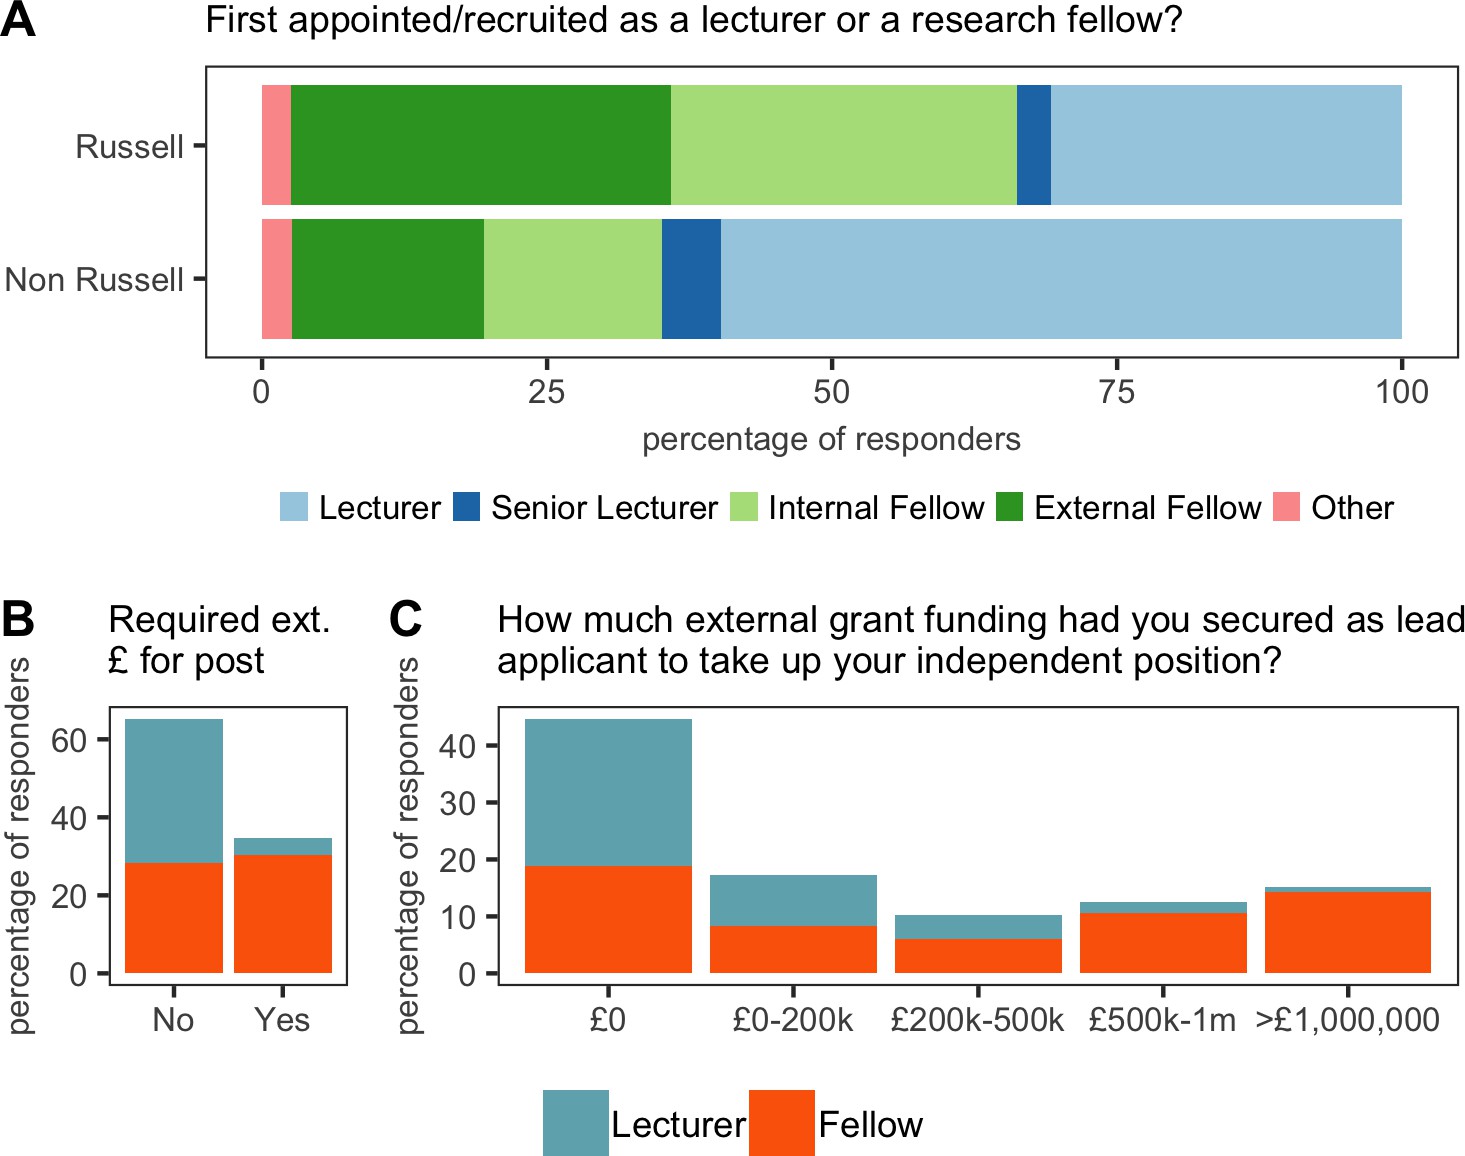
Initial recruitment.
(A) 75% (234/311) of respondents were from Russell Group universities, and a majority of these recruits (64%; 149/234) were brought in as research fellows (top). 25% (77/311) of respondents were from outside the Russell Group, and a majority of these recruits (60%; 46/77) were brought in as lecturers (bottom). (B) 35% (108/311) of respondents were required to have secured a major grant or fellowship in order to take up their position: 52% (94/182) of fellows were expected to have secured such funding, compared with just 11% (14/129) of lecturers. (C) Some respondents (mostly research fellows) had secured more than £1 m in external grant funding when they started as a new PI.
-
Figure 4—source data 1
Summary data for Figure 4.
- https://doi.org/10.7554/eLife.46827.015
Figure 5 with 1 supplement
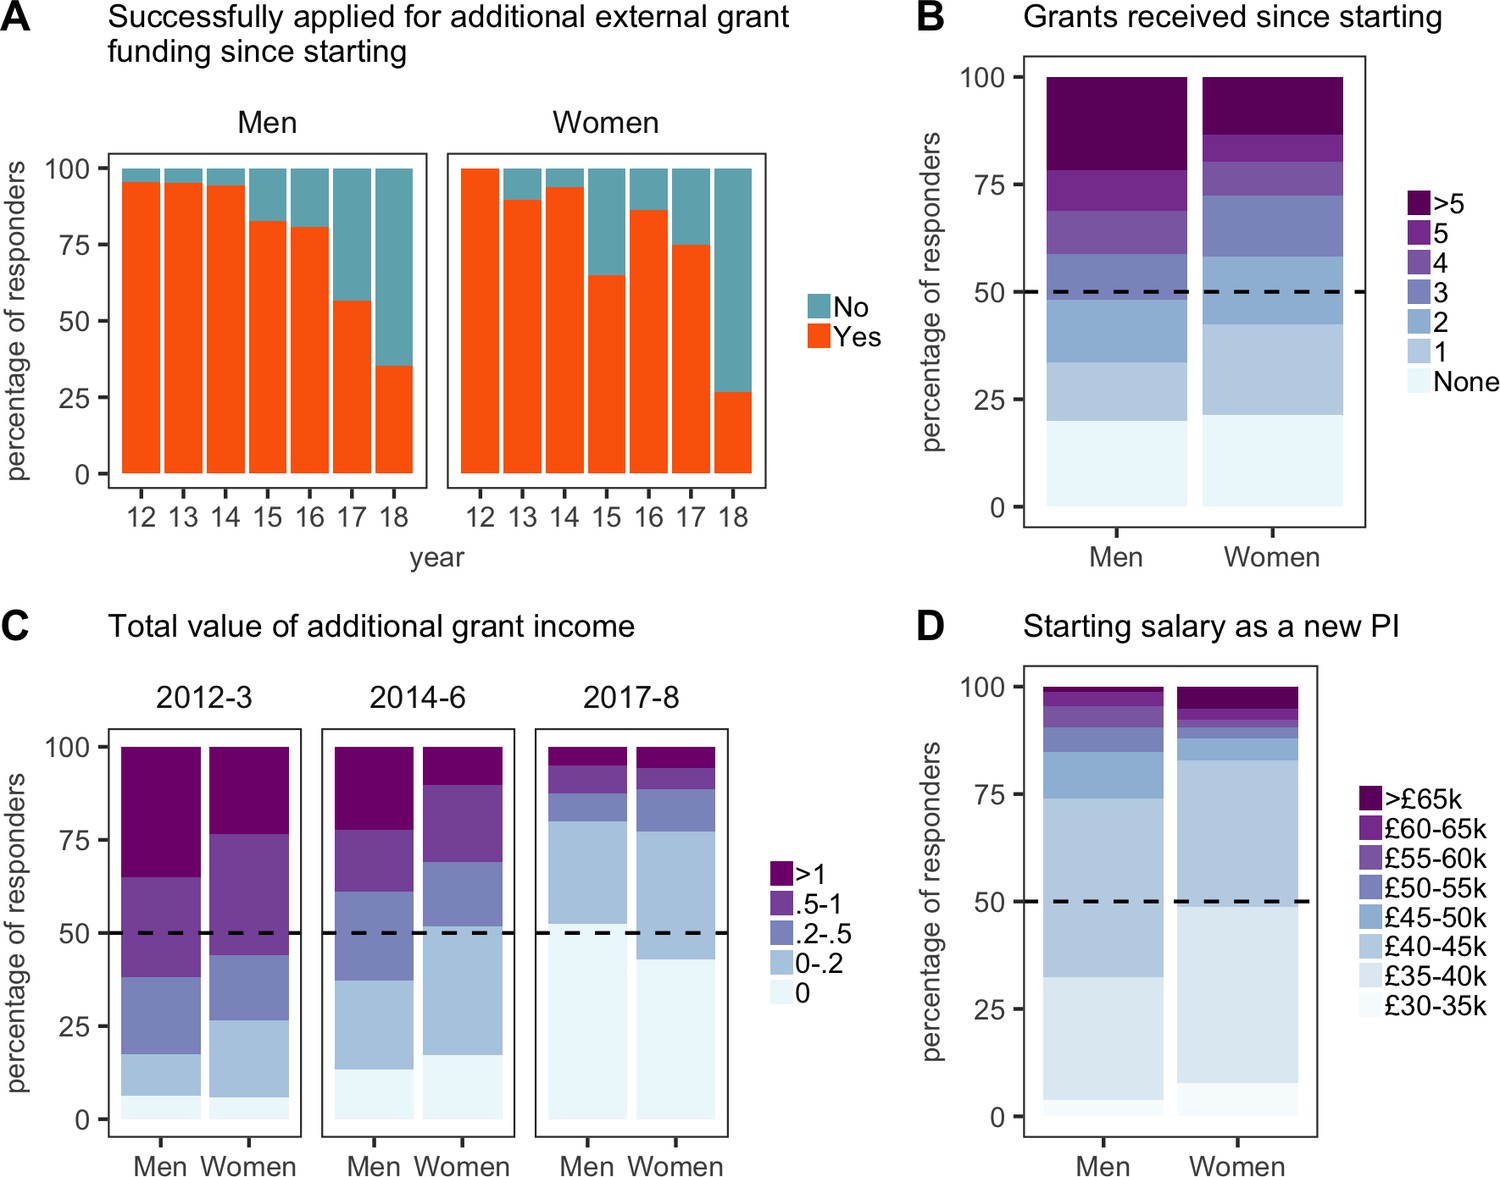
Gender comparisons in pay and grant income.
All plots are expressed as the percentage of respondents within each category. (A) Grant success versus year of independence (12 = 2012, and so on). (B) Half of the male respondents had received three or more grants since starting; half of the female respondents had received two or more. (C) Grant values (expressed in £m) for new PIs who started in 2012–13, 2014–16, and 2017–2018. (D) The self-reported salaries of new PIs at the time they were appointed show a substantial gender pay gap.
-
Figure 5—source data 1
Summary data for Figure 5.
- https://doi.org/10.7554/eLife.46827.019
Figure 5—figure supplement 1

Starting salaries.
(A) Lecturers were appointed on lower starting salaries than fellows. (B) Women started on lower pay grades than men.
-
Figure 5—figure supplement 1—source data 1
Summary data for Figure 5—figure supplement 1.
- https://doi.org/10.7554/eLife.46827.018
Figure 6
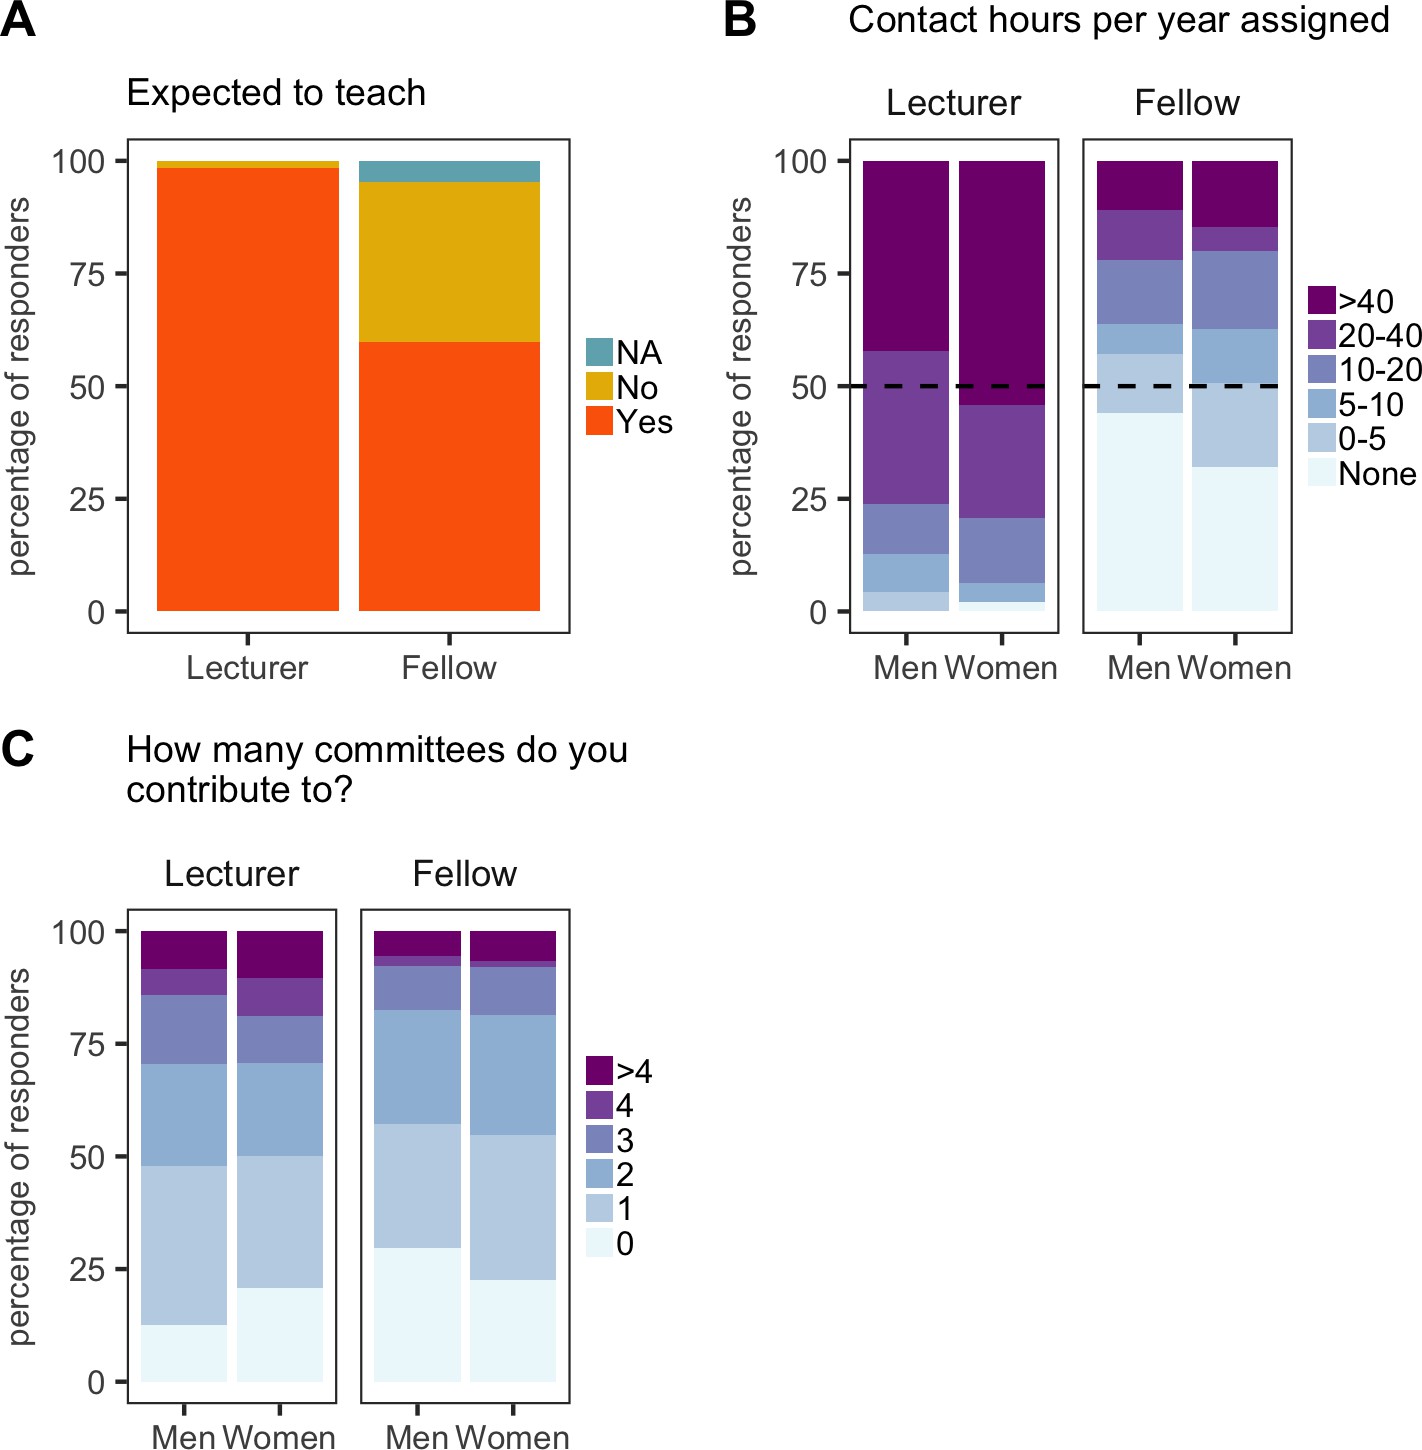
Teaching and administration load.
All plots are expressed as the percentage of respondents within each category. (A) Almost all (119/121) new PIs appointed as lecturers are expected to teach, along with 60% (100/167) of new PIs appointed as fellows. (B) Lecturers generally have much higher teaching loads than fellows, and women have more contact hours assigned than men (both as lecturers and fellows). (C) Women were expected to contribute to more committees than men.
-
Figure 6—source data 1
Summary data for Figure 6.
- https://doi.org/10.7554/eLife.46827.021
Figure 7
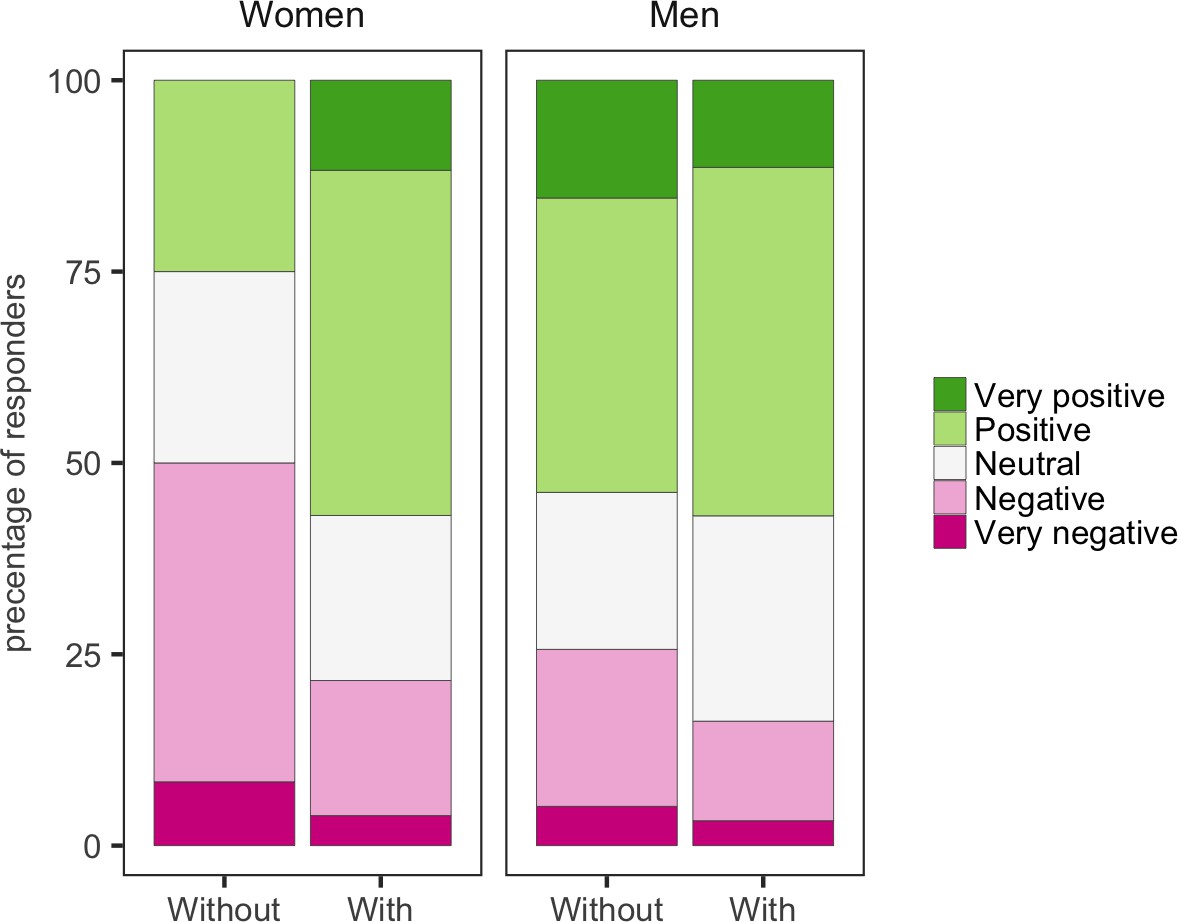
Mentorship and optimism.
Women with mentors were more optimistic about the future than women without mentors. Men with mentors were a little more optimistic about the future than men without mentors.
-
Figure 7—source data 1
Summary data for Figure 7.
- https://doi.org/10.7554/eLife.46827.023
Figure 8 with 1 supplement

Start-up funds.
Female respondents received an average of £31 k (red line; top panel) in start-up funds, whereas men received an average of £45.6 k (red line; bottom panel.
-
Figure 8—source data 1
Summary data for Figure 8.
- https://doi.org/10.7554/eLife.46827.027
Figure 8—figure supplement 1

Proleptic appointments.
(A) 70% (140/200) of research fellows did not have a proleptic appointment. (B) 36% (59/164) of research fellows did not know when to expect an interview for a propleptic appointment.
-
Figure 8—figure supplement 1—source data 1
Summary data for Figure 8—figure supplement 1.
- https://doi.org/10.7554/eLife.46827.026
Figure 9
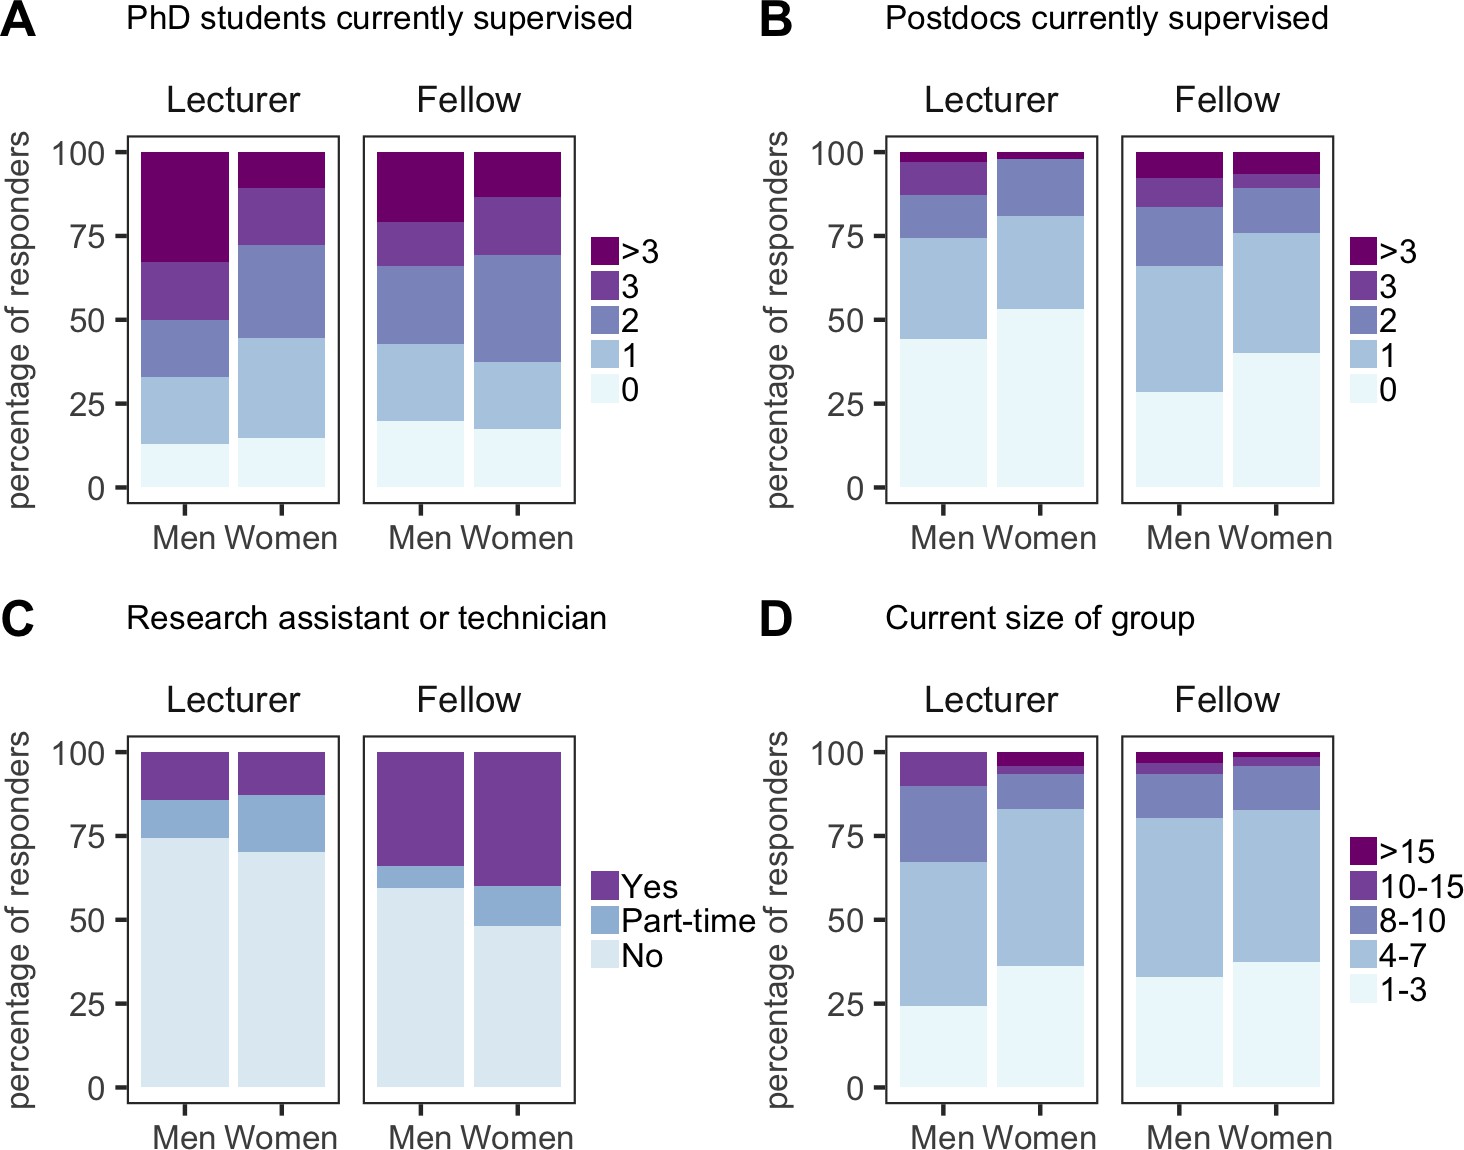
Building a research group.
PhD students currently supervised (A), postdocs currently supervised (B), presence of a research assistant or technician (C) and current size of research group (D) for lecturers (men and women) and research fellows (men and women). Responders were asked to include undergraduates and master’s students when reporting the size of their research group. All categories are expressed as the percentage of respondents within each category.
-
Figure 9—source data 1
Summary data for Figure 9.
- https://doi.org/10.7554/eLife.46827.029
Figure 10
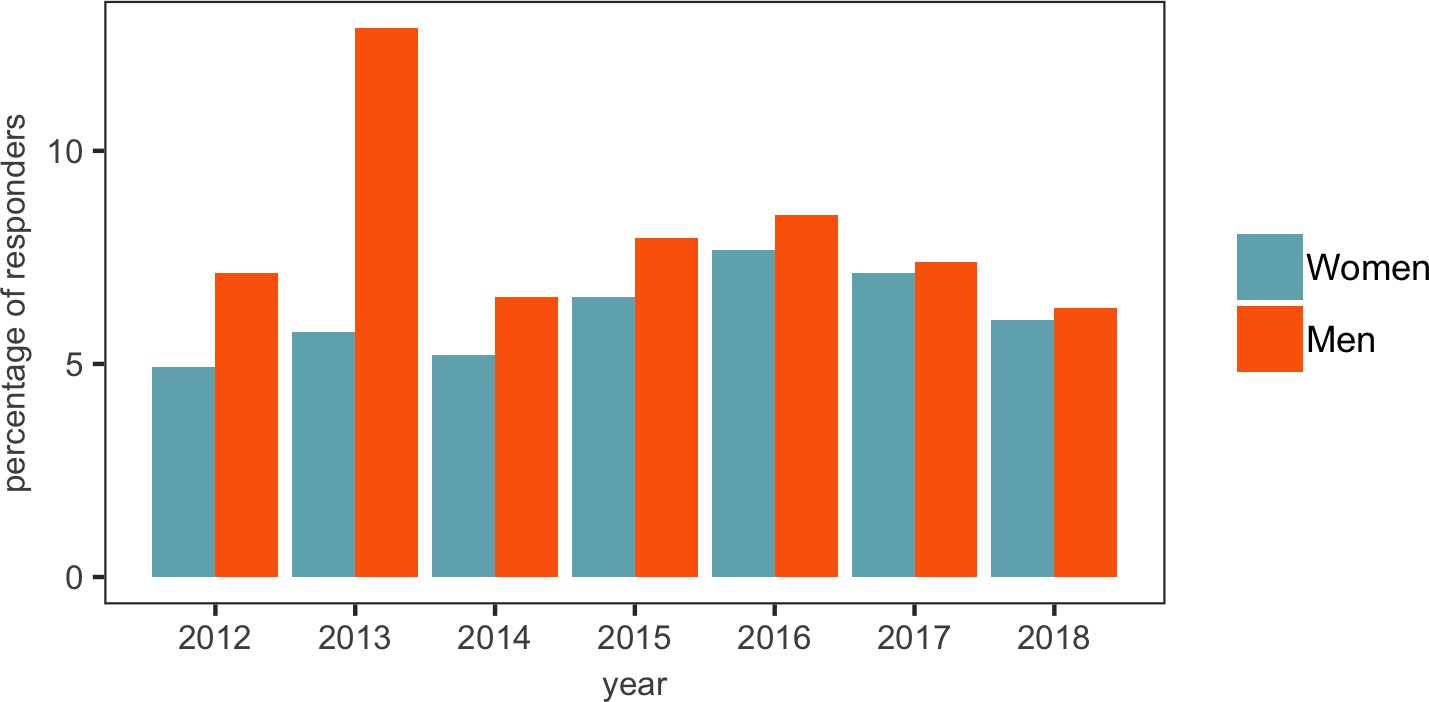
Recruitment of men and women by year.
The gap between the number of men and women appointed as new PIs seems to have narrowed in recent years (with the gap being eight in 2012 and just one in 2017 and 2018), with the very noticeable exception of 2013, when 47 men and 21 women were appointed. A possible explanation for this is discussed in the text.
-
Figure 10—source data 1
Summary data for Figure 10.
- https://doi.org/10.7554/eLife.46827.031
Additional files
-
Supplementary file 1
Statistical analysis.
- https://doi.org/10.7554/eLife.46827.032
-
Supplementary file 2
Survey questionnaire.
- https://doi.org/10.7554/eLife.46827.033
Download links
A two-part list of links to download the article, or parts of the article, in various formats.
Downloads (link to download the article as PDF)
Open citations (links to open the citations from this article in various online reference manager services)
Cite this article (links to download the citations from this article in formats compatible with various reference manager tools)
Research Culture: A survey of new PIs in the UK
eLife 8:e46827.
https://doi.org/10.7554/eLife.46827


