Meta-Research: Questionable research practices may have little effect on replicability
- Department of Psychology, University of Tübingen, Germany
- Department of Psychology, University of Otago, New Zealand
Figures
Figure 1
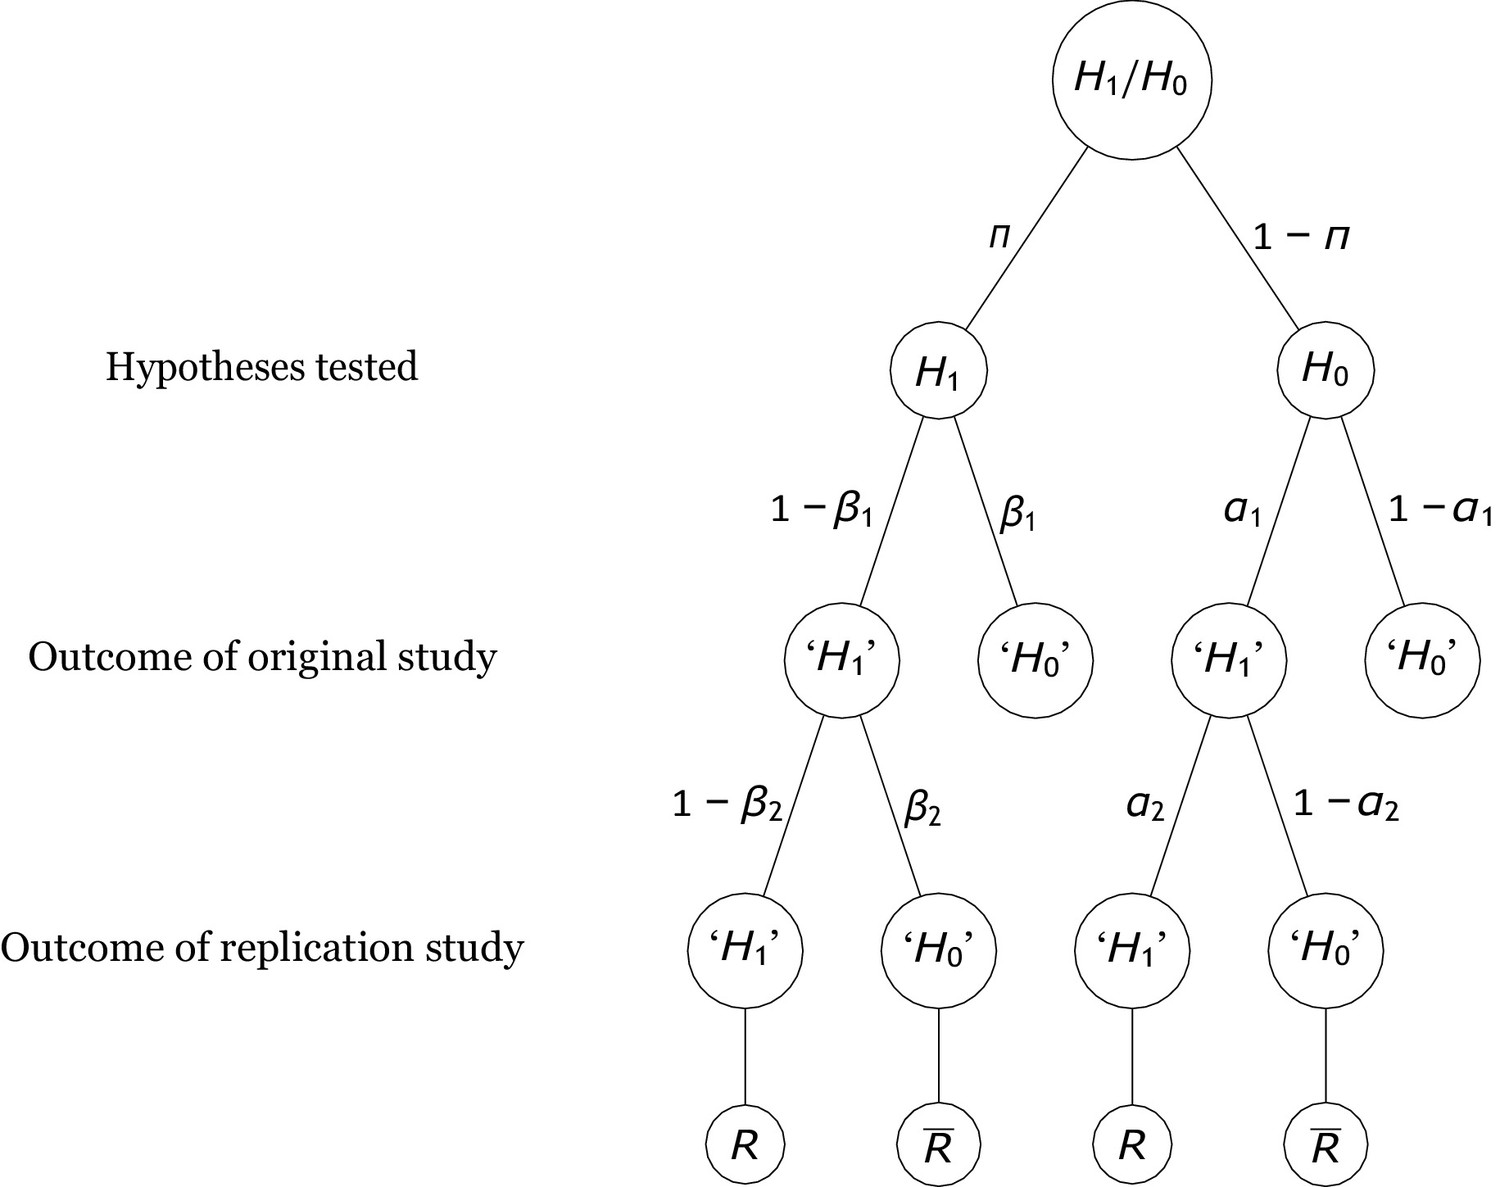
Probability tree of the replication scenario.
The base rates of examining an alternative hypothesis or a null hypothesis are and , respectively. The statistical power and the Type 1 error rate of the original study are and . There are four possible outcomes of an original study, with the researcher deciding to reject the null hypothesis (i.e., ‘’) in two outcomes and failing to reject it (i.e., ‘’) in the other two. If is true, the outcomes associated with these decisions are called true positives and false negatives. By contrast, if holds, they are called false positives and true negatives. Replication studies replicate original studies that reported a significant positive result. The statistical power and the Type 1 error probability of the replication study are and , respectively. The replication study may either reject (which denotes a successful replication of the original positive result, ) or fail to reject it (which denotes a failure to replicate the original result, ).
Figure 2
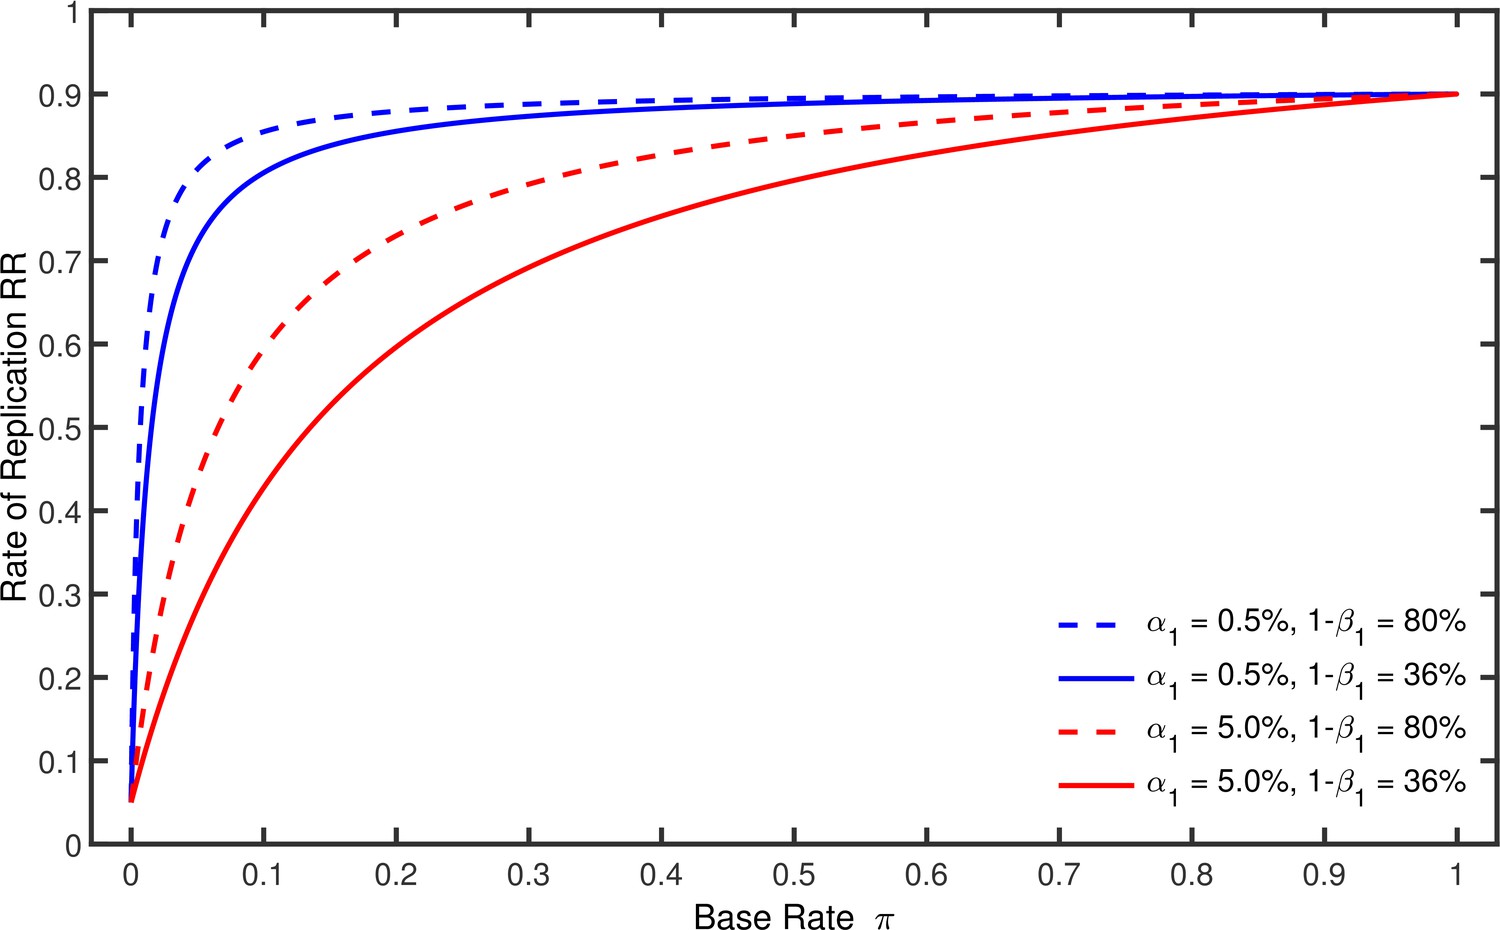
Rate of replication as a function of base rate .
Each line represents a different combination of the nominal alpha level and the statistical power used by the original studies. The nominal alpha level and the power of the replication studies were always % and %.
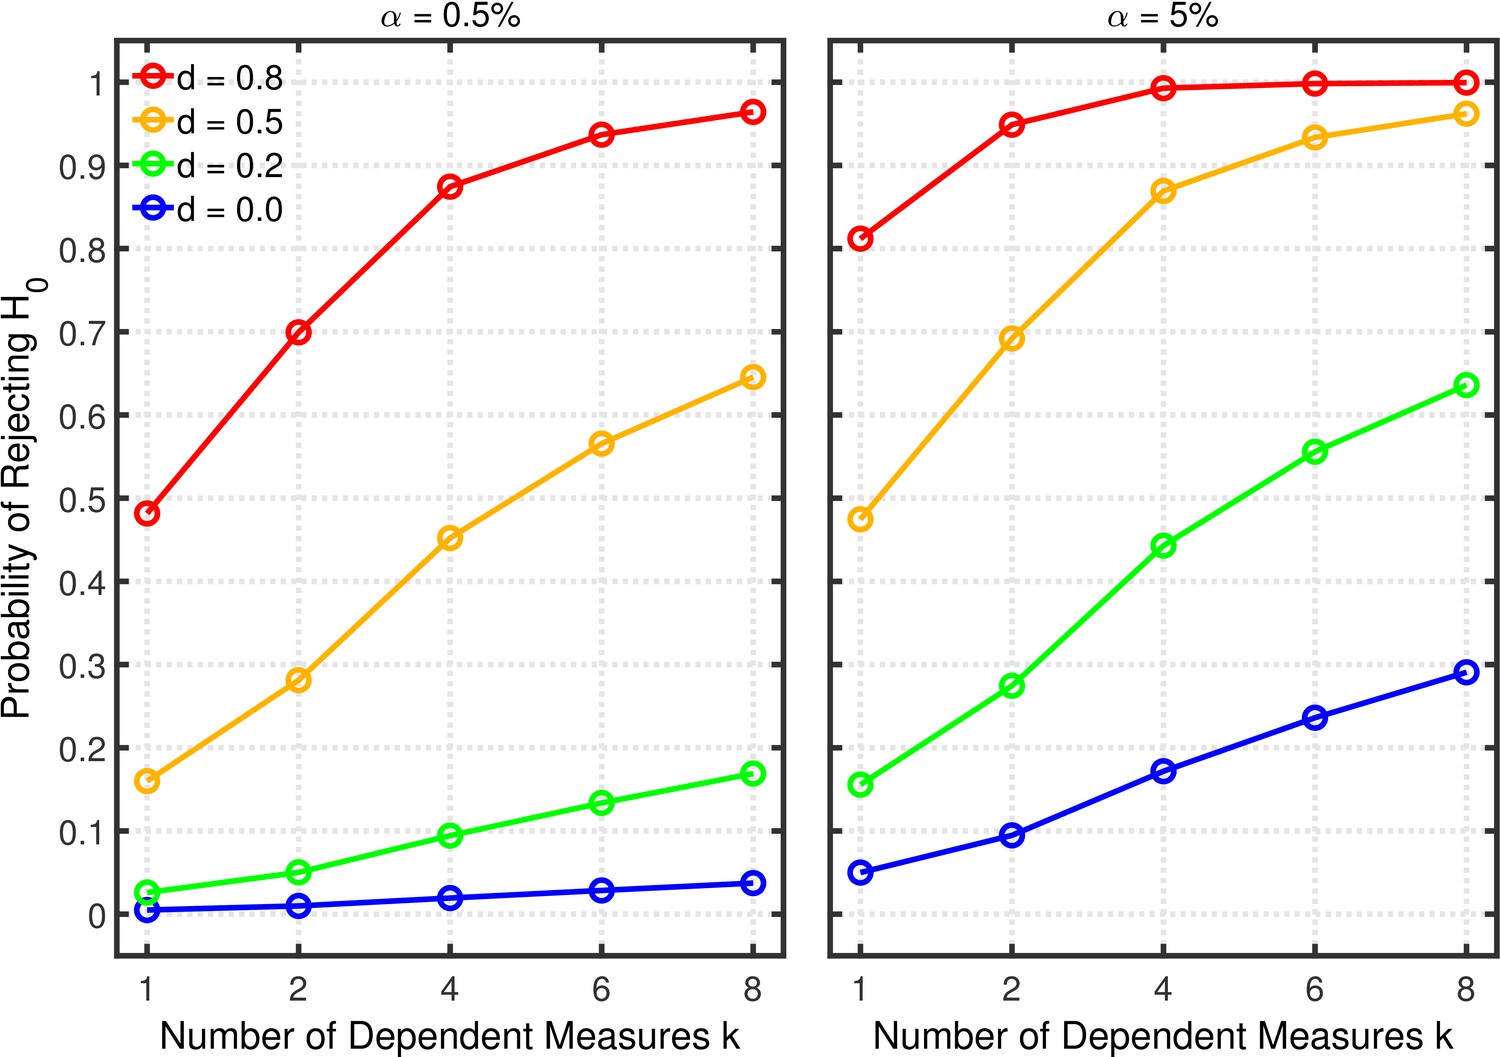
Figure 3 with 1 supplement
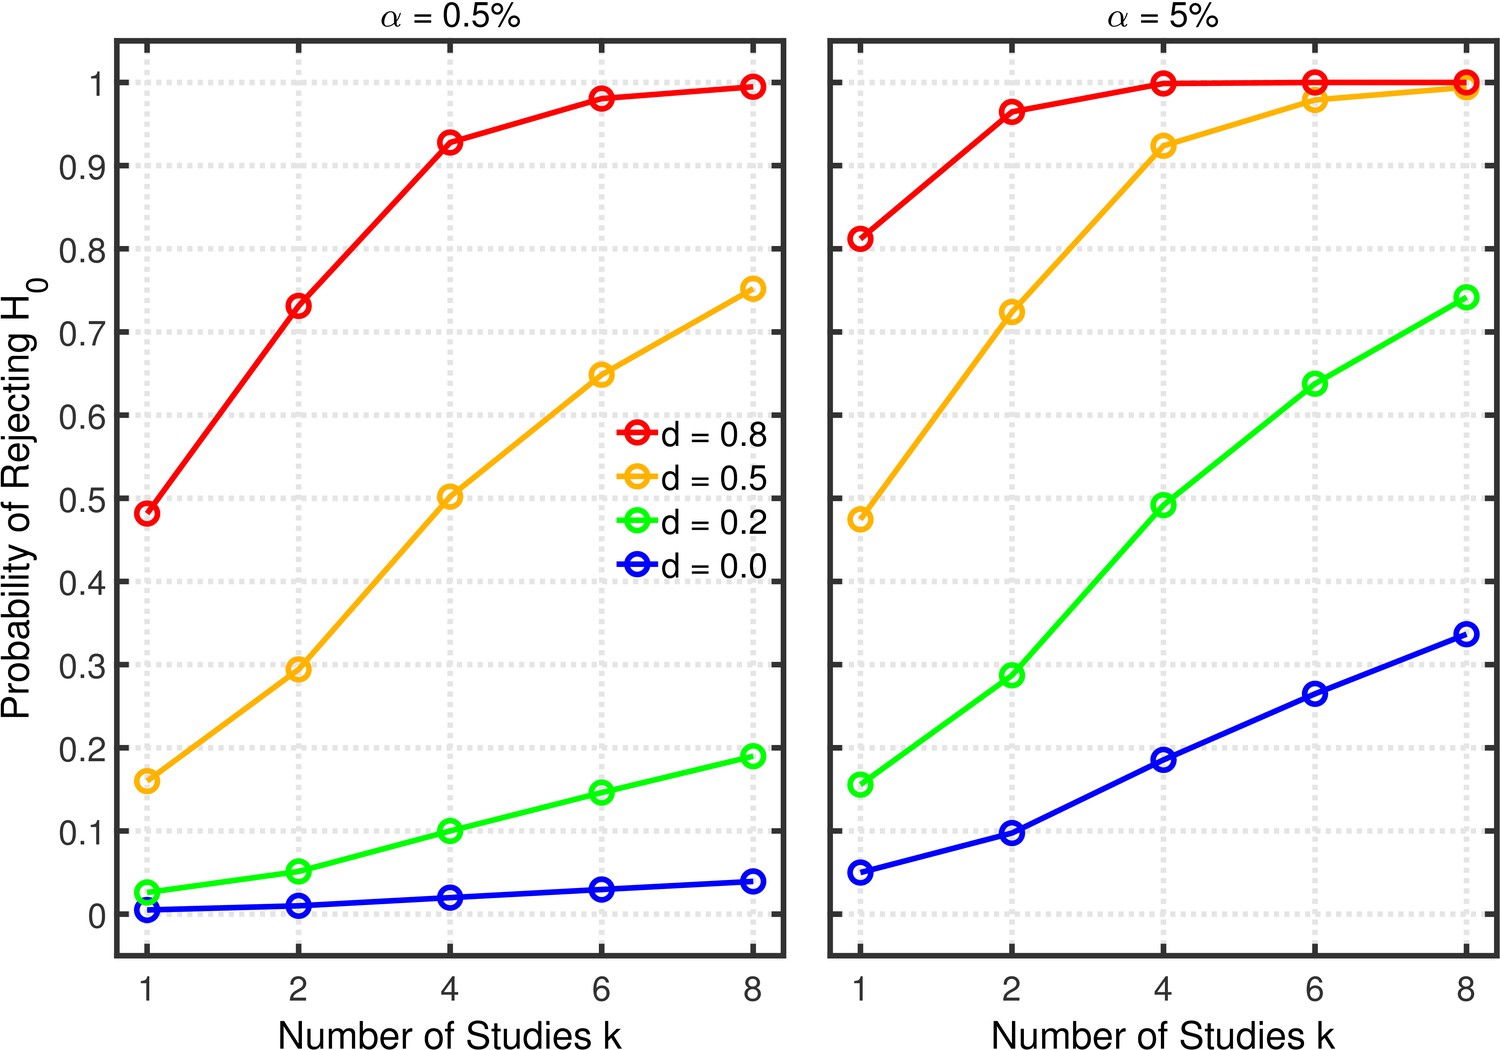
Selective reporting of significant studies.
Each panel depicts the probability of rejecting in at least one study as a function of the number of studies , nominal level, and effect size for a two-sample test with participants in each sample.
Figure 3—figure supplement 1
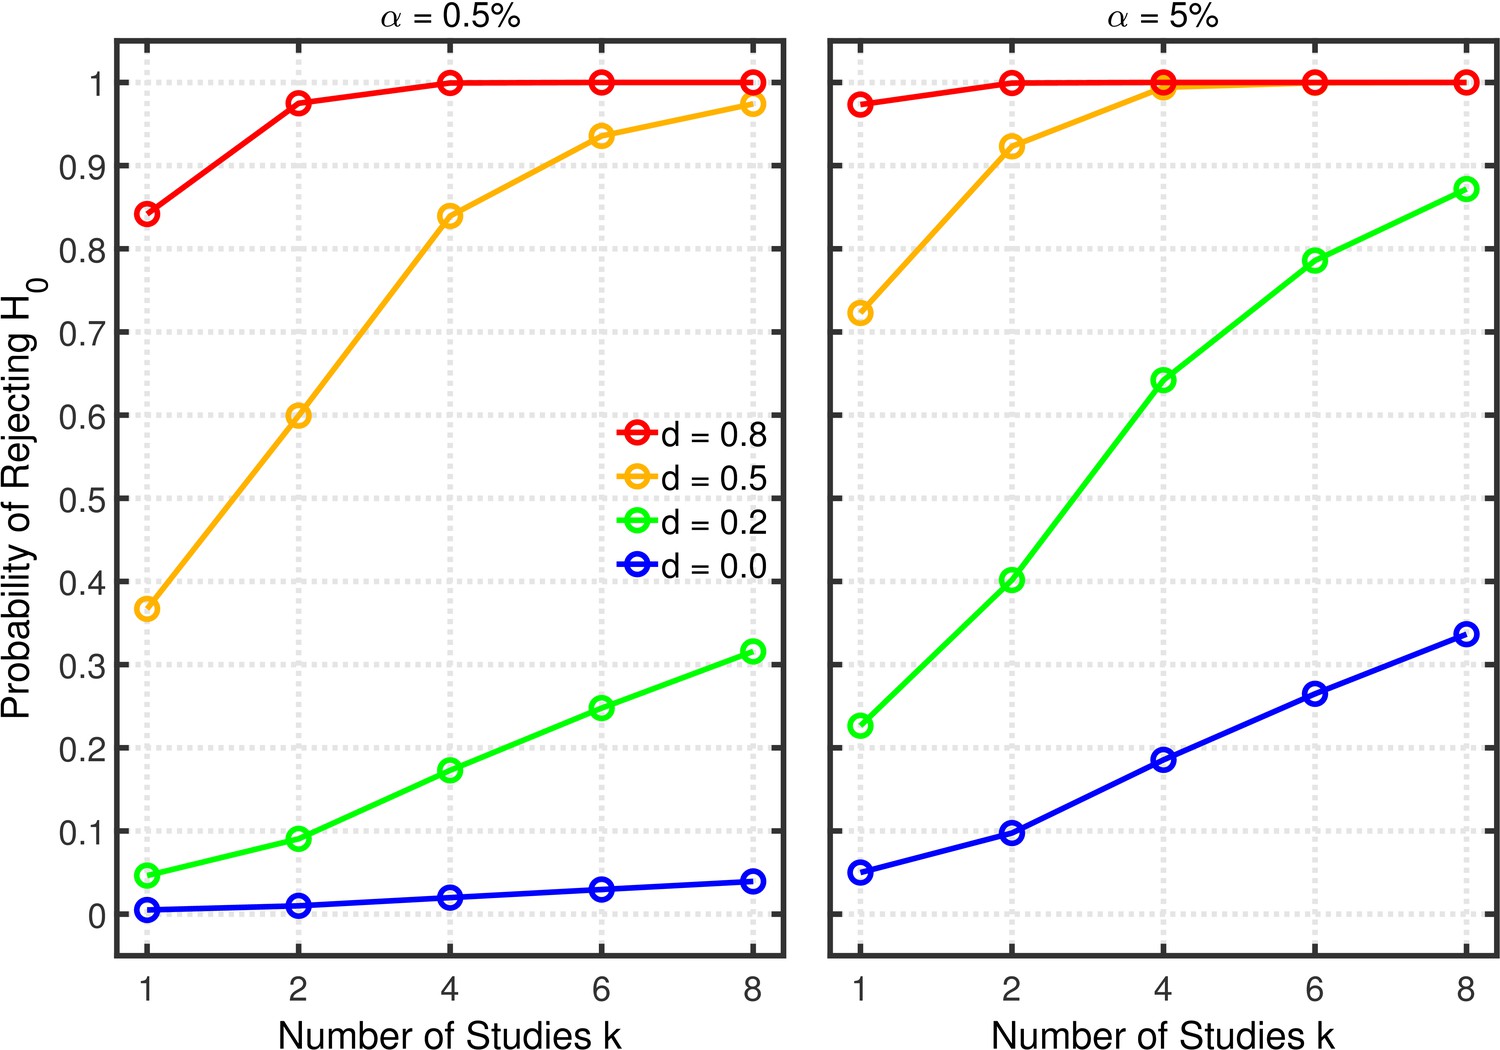
Selective reporting of significant studies.
Each panel depicts the probability of rejecting in at least one study as a function of the number of studies , nominal level, and effect size for a one-sample test with .
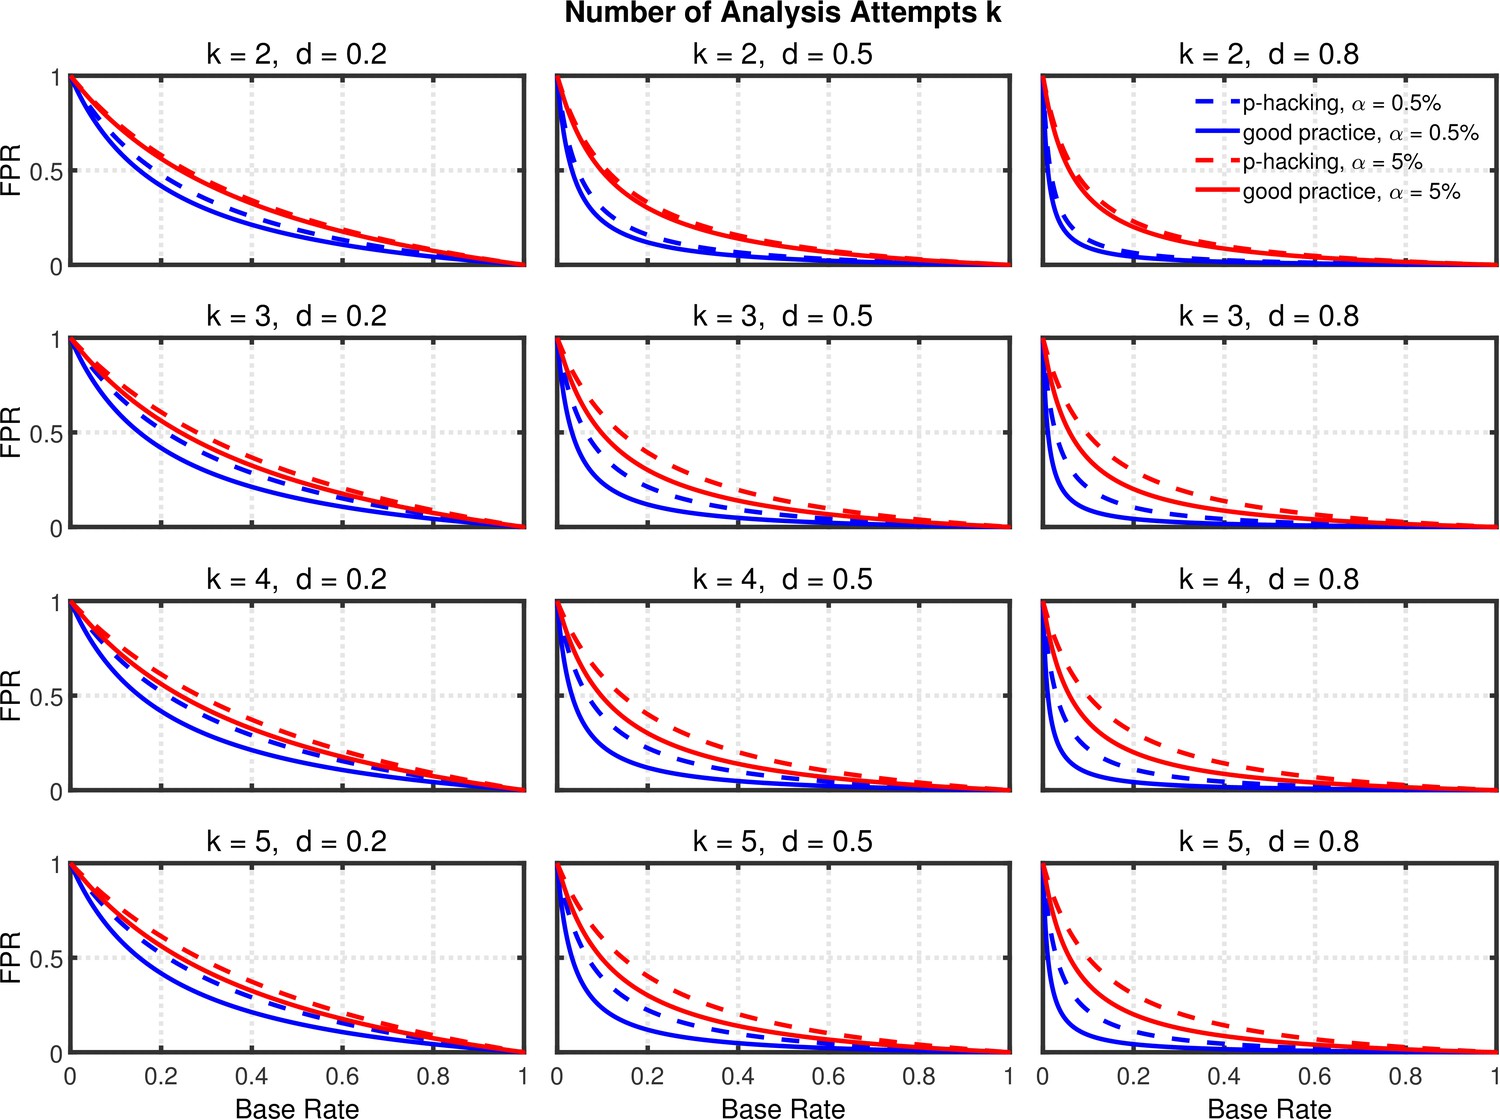
Figure 4 with 1 supplement
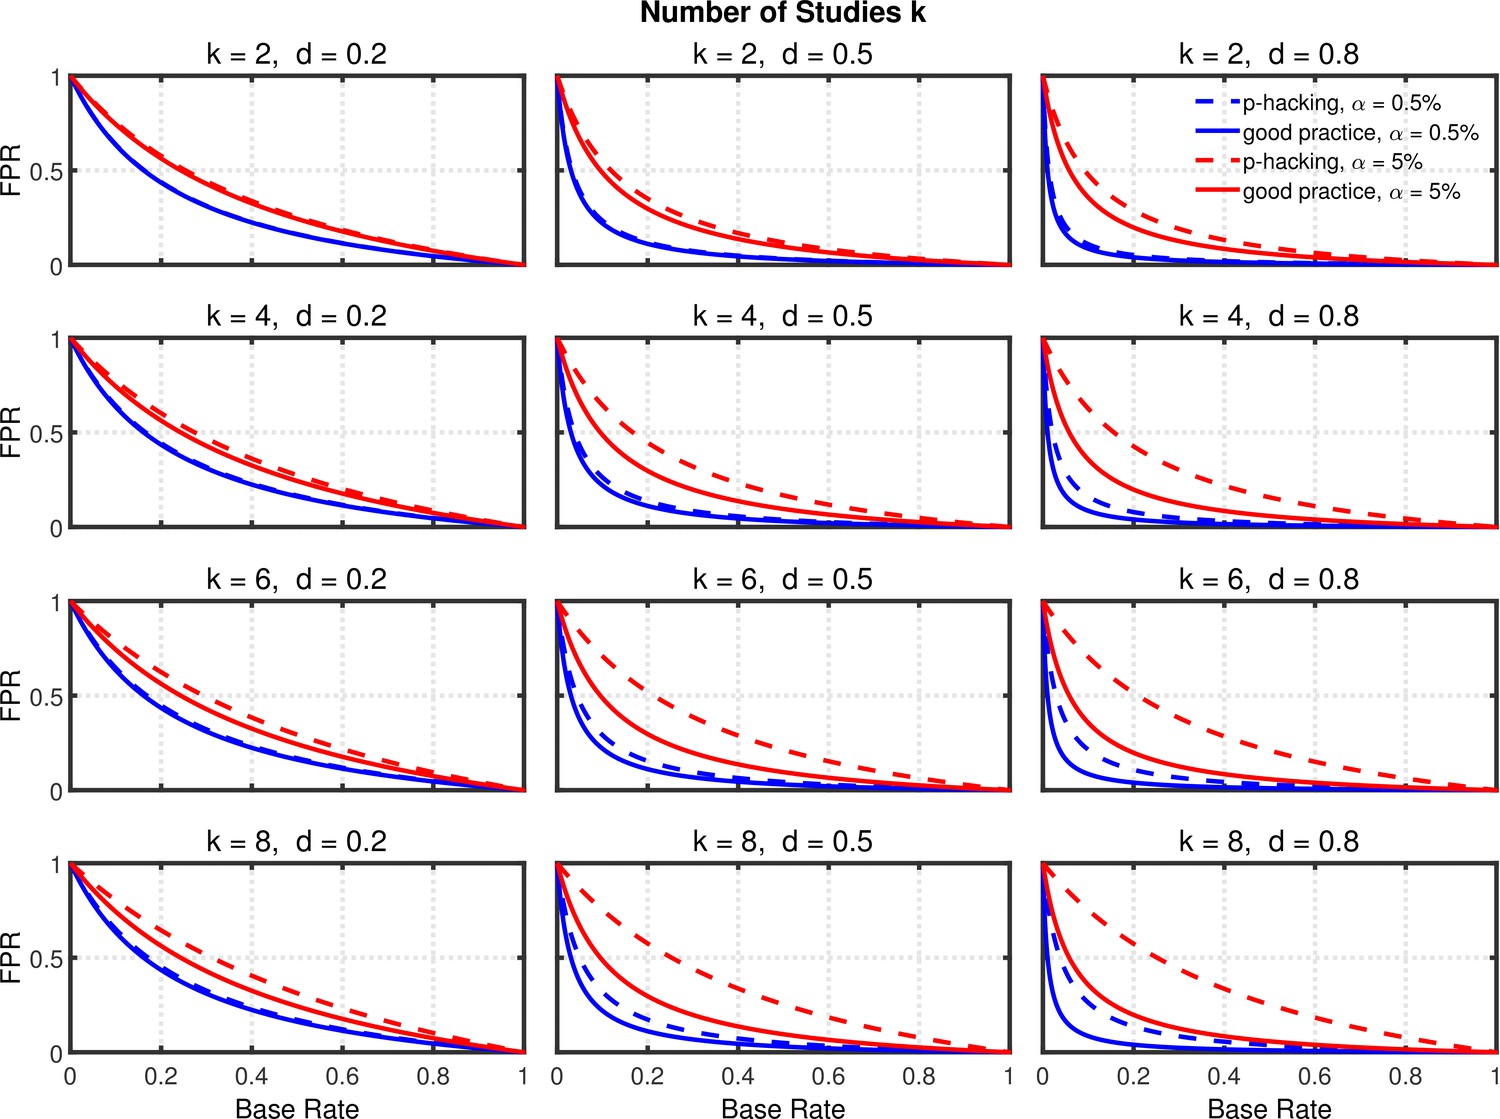
Selective reporting of significant studies.
False positive rate (FPR) as a function of base rate , number of studies , effect size , and nominal level (0.5% or 5%). The nominal level and power of the replication study are % and %. All results are based on per group. Dashed lines give the results for p-hacking whereas solid lines depict the results of researchers who act in accord with good scientific practice. Note that the solid lines are the same in all rows of a single column because these constant reference lines do not depend on .
Figure 4—figure supplement 1
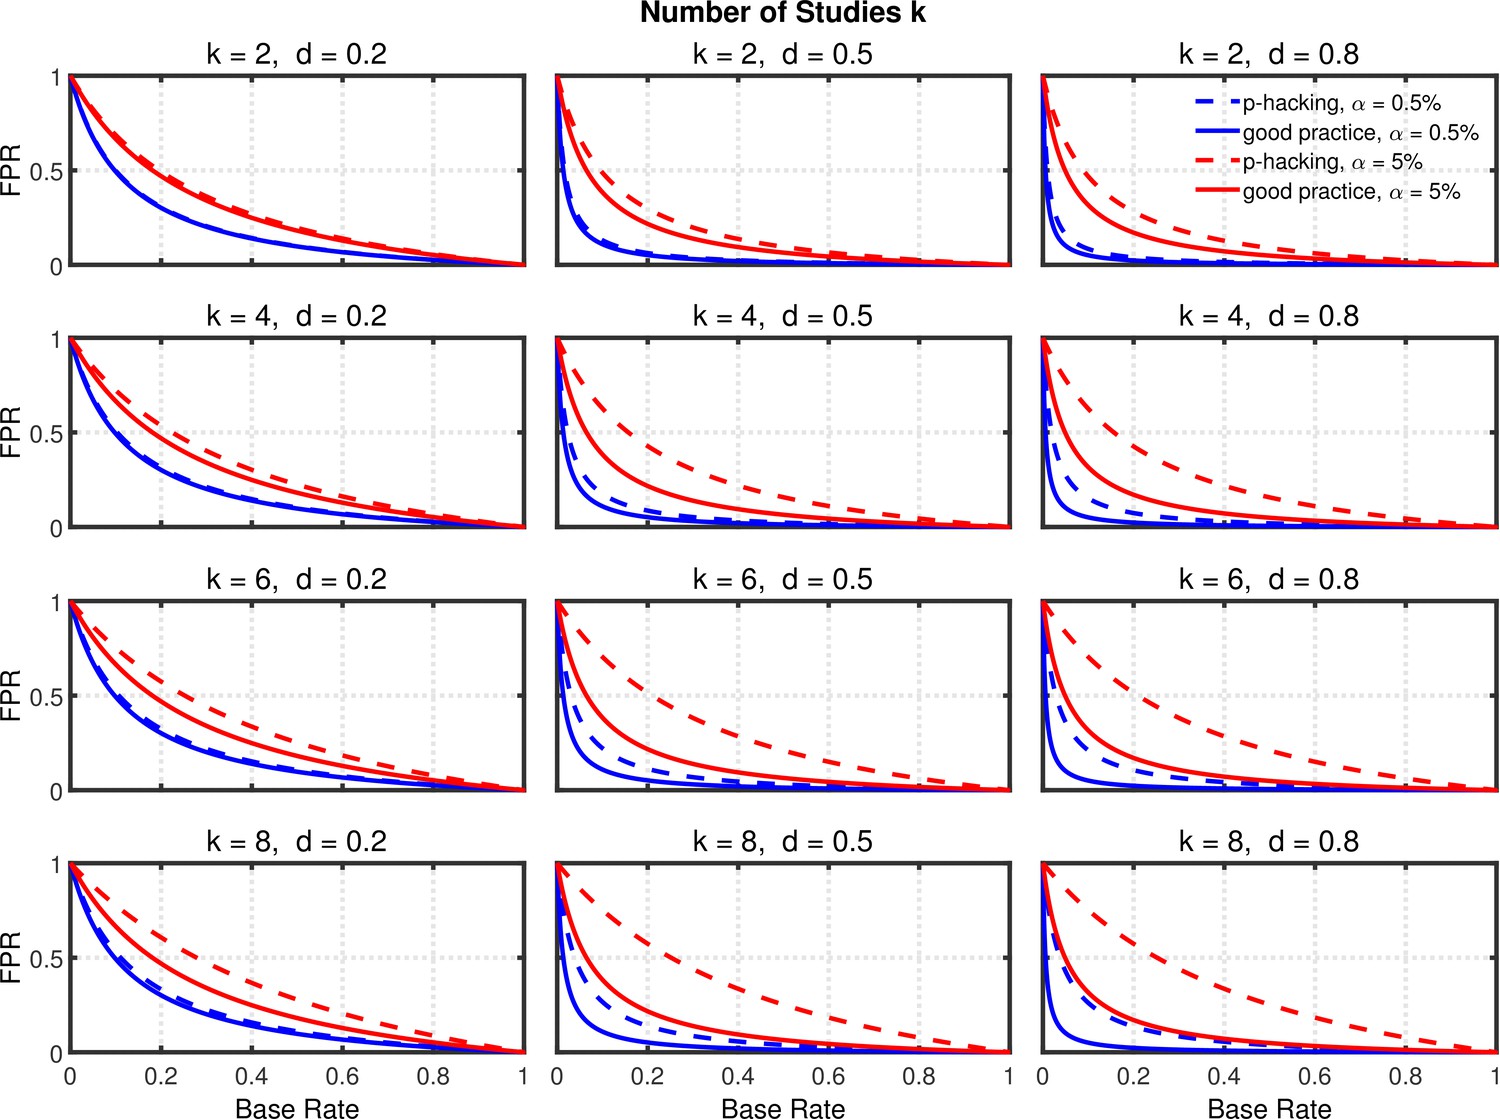
Selective reporting of significant studies.
False positive rate (FPR) as a function of base rate , number of studies , effect size , and nominal level (0.5% or 5%). The nominal level and power of the replication study are % and %. All results are based on one-sample tests with .
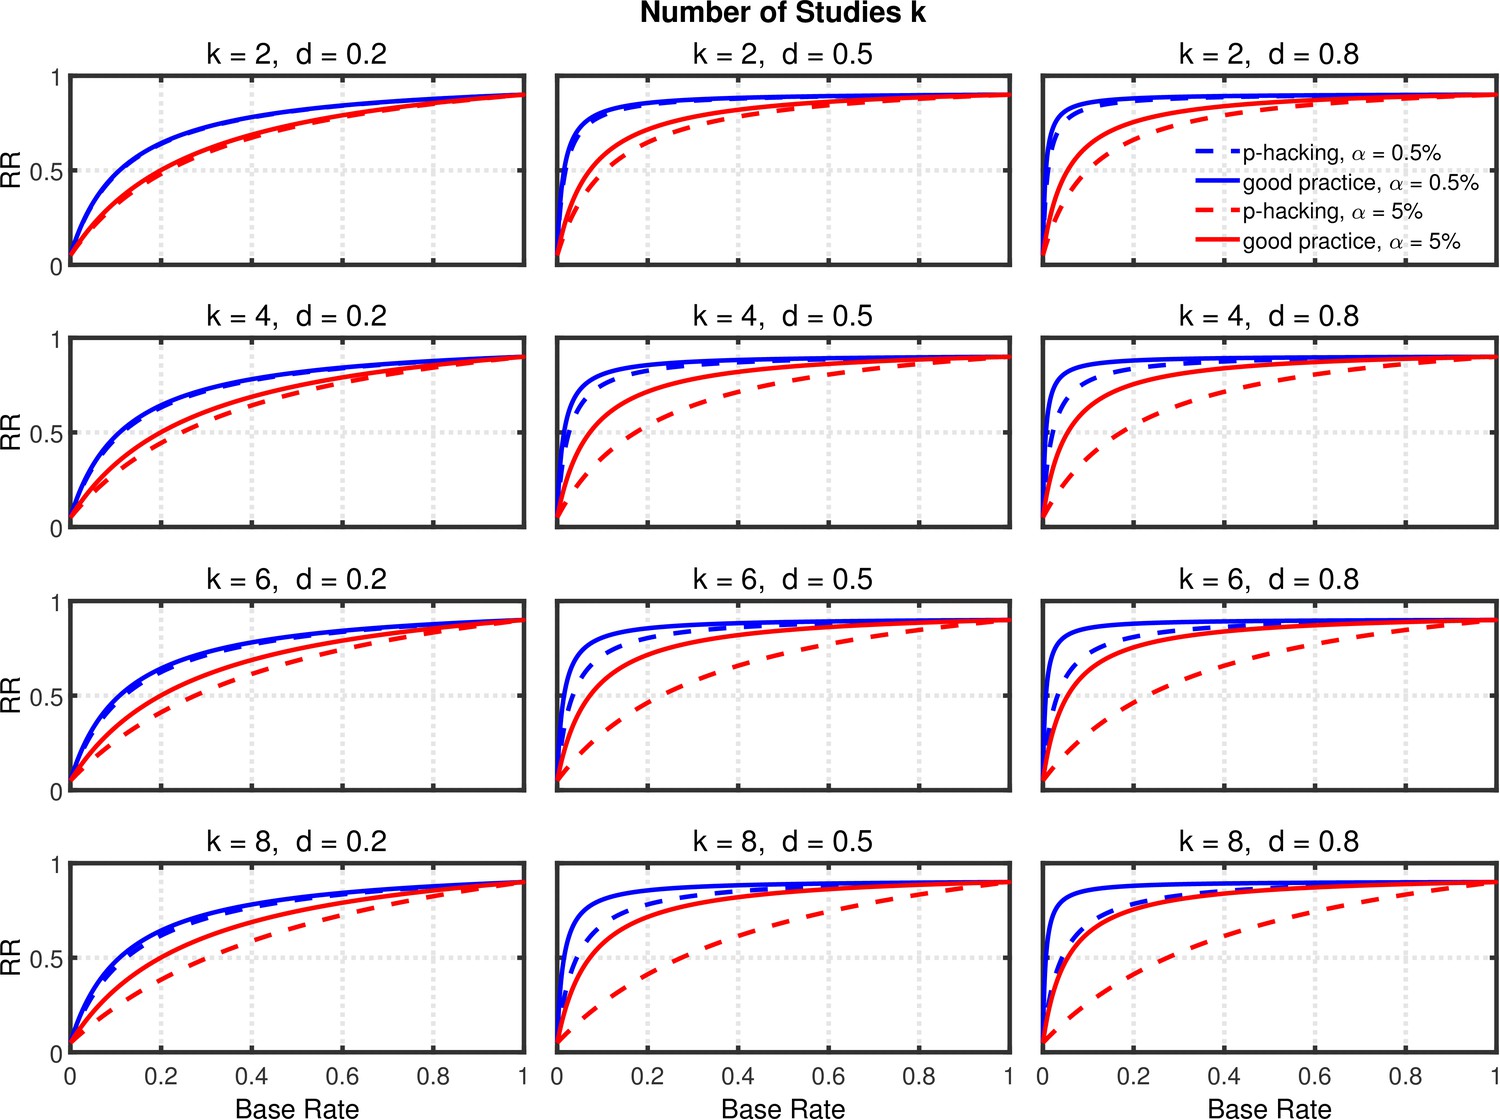
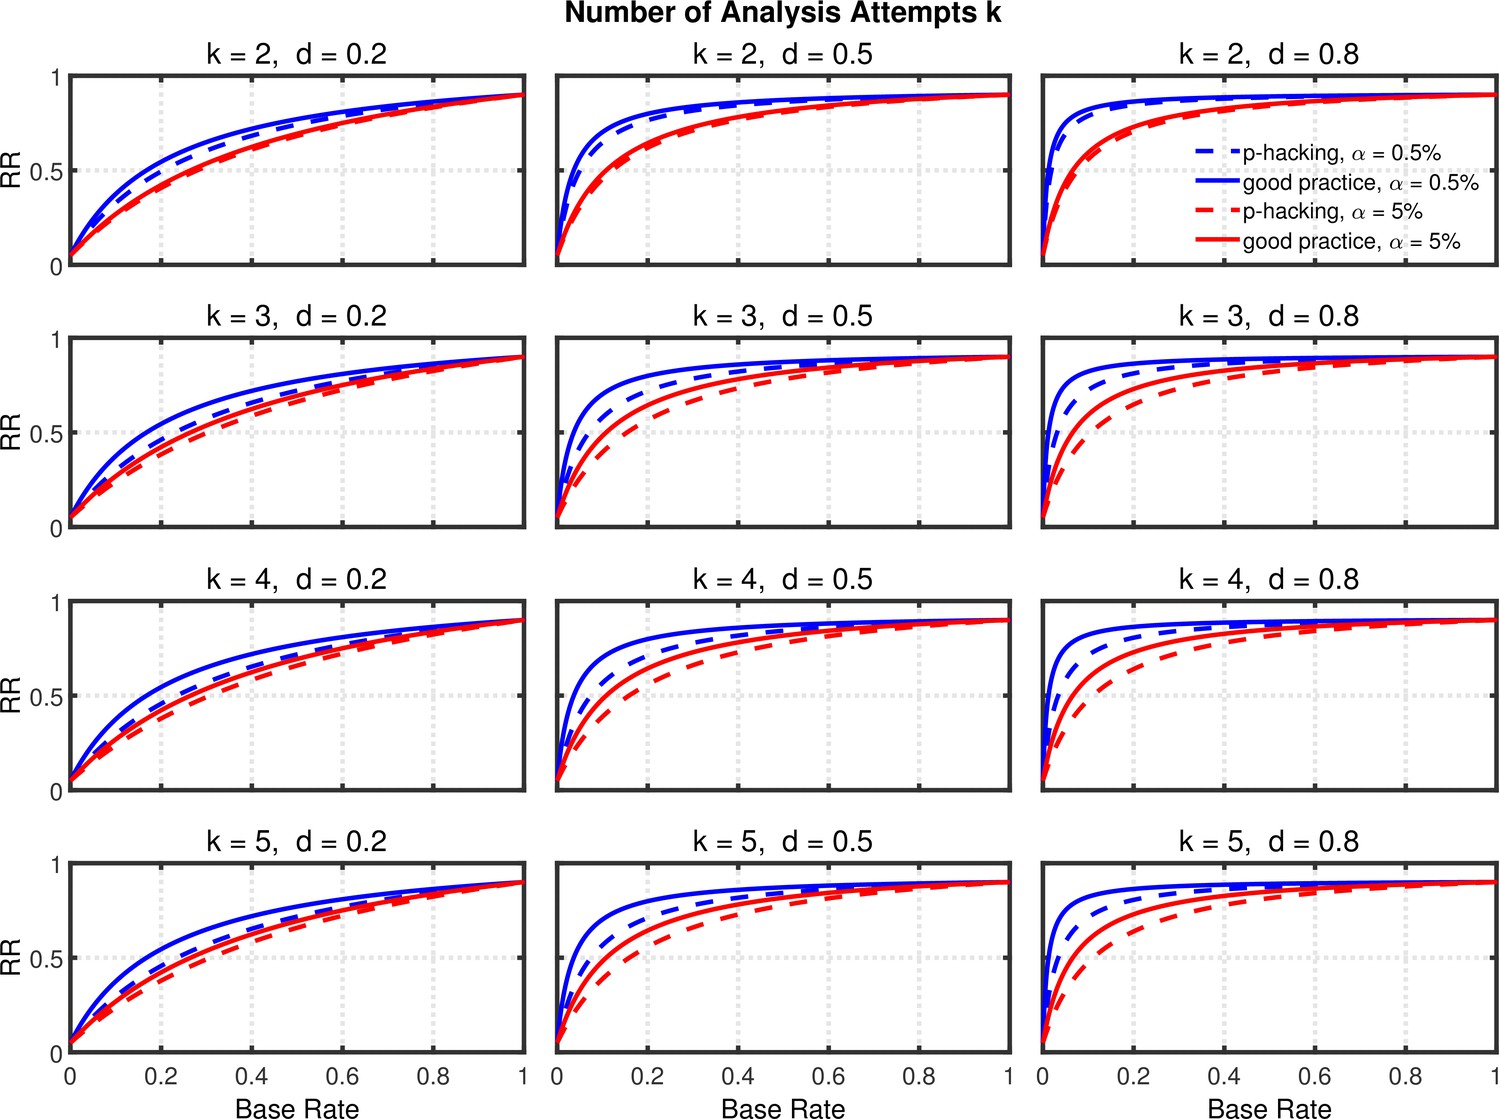
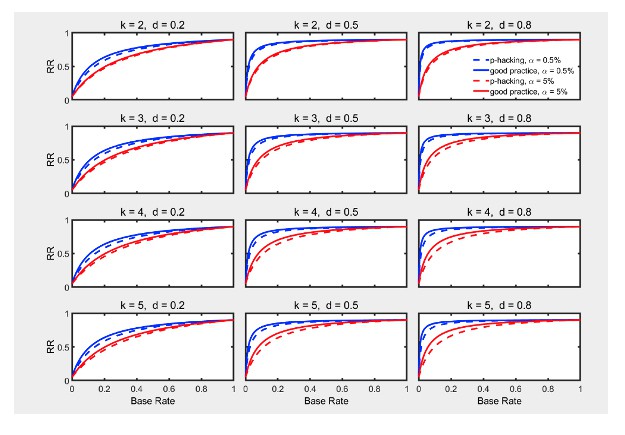
Figure 5 with 3 supplements
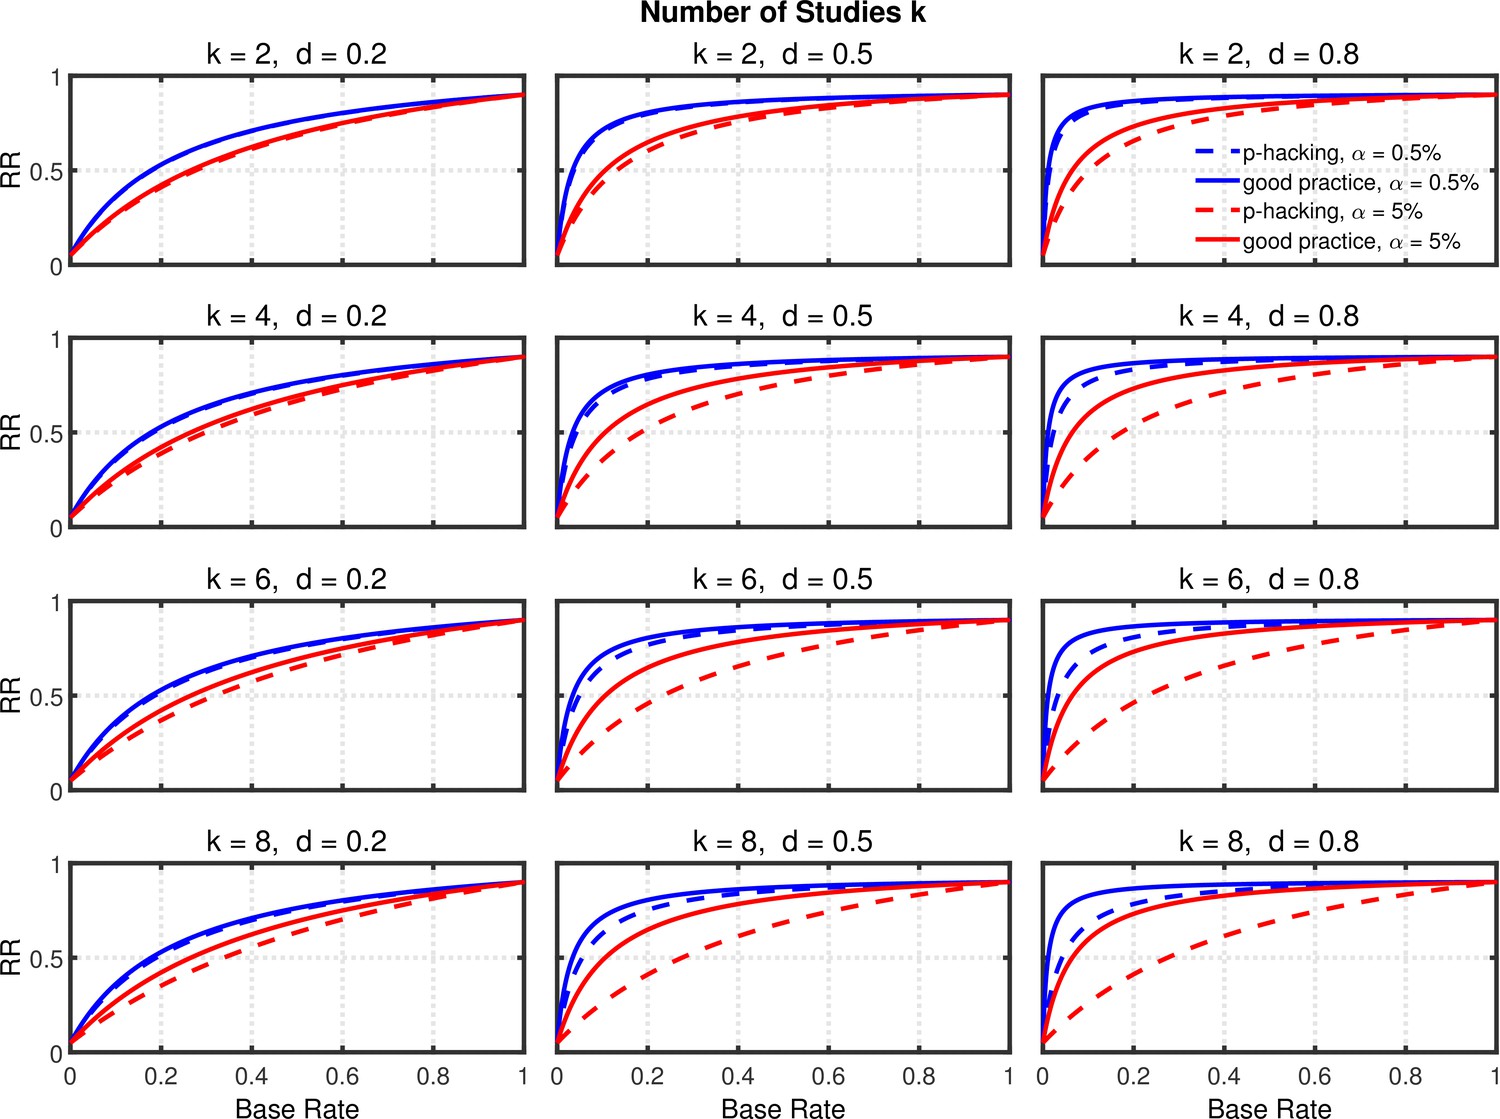
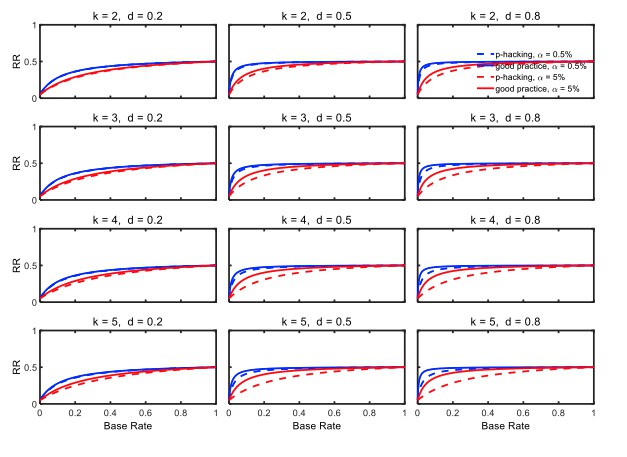
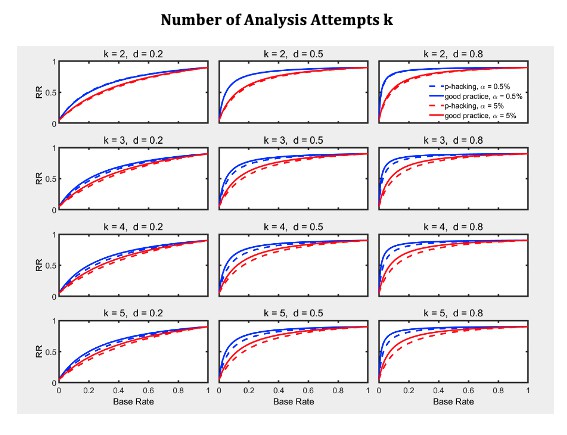
Selective reporting of significant studies.
Replication rate (RR) as a function of base rate , number of studies , effect size , and nominal level (0.5% or 5%). The nominal level and power of the replication study are % and %. All results are based on per group. Dashed lines give the results for p-hacking whereas solid lines depict the results of researchers who act in accord with good scientific practice. Note that the solid lines are the same in all rows of a single column because these constant reference lines do not depend on k.
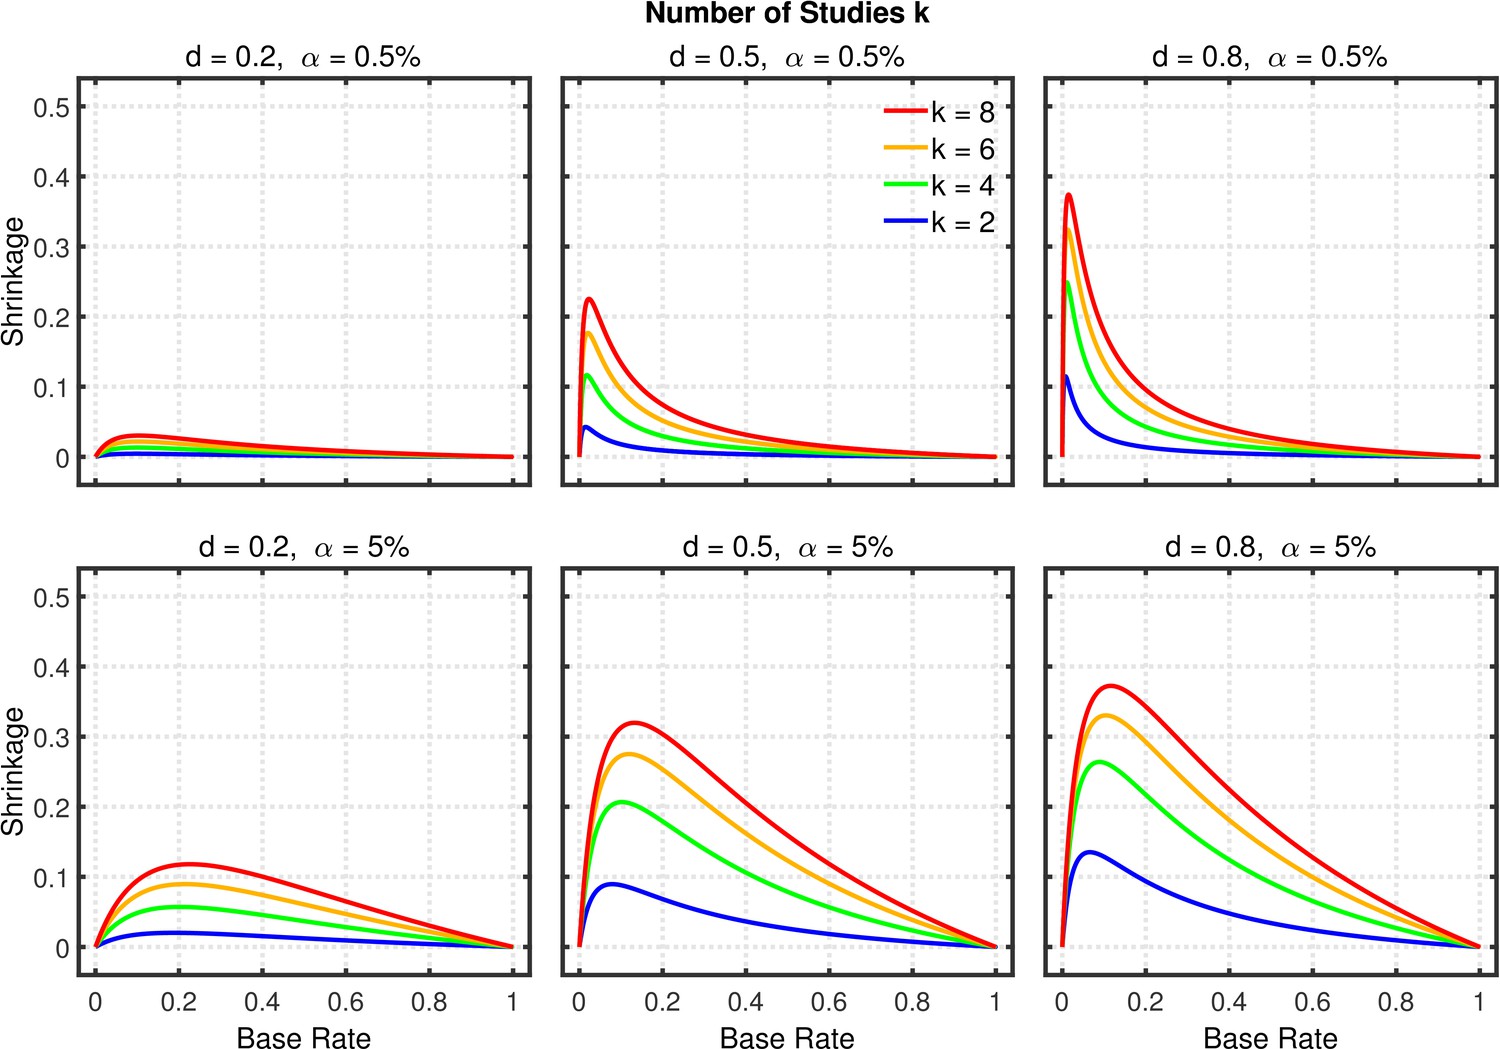
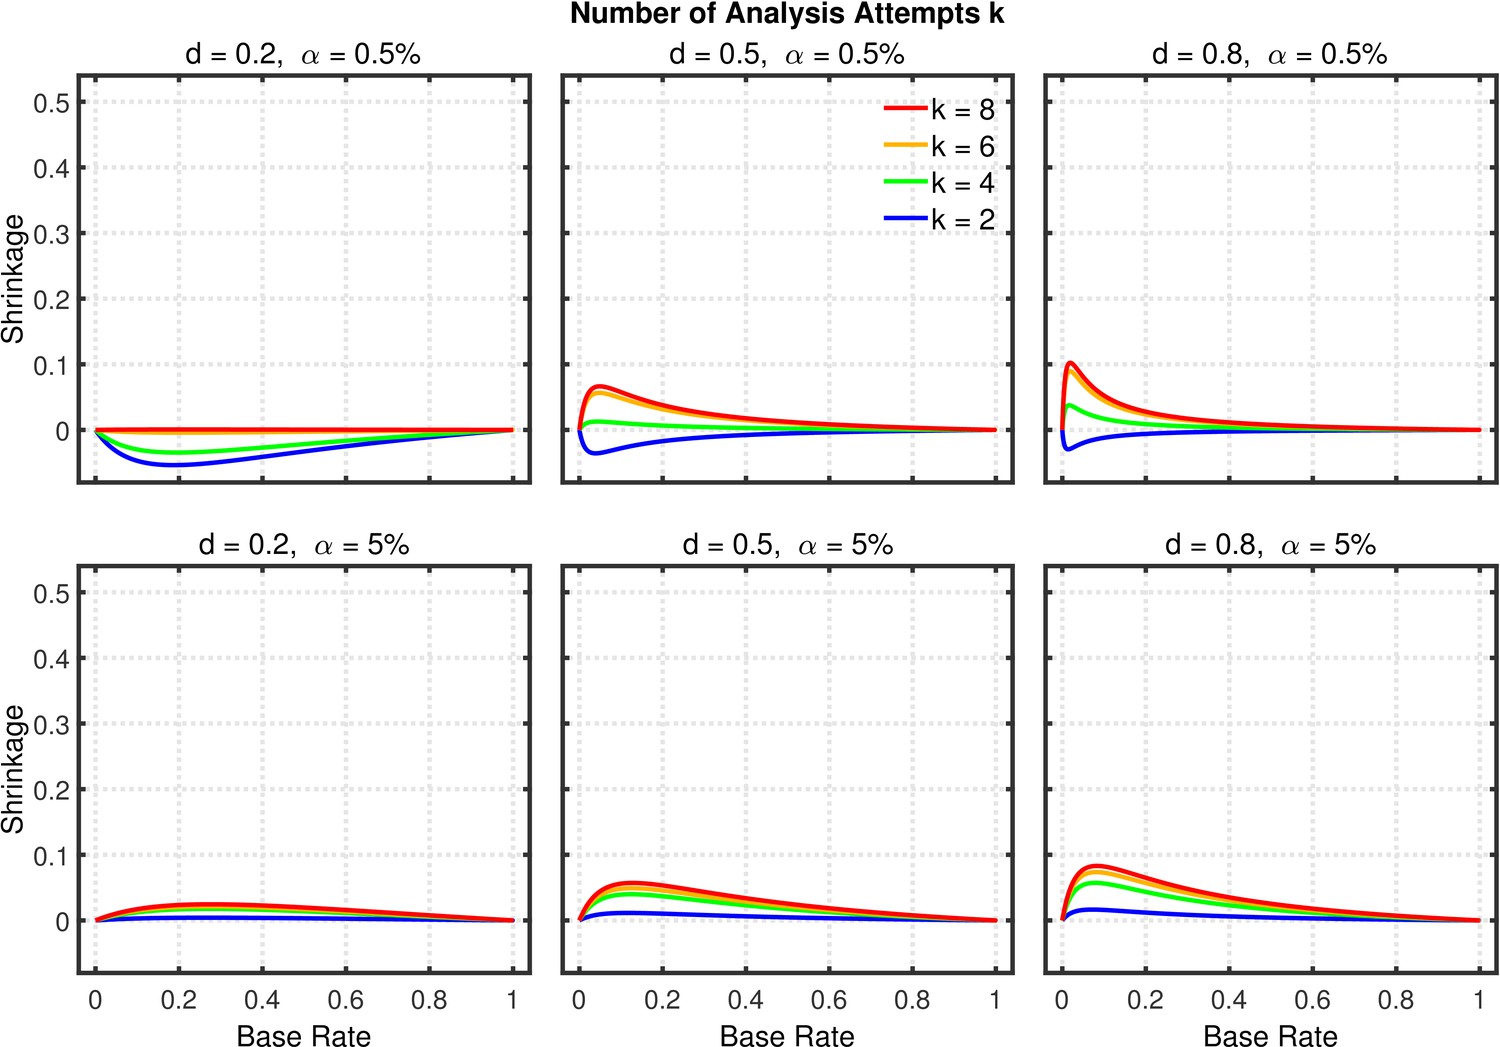
Figure 5—figure supplement 1
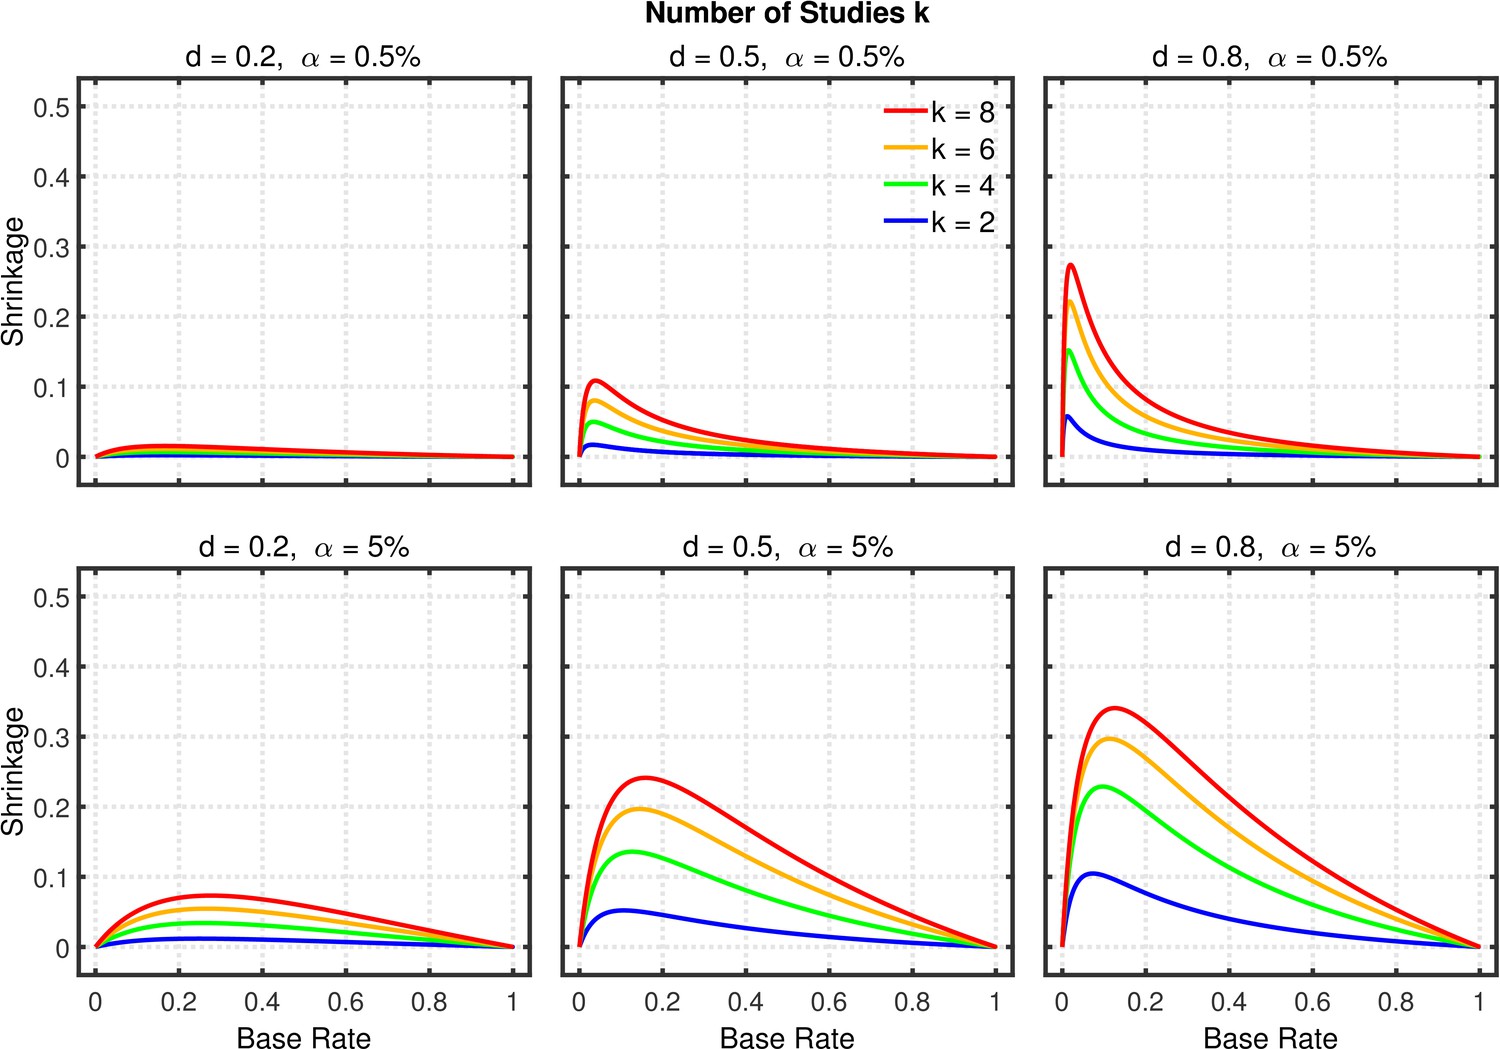
Selective reporting of significant studies.
Shrinkage of the replication rate (i.e., the difference between the solid line and the dashed line in Figure 5) as a function of base rate , number of studies , effect size , and nominal level (0.5% or 5%).
Figure 5—figure supplement 2
Selective reporting of significant studies.
Replication rate (RR) as a function of base rate , number of studies , effect size , and nominal level (0.5% or 5%). The nominal level and power of the replication study are % and %. All results are based on one-sample tests with .
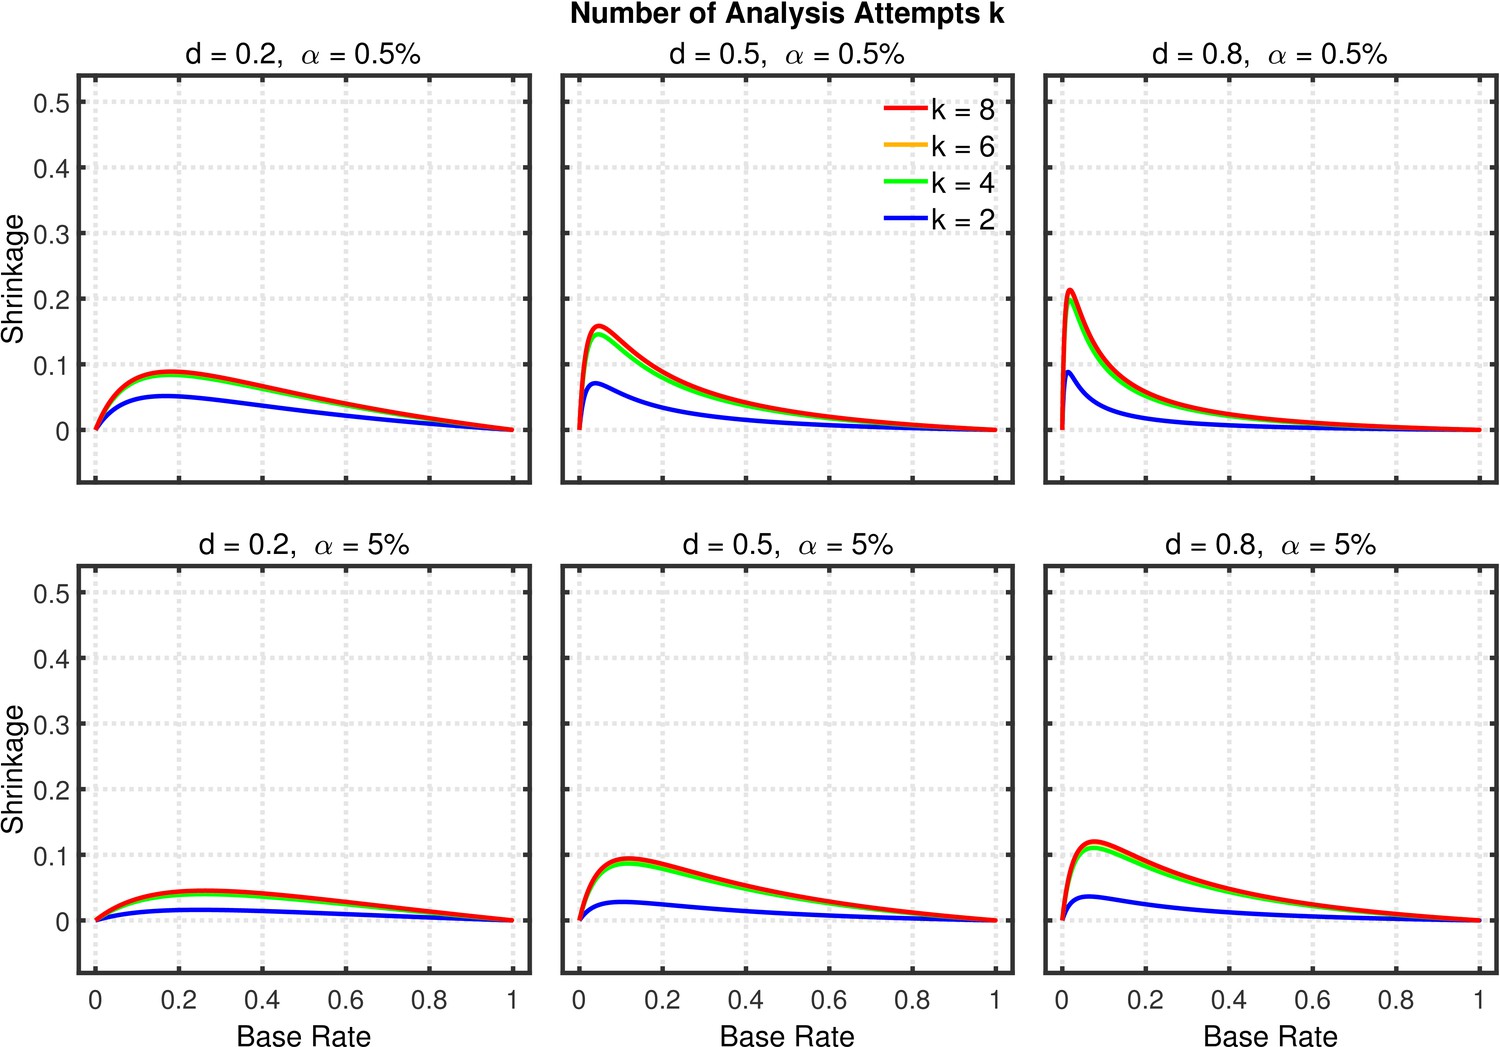
Figure 5—figure supplement 3
Selective reporting of significant studies.
Shrinkage of the replication rate (i.e., the difference between the solid line and the dashed line in Figure 5—figure supplement 2) as a function of base rate , number of studies , effect size , and nominal level (0.5% or 5%).
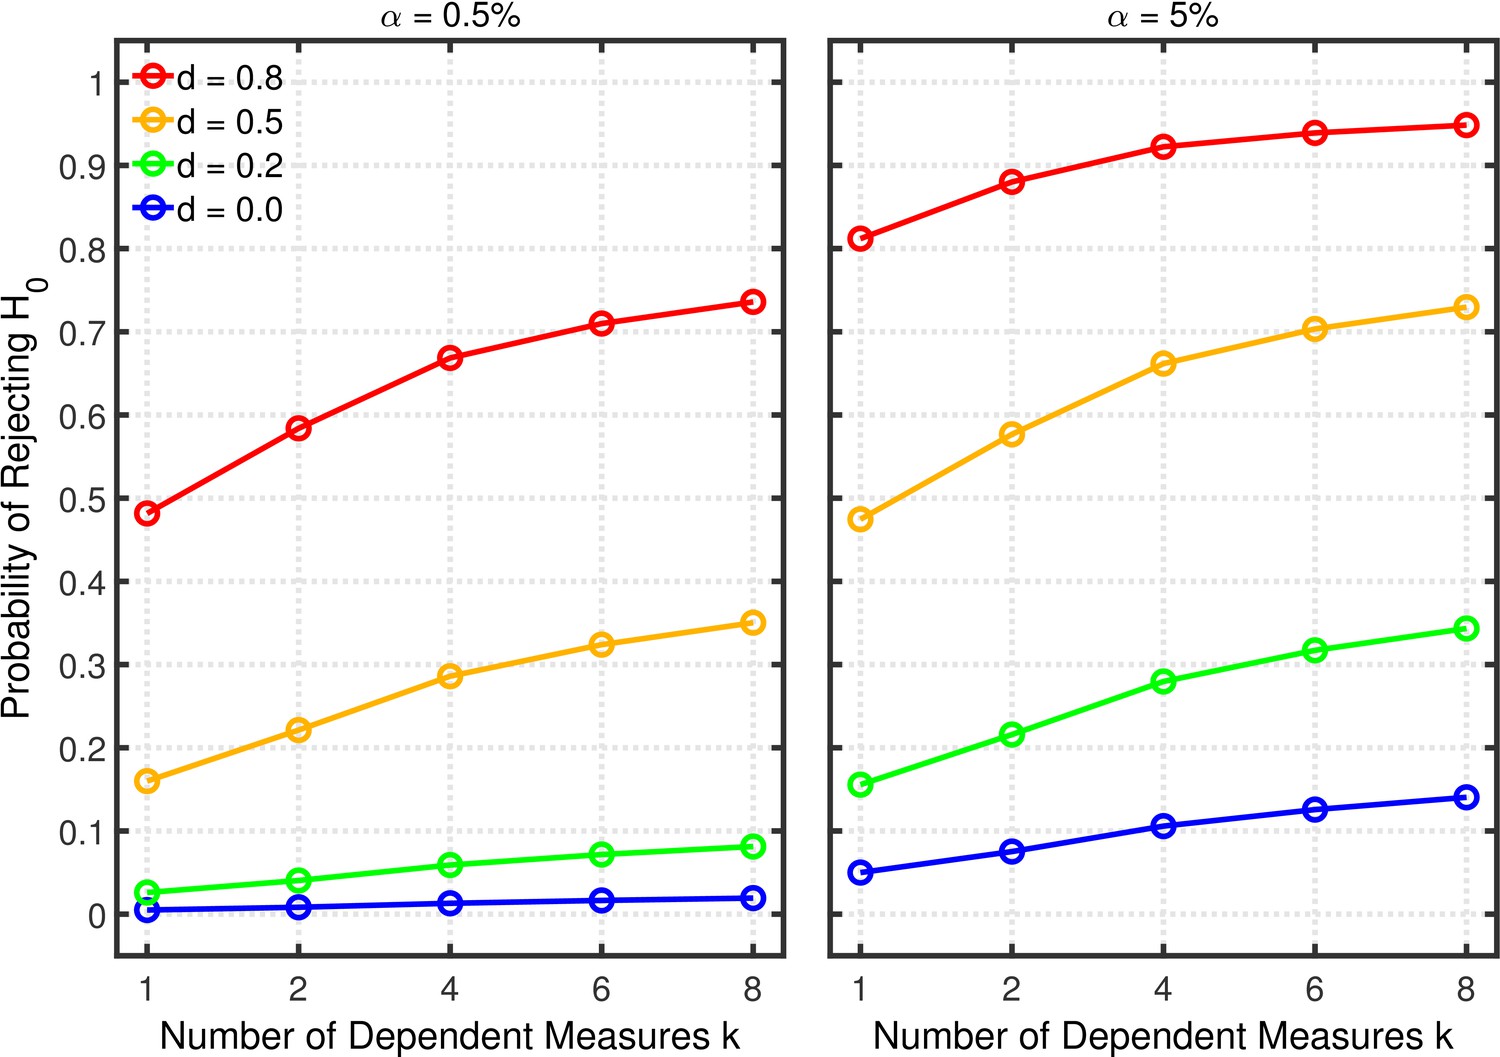
Figure 6 with 1 supplement
Failing to report all dependent measures.
Each panel depicts the probability of rejecting as a function of the number of dependent measures , nominal level, and effect size for a two-sample test with participants per group and dependent measure intercorrelations of 0.2.
Figure 6—figure supplement 1
Failing to report all dependent measures.
Each panel depicts the probability of rejecting as a function of the number of dependent measures , nominal level, and effect size for a two-sample test with participants per group and dependent measure intercorrelations of 0.8.
Figure 7 with 1 supplement
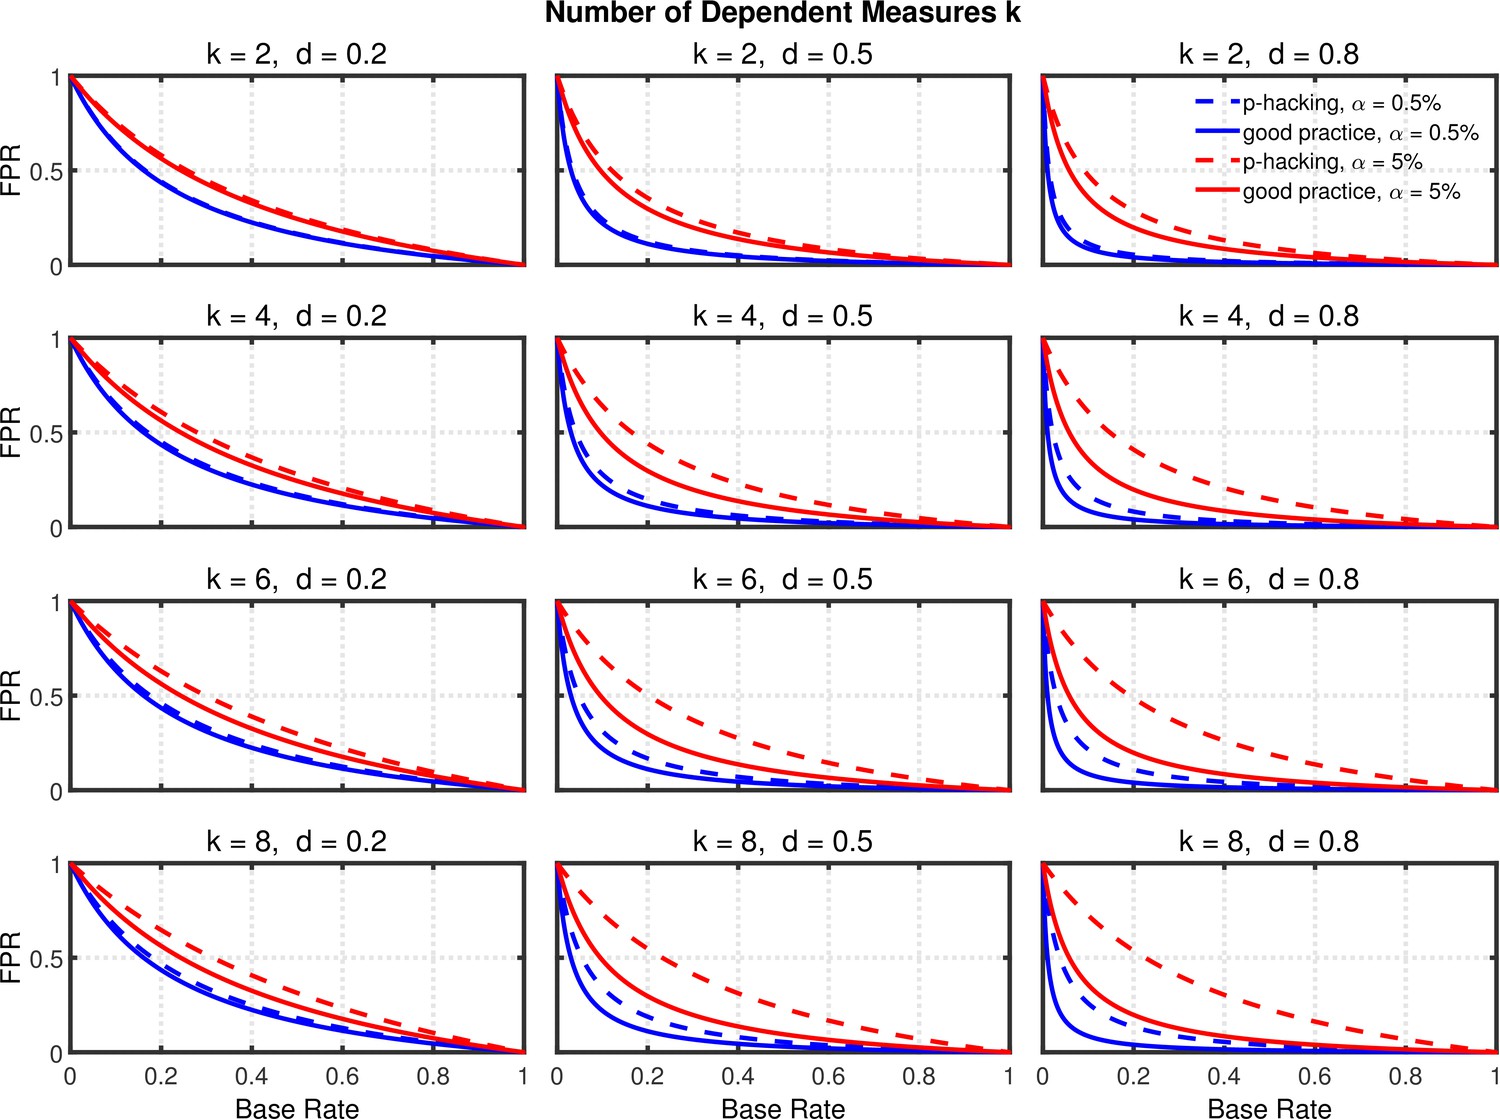
Failing to report all dependent measures.
False positive rate (FPR) as a function of base rate , number of dependent measures , effect size , and nominal level (0.5% or 5%). The nominal level and power of the replication study are % and %. All results are based on two-sample tests with per group and dependent measure intercorrelations of 0.2. Dashed lines give the results for p-hacking whereas solid lines depict the results of researchers who act in accord with good scientific practice. Note that the solid lines are the same in all rows of a single column because these constant reference lines do not depend on .
Figure 7—figure supplement 1
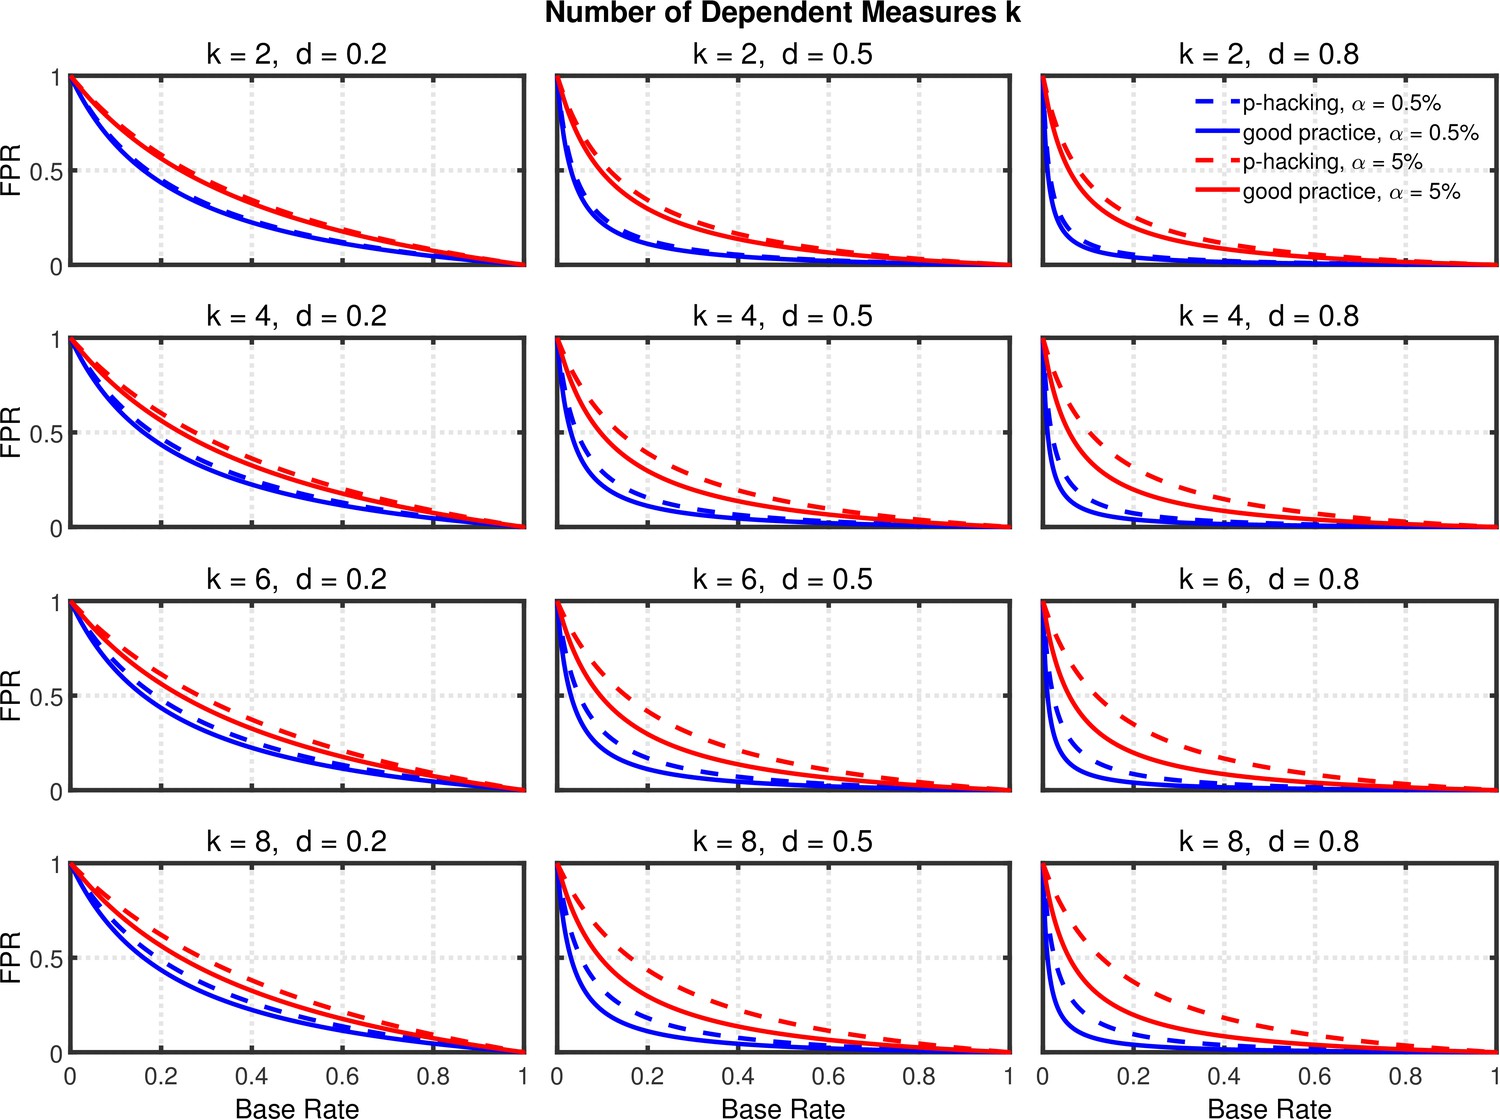
Failing to Report all Dependent Measures.
False positive rate (FPR) as a function of base rate , number of dependent measures , effect size , and nominal level (0.5% or 5%). The nominal level and power of the replication study are % and %. All results are based on two-sample tests with participants per group and dependent measure intercorrelations of 0.8.
Figure 8 with 3 supplements
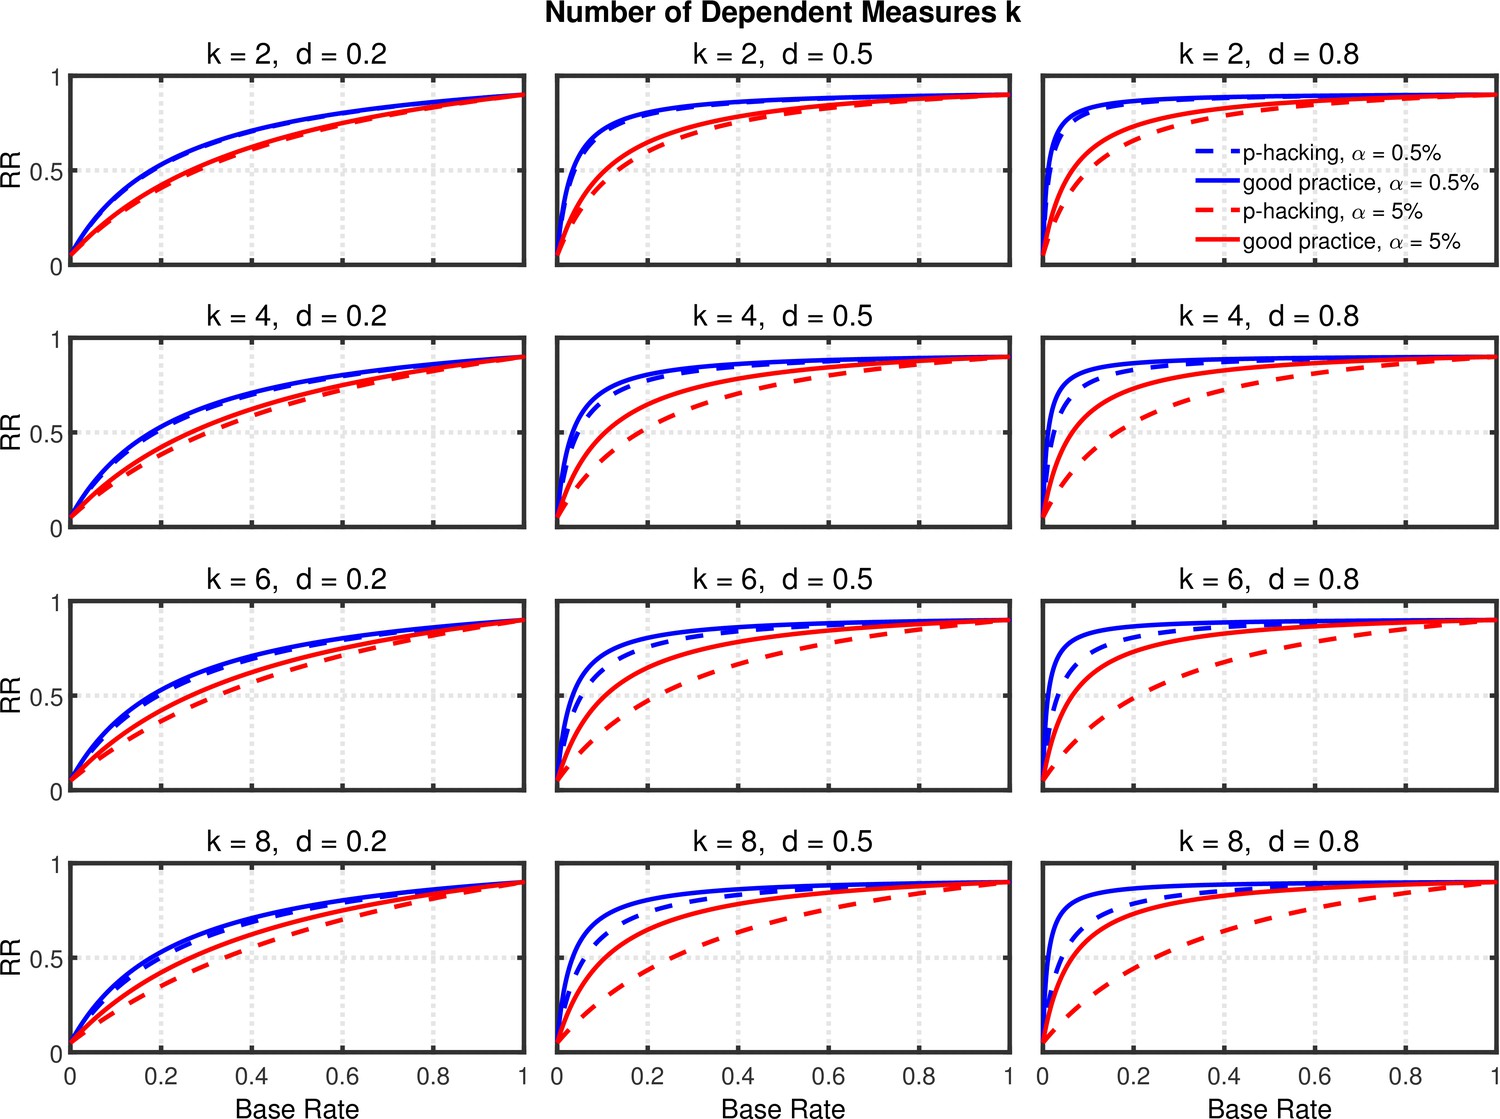
Failing to report all dependent measures.
Replication rate (RR) as a function of base rate , number of dependent measures , effect size , and nominal level (0.5% or 5%). The nominal level and power of the replication study are % and %. All results are based on two-sample tests with per group and dependent measure intercorrelations of 0.2. Dashed lines give the results for p-hacking whereas solid lines depict the results of researchers who act in accord with good scientific practice. Note that the solid lines are the same in all rows of a single column because these constant reference lines do not depend on .
Figure 8—figure supplement 1
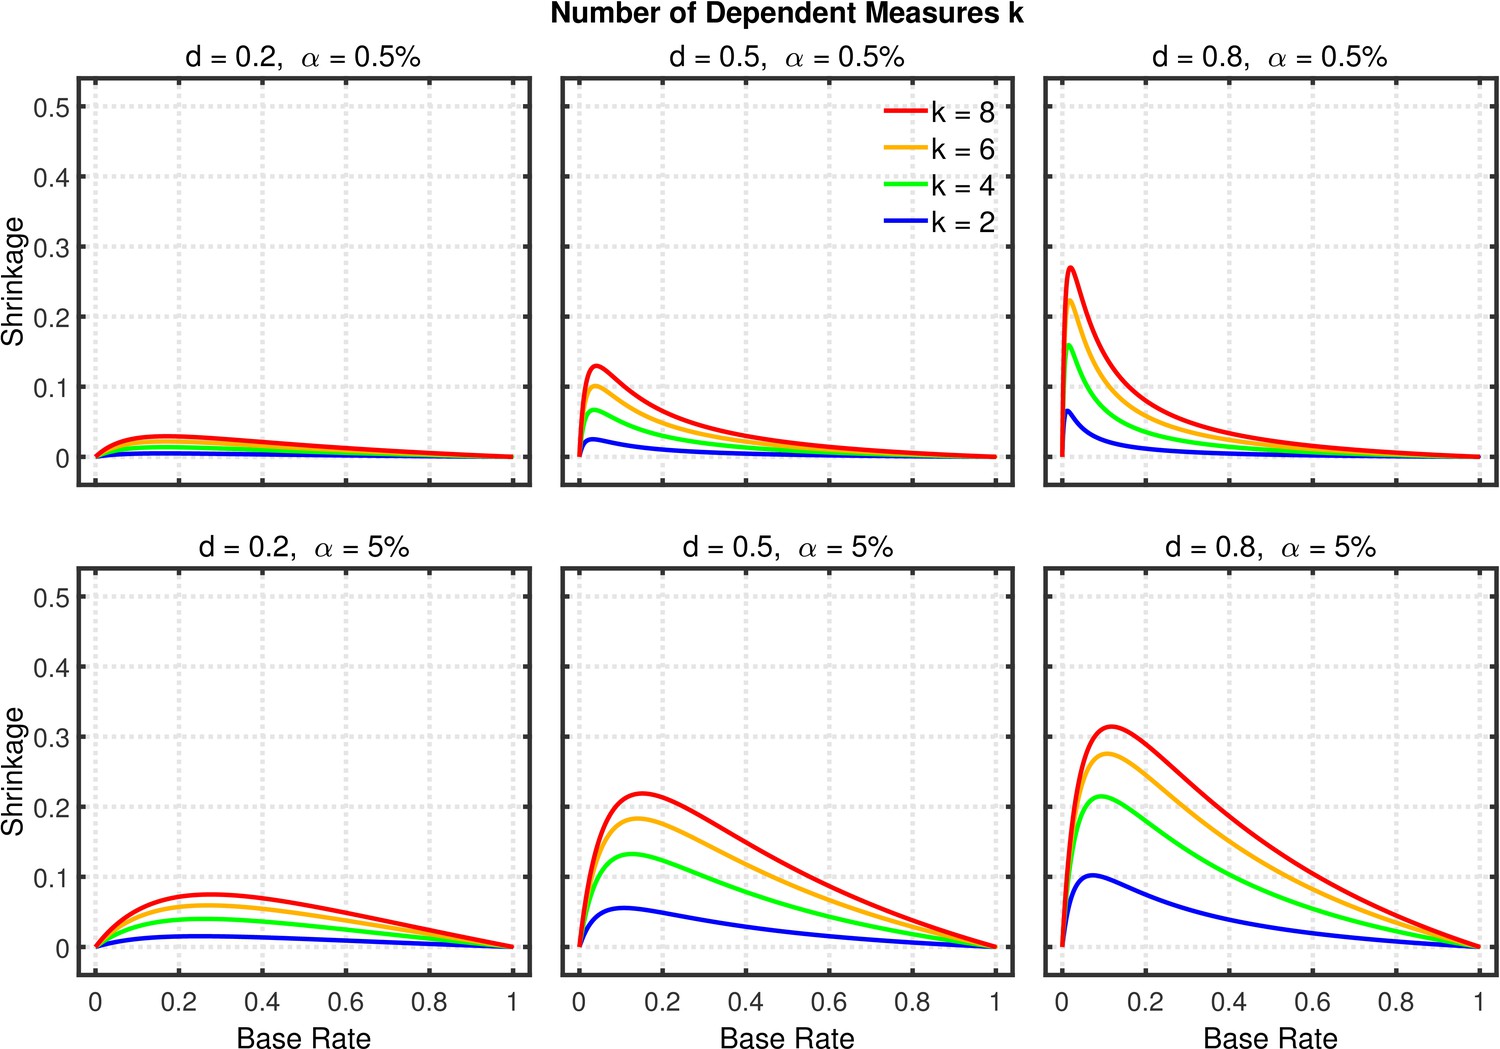
Failing to report all dependent measures.
Shrinkage of the replication rate (i.e., the difference between the solid and dashed lines in Figure 8) as a function of base rate , number of dependent measures , effect size , and nominal level (0.5% or 5%).
Figure 8—figure supplement 2

Failing to report all dependent measures.
Replication rate (RR) as a function of base rate , number of dependent measures , effect size , and nominal level (0.5% or 5%). The nominal level and power of the replication study are % and %. All results are based on two-sample tests with participants per group and dependent measure intercorrelations of 0.8.
Figure 8—figure supplement 3
Failing to report all dependent measures.
Shrinkage of the replication rate (i.e., the difference between the solid and dashed lines in Figure 8—figure supplement 2) as a function of base rate , number of dependent measures , effect size , and nominal level (0.5% or 5%).
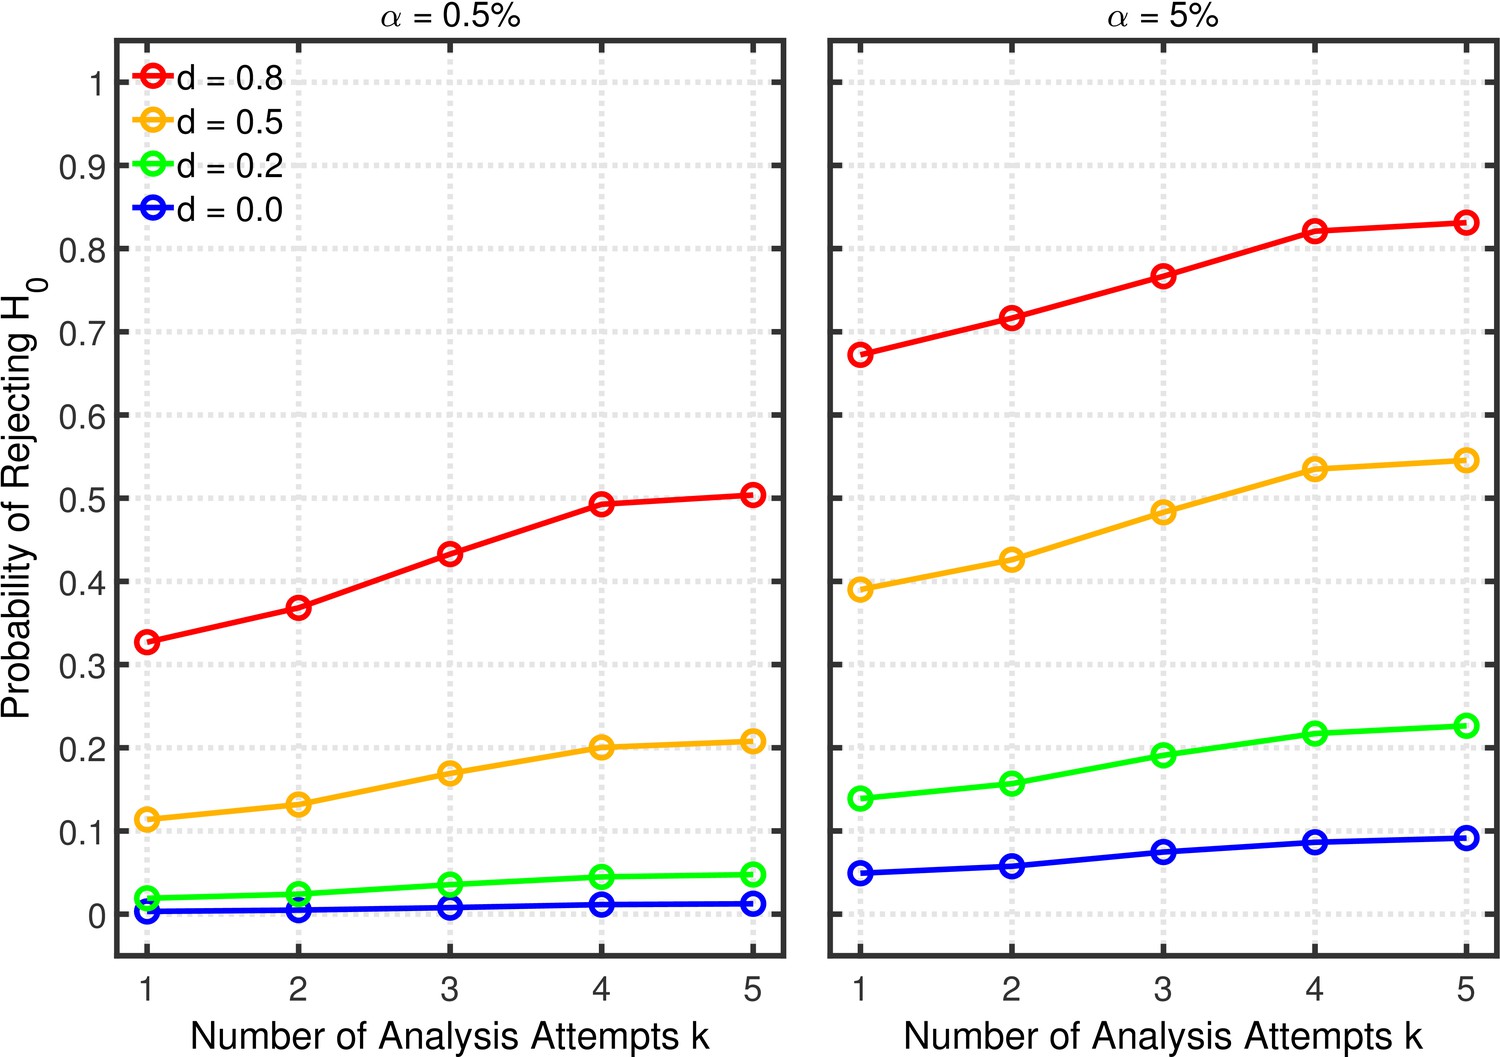
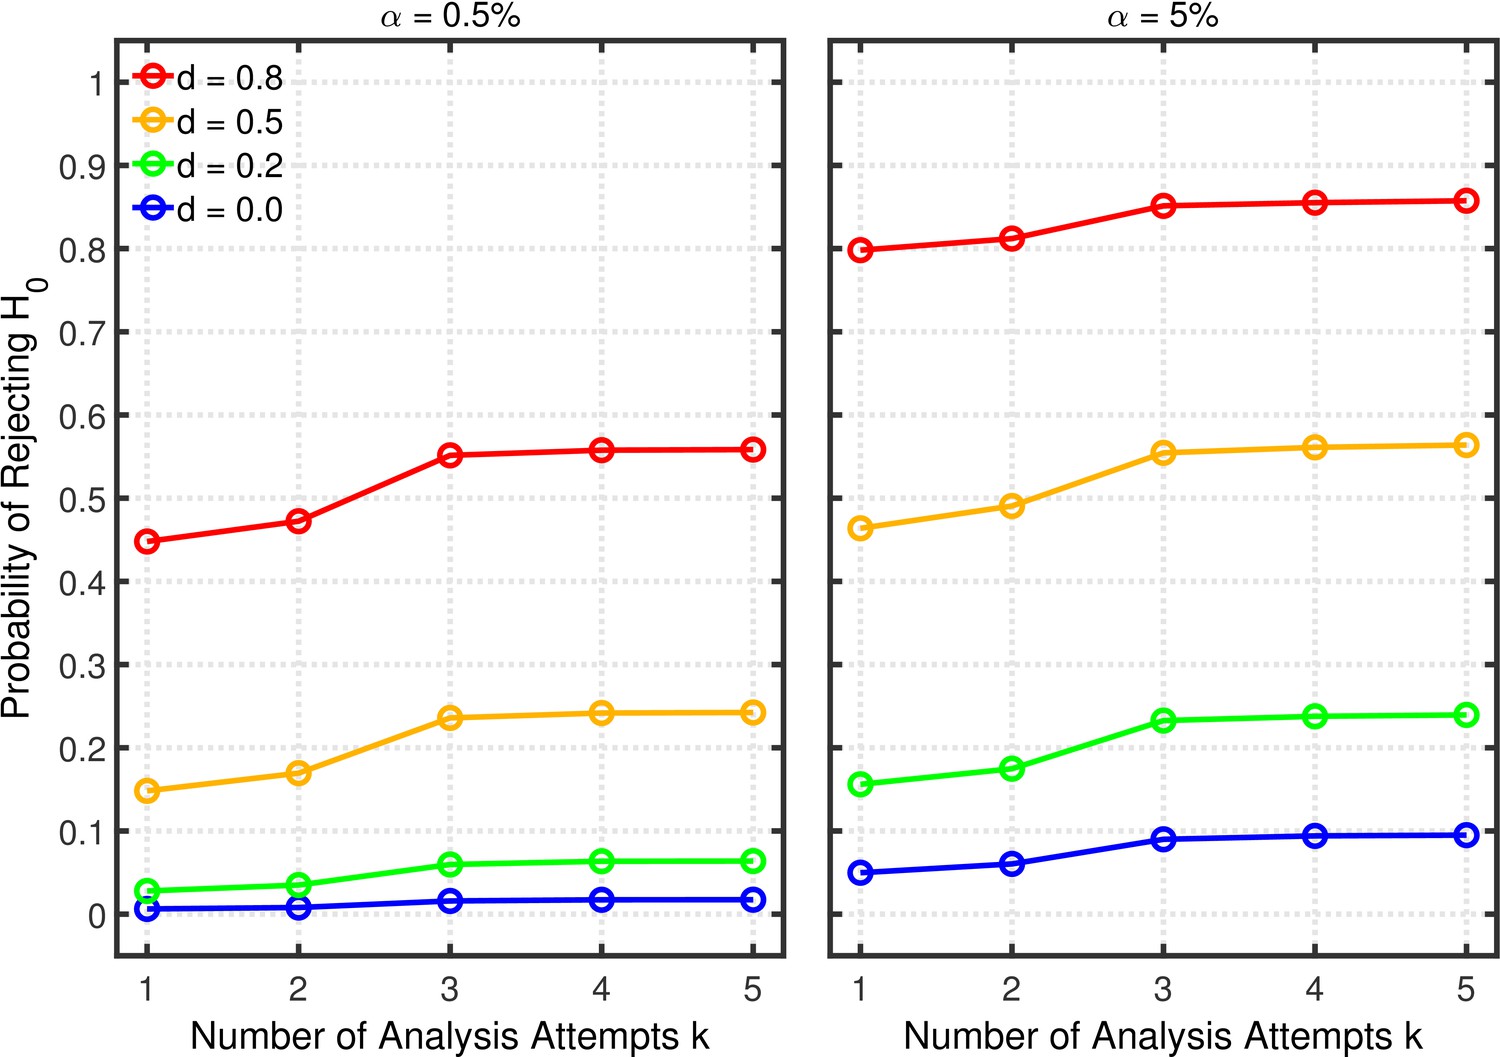
Figure 9 with 1 supplement
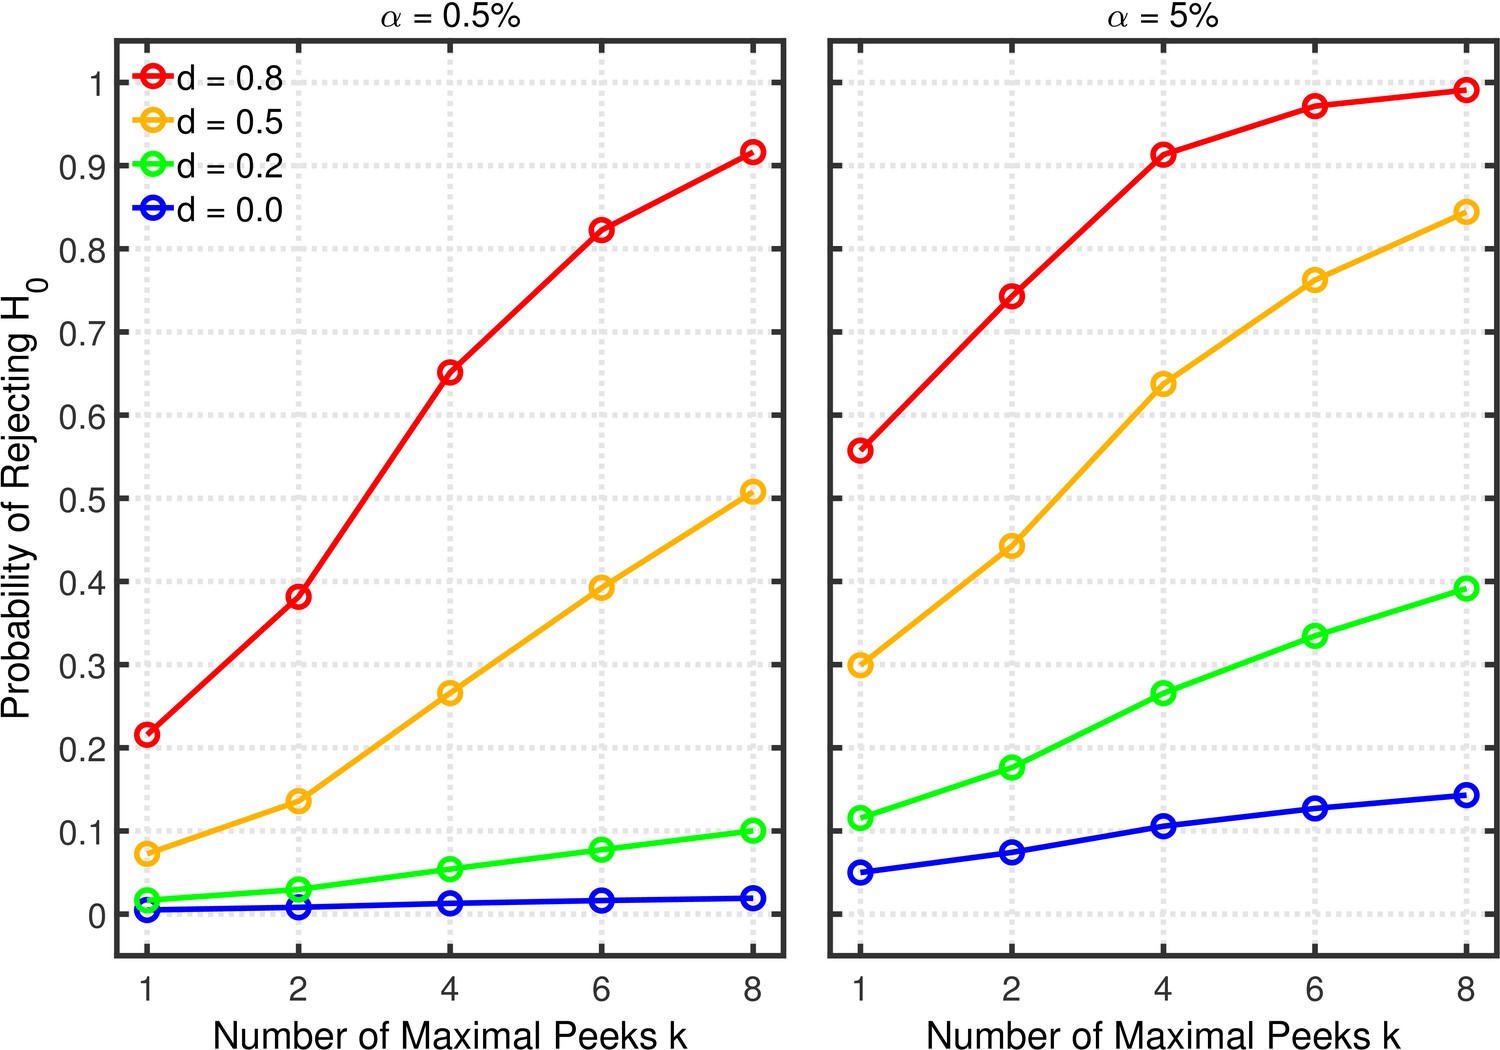
Data peeking.
Each panel depicts the probability of rejecting as a function of the number of maximal peeks , nominal level, and effect size for a two-sample test.
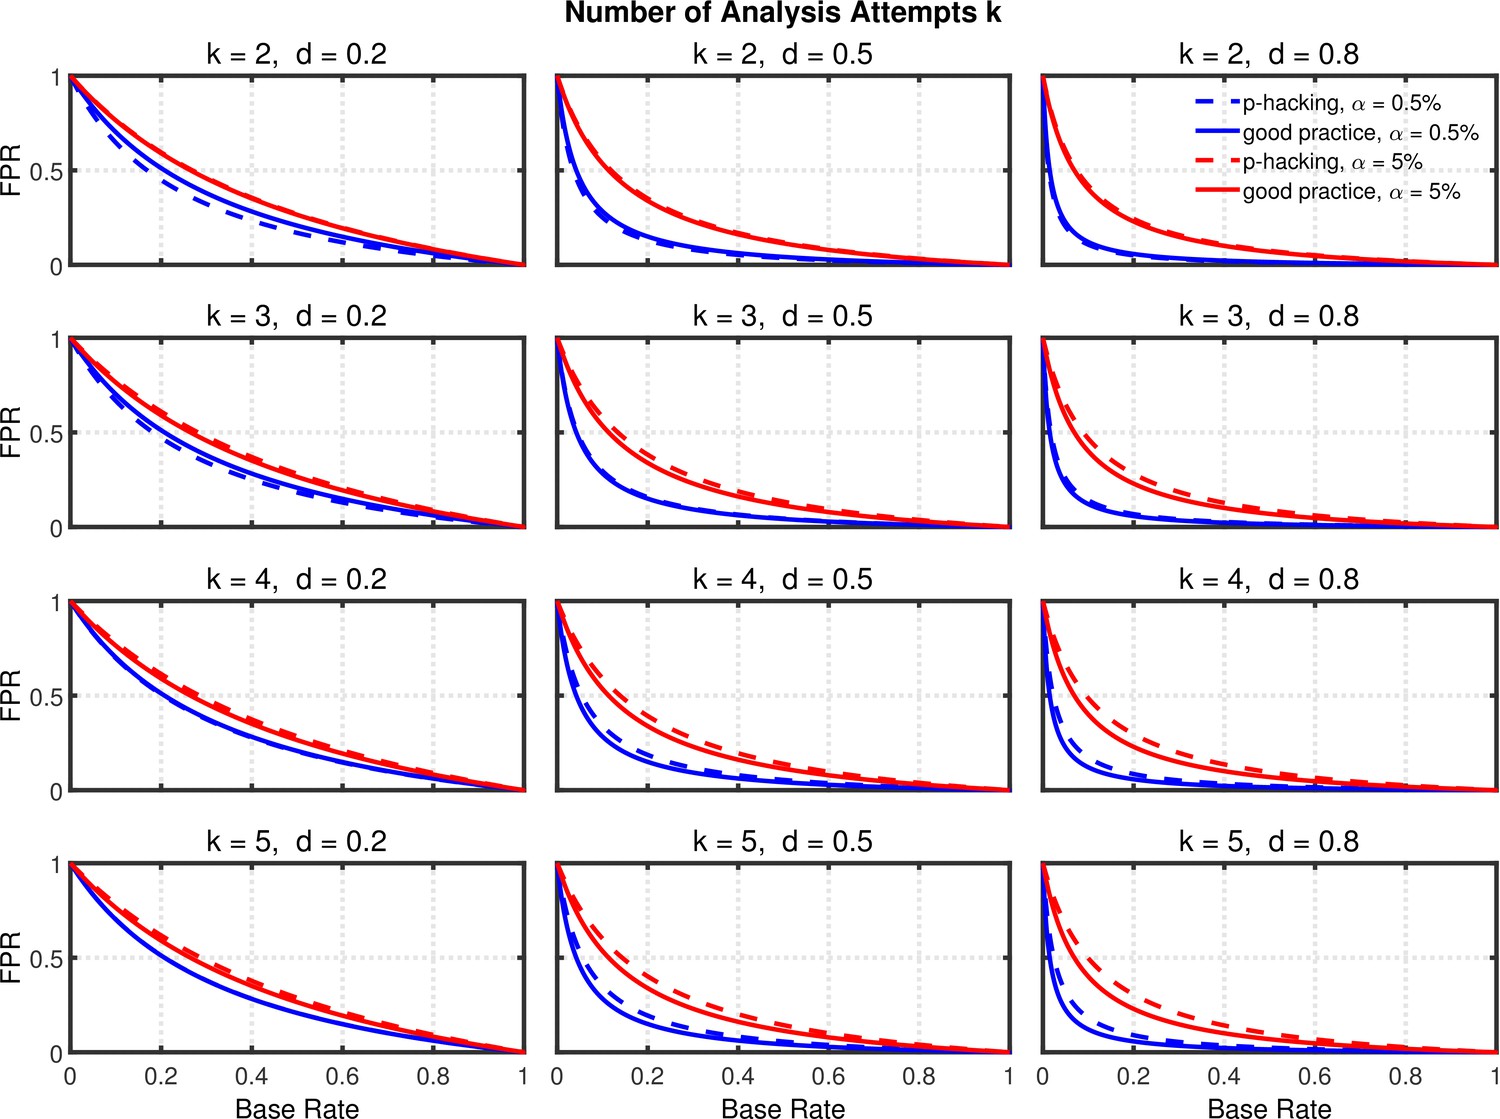
Figure 9—figure supplement 1
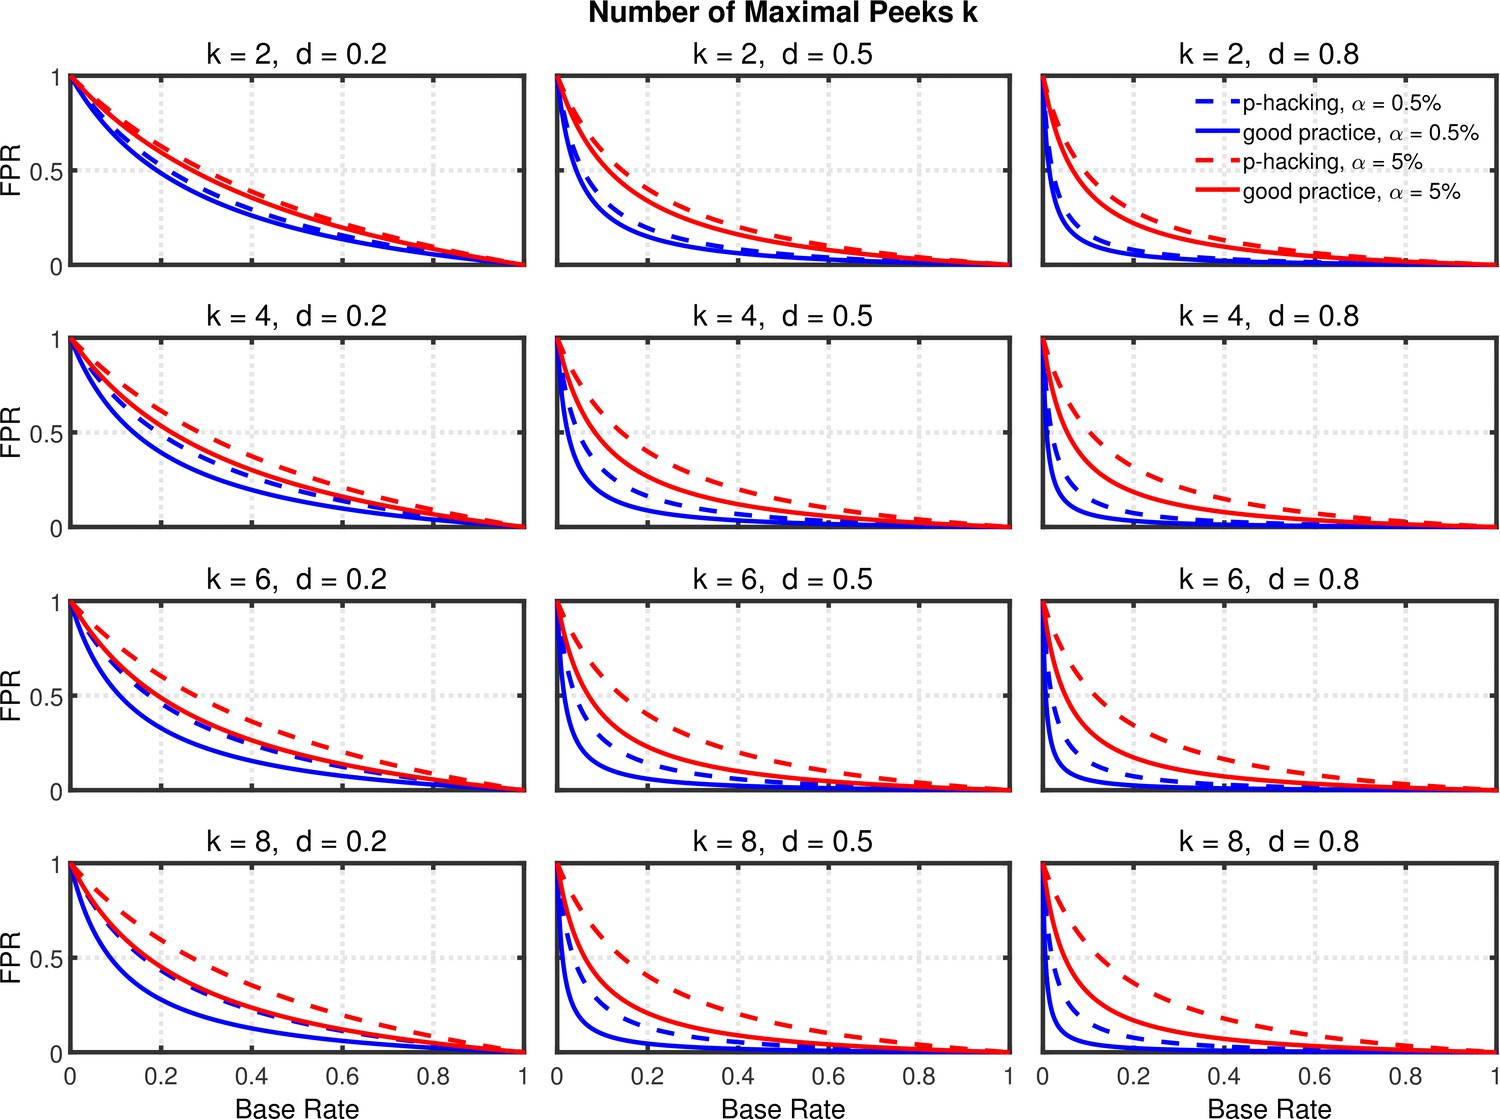
Data peeking.
False positive rate (FPR) as a function of base rate , number of maximal data peeks , and nominal level (0.5% or 5%). The nominal level and power of the replication study are and . Dashed lines give the results for p-hacking whereas solid lines depict the results of researchers who act in accord with good scientific practice. Note that the solid lines are the same in all rows of a single column because these constant reference lines do not depend on k.
Figure 10 with 1 supplement
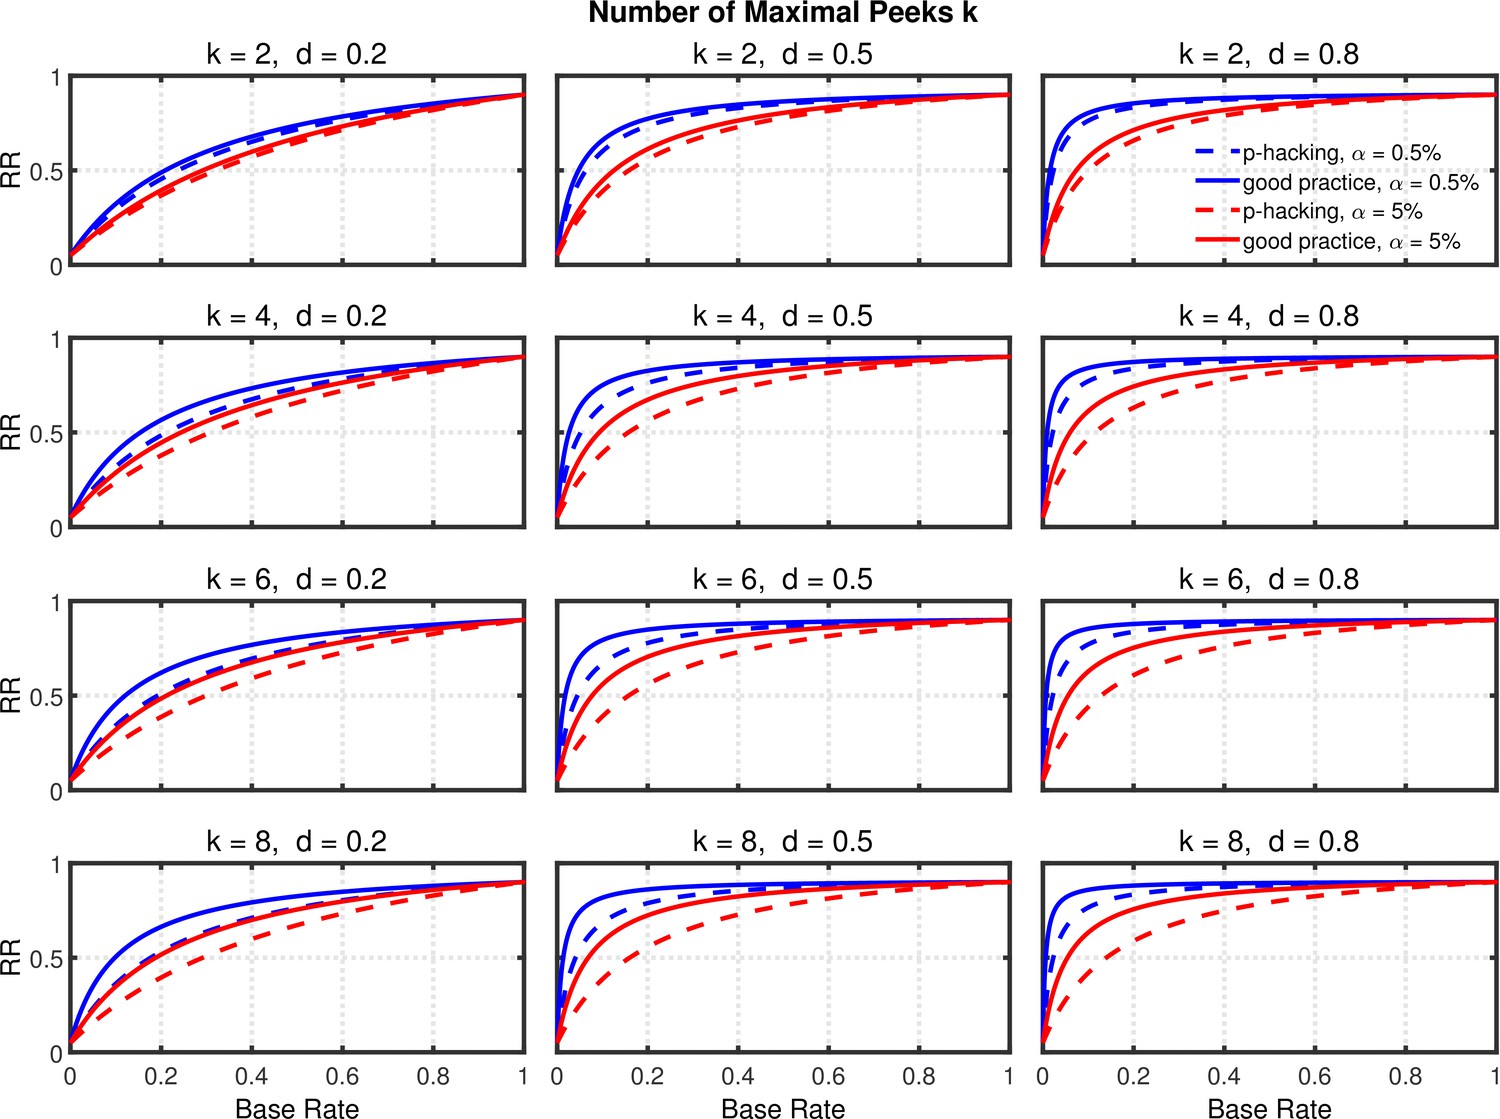
Data peeking.
Replication Rate (RR) as a function of base rate , number of maximal data peeks , and nominal level (0.5% or 5%). The nominal level and power of the replication study are and . Dashed lines give the results for p-hacking whereas solid lines depict the results of researchers who act in accord with good scientific practice. Note that the solid lines are the same in all rows of a single column because these constant reference lines do not depend on .
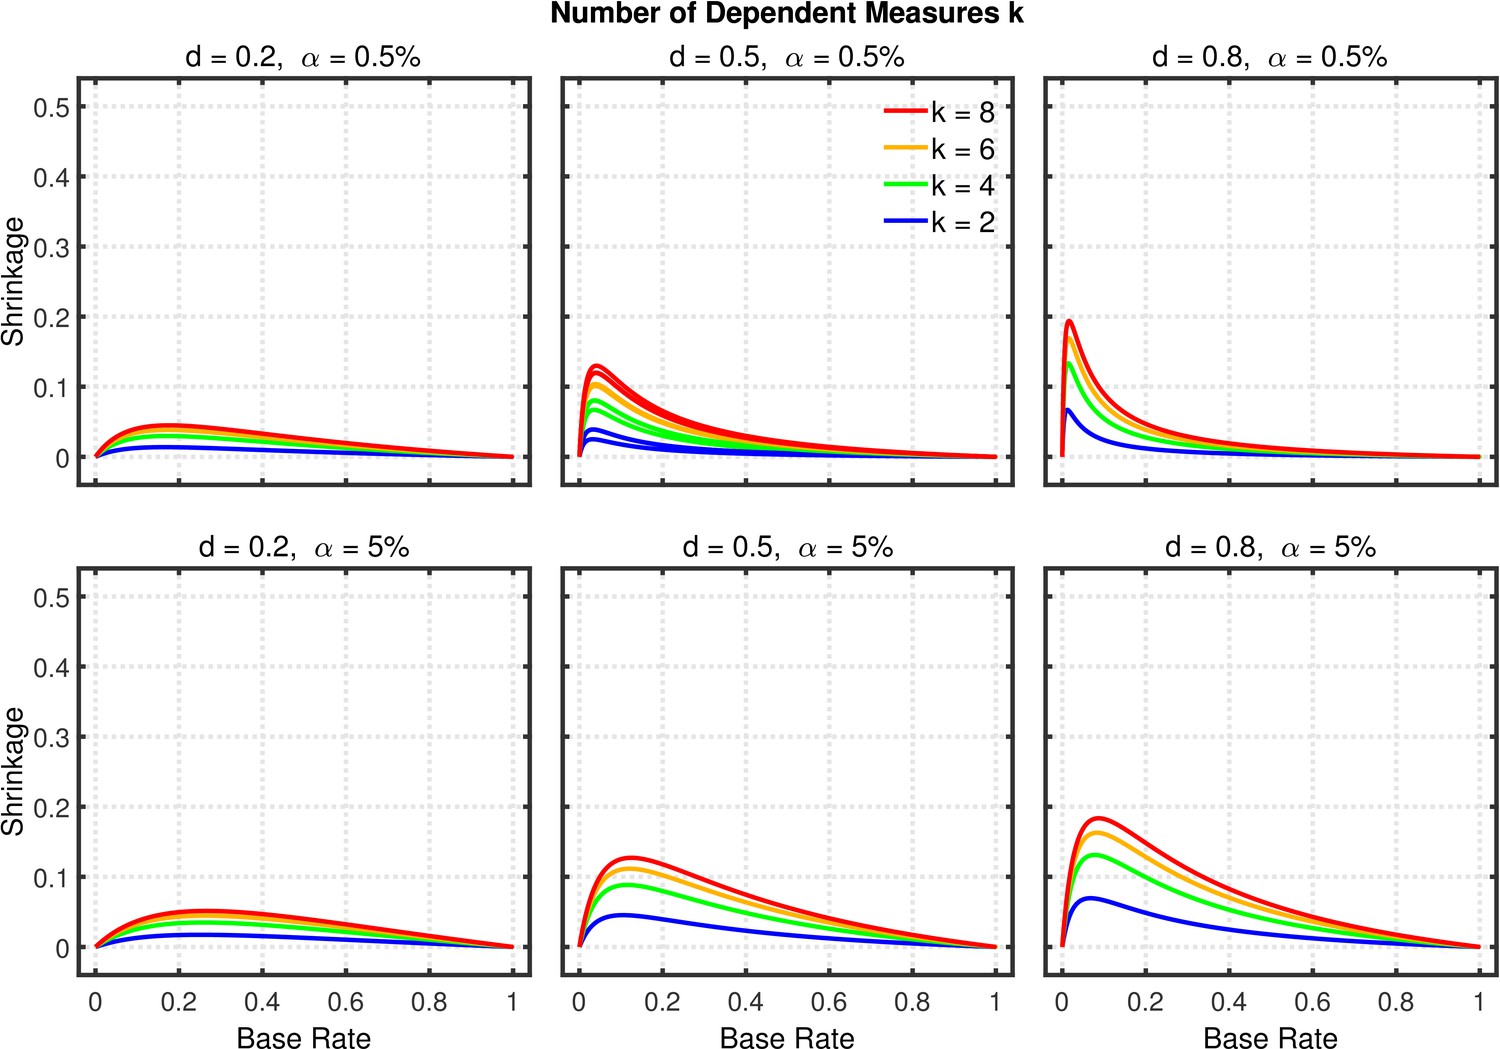
Figure 10—figure supplement 1
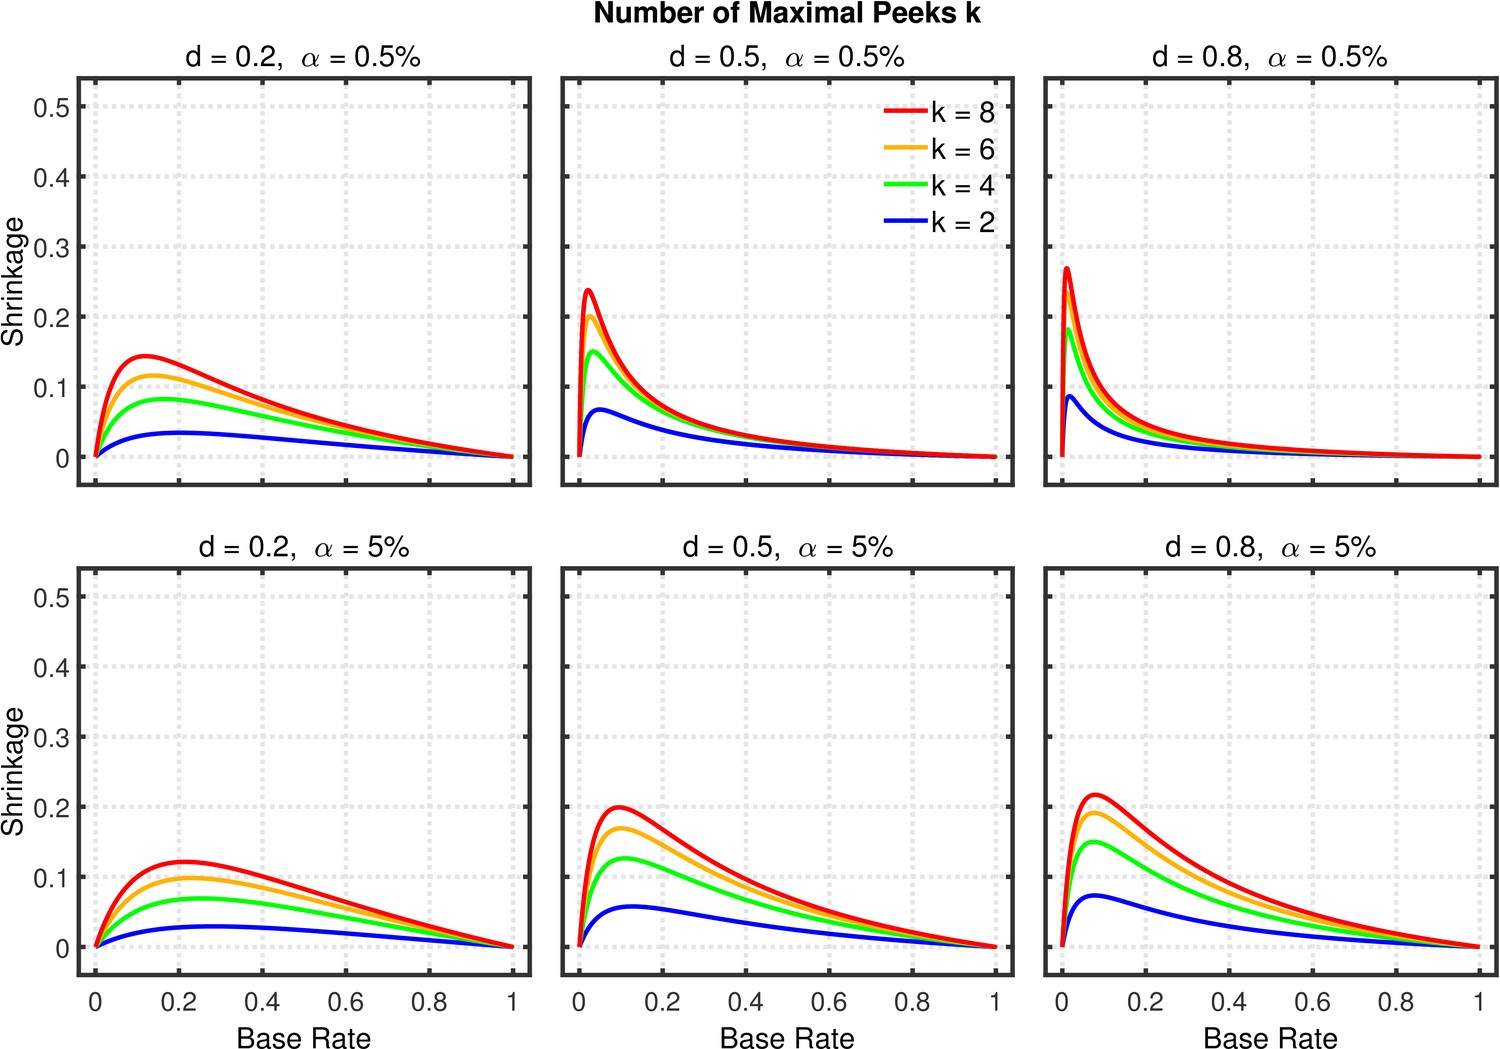
Data peeking.
Shrinkage of the replication rate (i.e., the difference between the solid and dashed lines in Figure 10) as a function of base rate , number of maximal peeks , effect size , and nominal level (0.5% or 5%).
Figure 11 with 1 supplement
Selective outlier removal.
Estimated probability of rejecting as a function of the number of outlier rejection methods attempted for various effect sizes , and nominal level (0.5% or 5%). Probability estimates were based on 10,000 simulated experiments. Simulated data included 5% outliers.
Figure 11—figure supplement 1
Selective outlier removal.
Estimated probability of rejecting as a function of the number of outlier rejection methods attempted for various effect sizes , and nominal level (0.5% or 5%). Probability estimates were based on 10,000 simulated experiments. Simulated data included no outliers.
Figure 12 with 1 supplement
Selective outlier removal.
False positive rate (FPR) as a function of the number of outlier rejection methods attempted, effect size , and nominal level (0.5% or 5%). The nominal level and power of the replication study is and . Dashed lines gives the results for p-hacking whereas solid lines depict the results for researchers who act according to good scientific practice. Simulated data included 5% outliers.
Figure 12—figure supplement 1
Selective outlier removal.
False positive rate (FPR) as a function of the number of outlier rejection methods attempted, effect size , and nominal level (0.5% or 5%). The nominal level and power of the replication study is and . Dashed lines give the results for p-hacking whereas solid lines depict the results for researchers who act according to good scientific practice. Simulated data included no outliers.
Figure 13 with 3 supplements

Selective outlier removal.
Replication rate (RR) as a function of the number of outlier rejection methods attempted, effect size , and nominal level (0.5% or 5%). The nominal level and power of the replication study is and . Dashed lines gives the results for p-hacking whereas solid lines depict the results for researchers who act according to good scientific practice. Simulated data included 5% outliers.
Figure 13—figure supplement 1
Selective outlier removal.
Shrinkage of the replication rate (i.e., the difference between the solid and dashed lines in Figure 13) as a function of base rate , number of outlier rejection methods attempted, effect size , and nominal level (0.5% or 5%).
Figure 13—figure supplement 2
Selective outlier removal.
Replication rate (RR) as a function of the number of outlier rejection methods attempted, effect size , and nominal level (0.5% or 5%). The nominal level and power of the replication study are and . Dashed lines give the results for p-hacking whereas solid lines depict the results for researchers who act according to good scientific practice. Simulated data included no outliers.
Figure 13—figure supplement 3
Selective outlier removal.
Shrinkage of the replication rate (i.e., the difference between the solid and dashed lines in Figure 13—figure supplement 2) as a function of base rate , number of outlier rejection methods attempted, effect size , and nominal level (0.5% or 5%). Simulated data included no outliers.
Appendix 2—figure 1
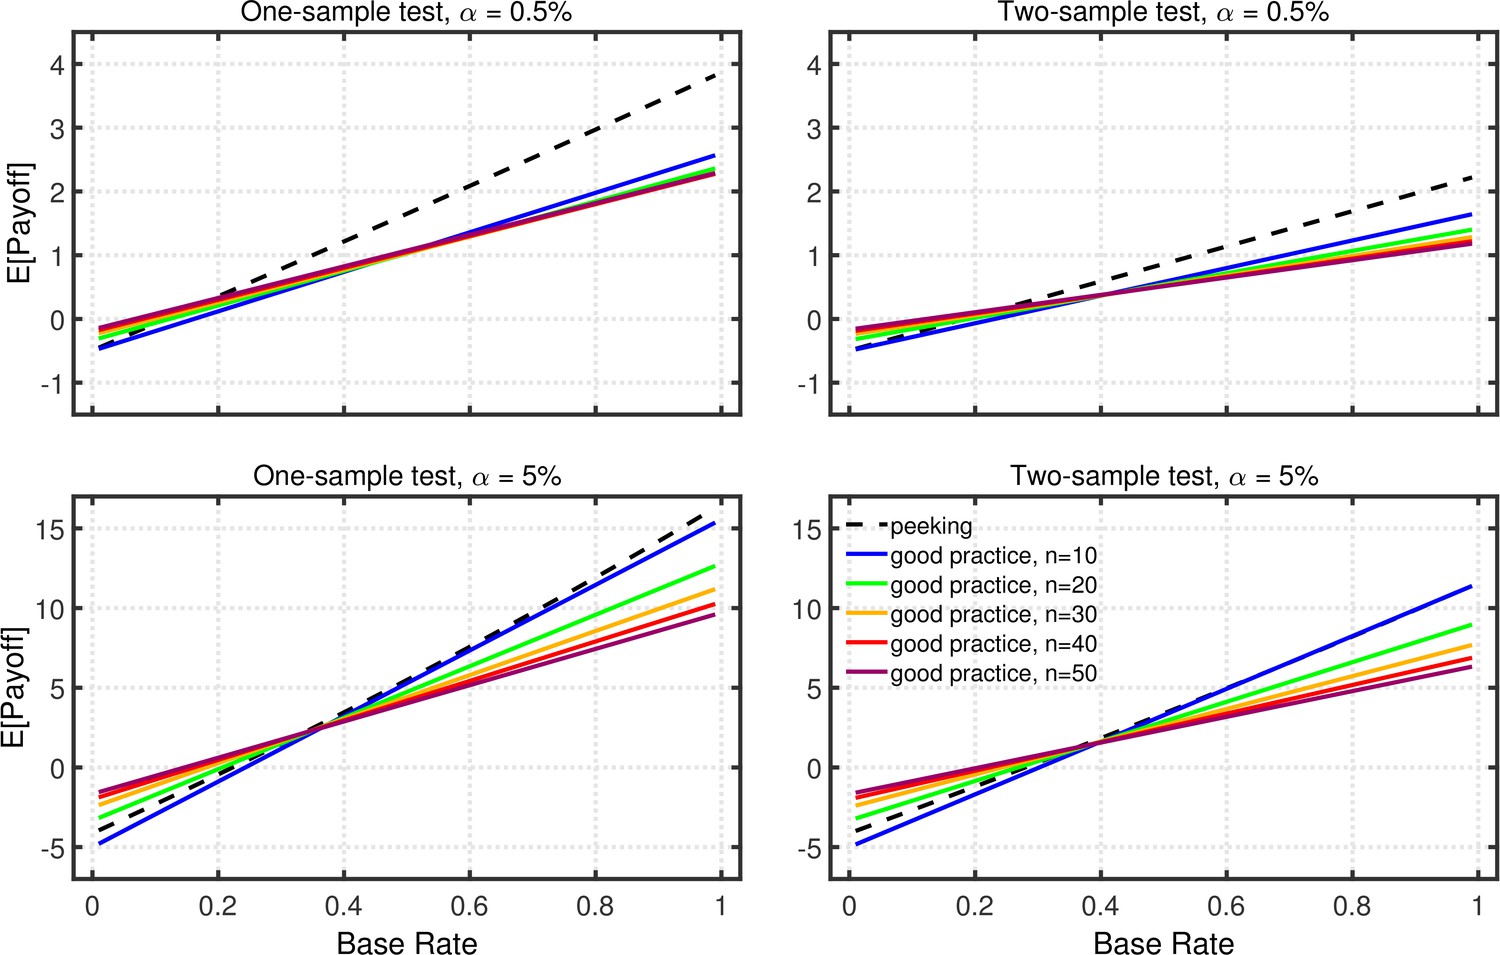
Expected payoff as a function of base rate and sample size.
The dashed lines give the expected payoffs for researchers using data peeking at sample sizes of 10, 15, 20, 25, and 30. The solid lines give the expected payoffs for researchers who act in accord with good scientific practice and only check the data once, at the indicated sample size. The panels on the left side reflect the results for one-sample tests, whereas those on the right for two-sample tests. The upper and lower panels give the results for a nominal one-tailed levels of 0.5 and 5%, respectively, with different vertical scales used because of the different ranges of payoffs for the two levels. All results are based on an effect size of , individual outcome payoffs of , , , and , and a total sample size of . The results are similar for two-tailed testing (not shown).
Appendix 2—figure 2
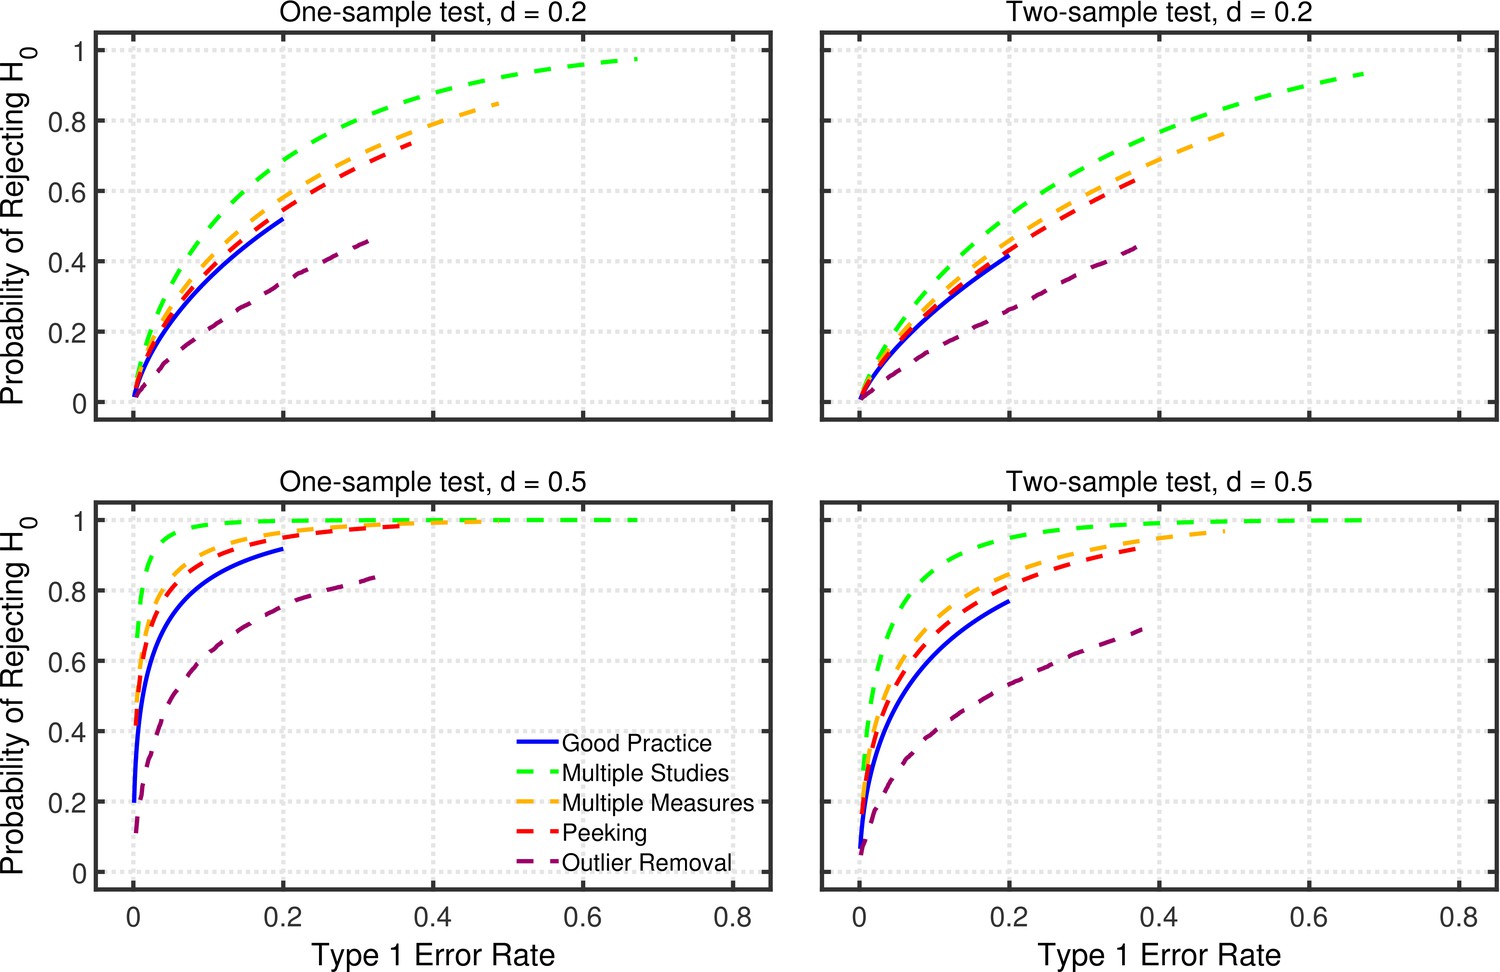
Power as a function of Type 1 error rate.
Power for one-tailed testing as a function of Type 1 error rate for researchers using good practice or one of the four p-hacking procedures considered in the main article: multiple studies (), multiple DVs ( with intercorrelations of 0.2), data peeking after , 15, 20, 25, and 30, or multiple analyses (). Computations were based on a sample size of (per group) for all procedures other than data-peeking.
Author response image 1
Author response image 2
Author response image 3
Additional files
-
Source code 1
Data peeking.
- https://cdn.elifesciences.org/articles/58237/elife-58237-code1-v2.m.zip
-
Source code 2
Demo.
- https://cdn.elifesciences.org/articles/58237/elife-58237-code2-v2.m.zip
-
Source code 3
Failing to report.
- https://cdn.elifesciences.org/articles/58237/elife-58237-code3-v2.m.zip
-
Source code 4
Outlier rejection.
- https://cdn.elifesciences.org/articles/58237/elife-58237-code4-v2.m.zip
-
Source code 5
Selective reporting of significant studies.
- https://cdn.elifesciences.org/articles/58237/elife-58237-code5-v2.m.zip
-
Transparent reporting form
- https://cdn.elifesciences.org/articles/58237/elife-58237-transrepform-v2.docx
Download links
A two-part list of links to download the article, or parts of the article, in various formats.
Downloads (link to download the article as PDF)
Open citations (links to open the citations from this article in various online reference manager services)
Cite this article (links to download the citations from this article in formats compatible with various reference manager tools)
Meta-Research: Questionable research practices may have little effect on replicability
eLife 9:e58237.
https://doi.org/10.7554/eLife.58237


