Meta-Research: Weak evidence of country- and institution-related status bias in the peer review of abstracts
- Department of Sociology, University of Copenhagen, Denmark
- Danish Centre for Studies in Research and Research Policy, Department of Political Science, Aarhus University, Denmark
- Department of Political Science, Aarhus University, Denmark
Figures
Figure 1 with 5 supplements
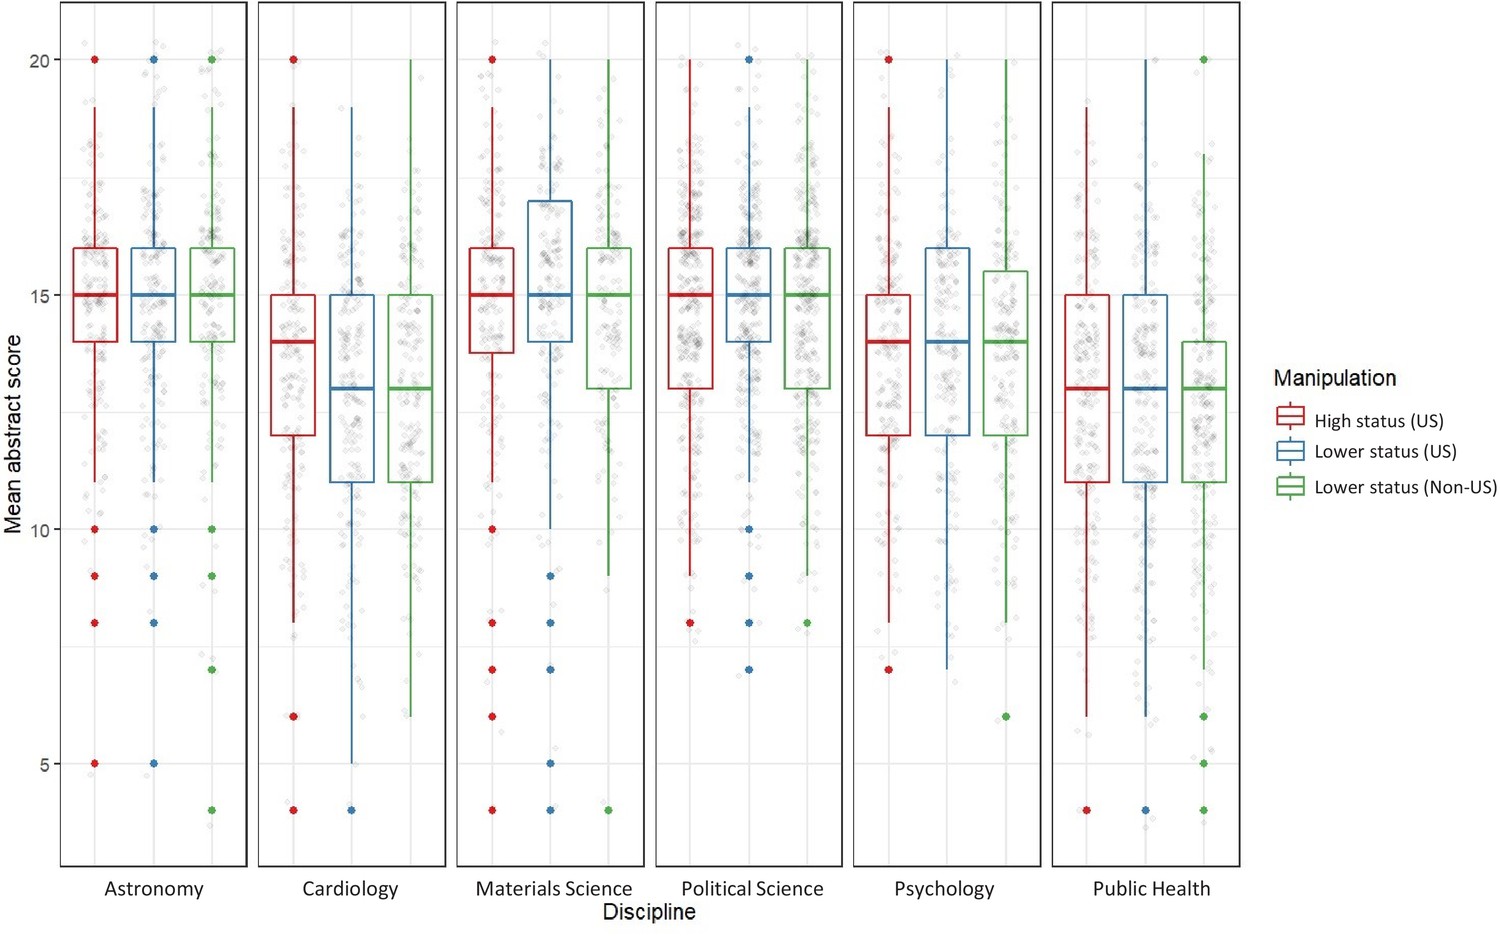
Boxplots displaying the distributions of abstract scores across the three manipulations and six disciplines.
Each panel reports results for a specific discipline. The red box plots specify results for respondents exposed to an abstract authored at a high-status institution in the US. The blue box plots specify results for respondents exposed to an abstract authored at a lower-status institution in the US. The green box plots specify results for respondents exposed to an abstract authored at a lower-status institution outside the US. Whiskers show the 1.5 interquartile range. The red, blue and green dots represent outliers, and the grey dots display data points. The boxplots do not indicate any notable variations in abstract scores across manipulations.
Figure 1—figure supplement 1
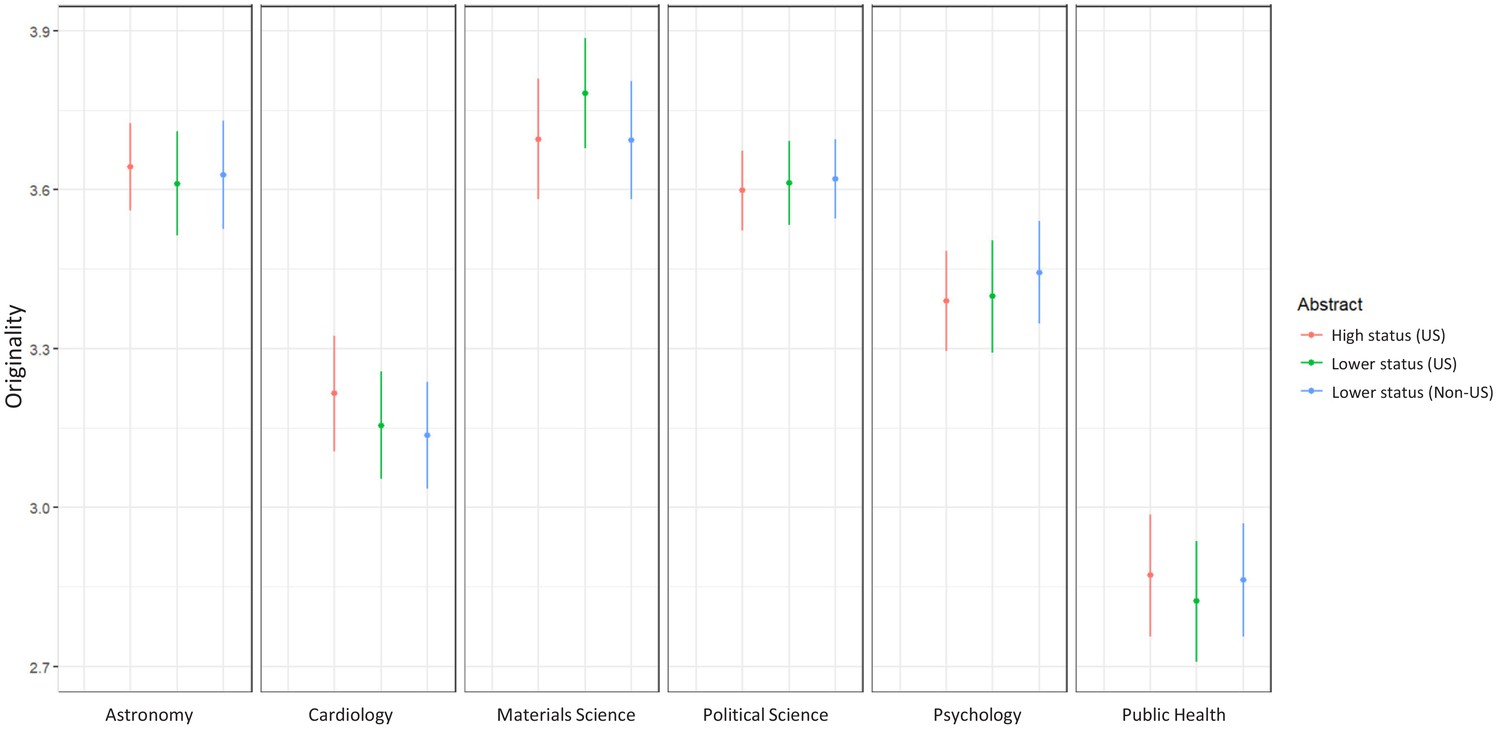
Rating abstracts on “Originality of the presented research”.
Average abstract ratings and 95% CIs across the three manipulations and six disciplines for the question “Please rate the abstract on the following dimension: Originality of the presented research” (Response categories: Very poor = 1, Excellent = 5). Error bars represent 95% confidence intervals based on 1000 bootstrap samples.
Figure 1—figure supplement 2
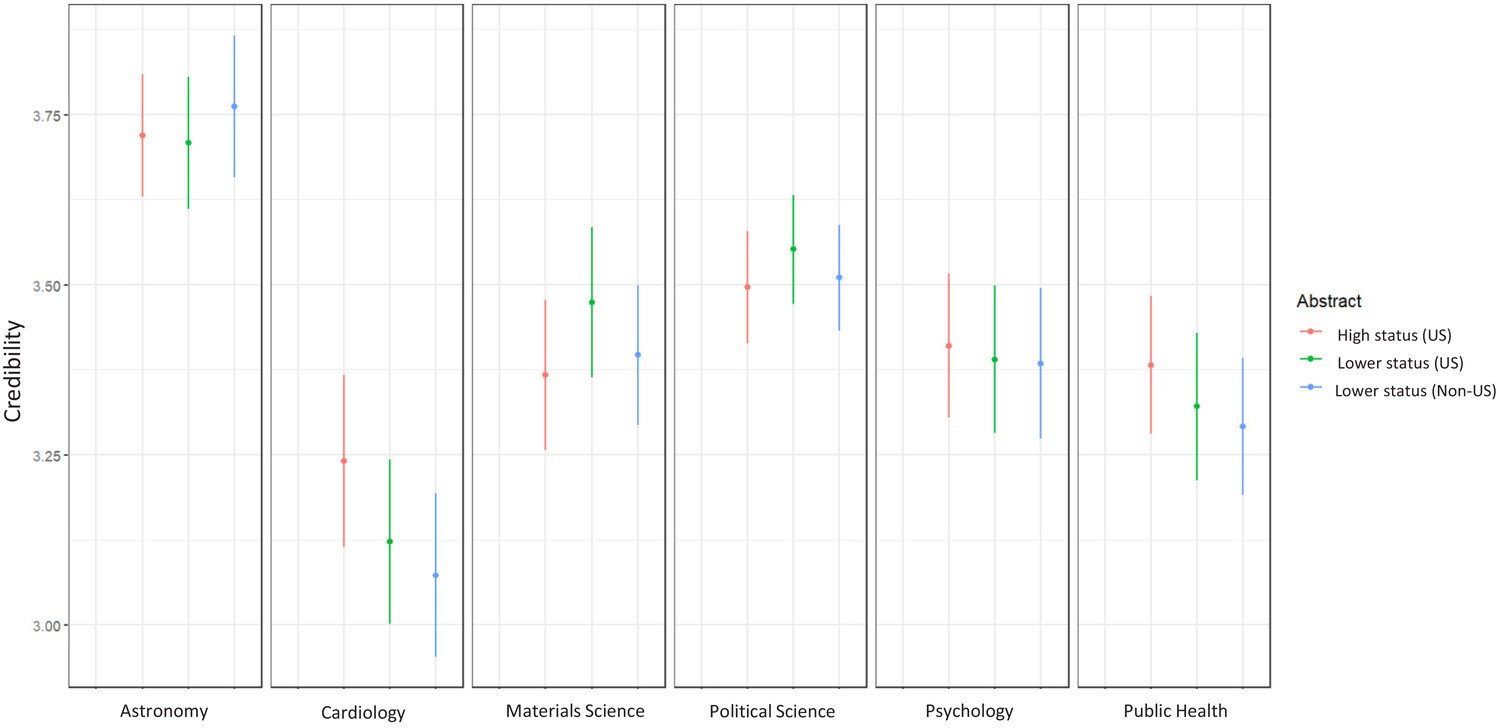
Rating abstracts on “Credibility of the results”.
Average abstract ratings and 95% CIs across the three manipulations and six disciplines for the question “Please rate the abstract on the following dimension: Credibility of the results” (Response categories: Very poor = 1, Excellent = 5). Error bars represent 95% confidence intervals based on 1000 bootstrap samples.
Figure 1—figure supplement 3
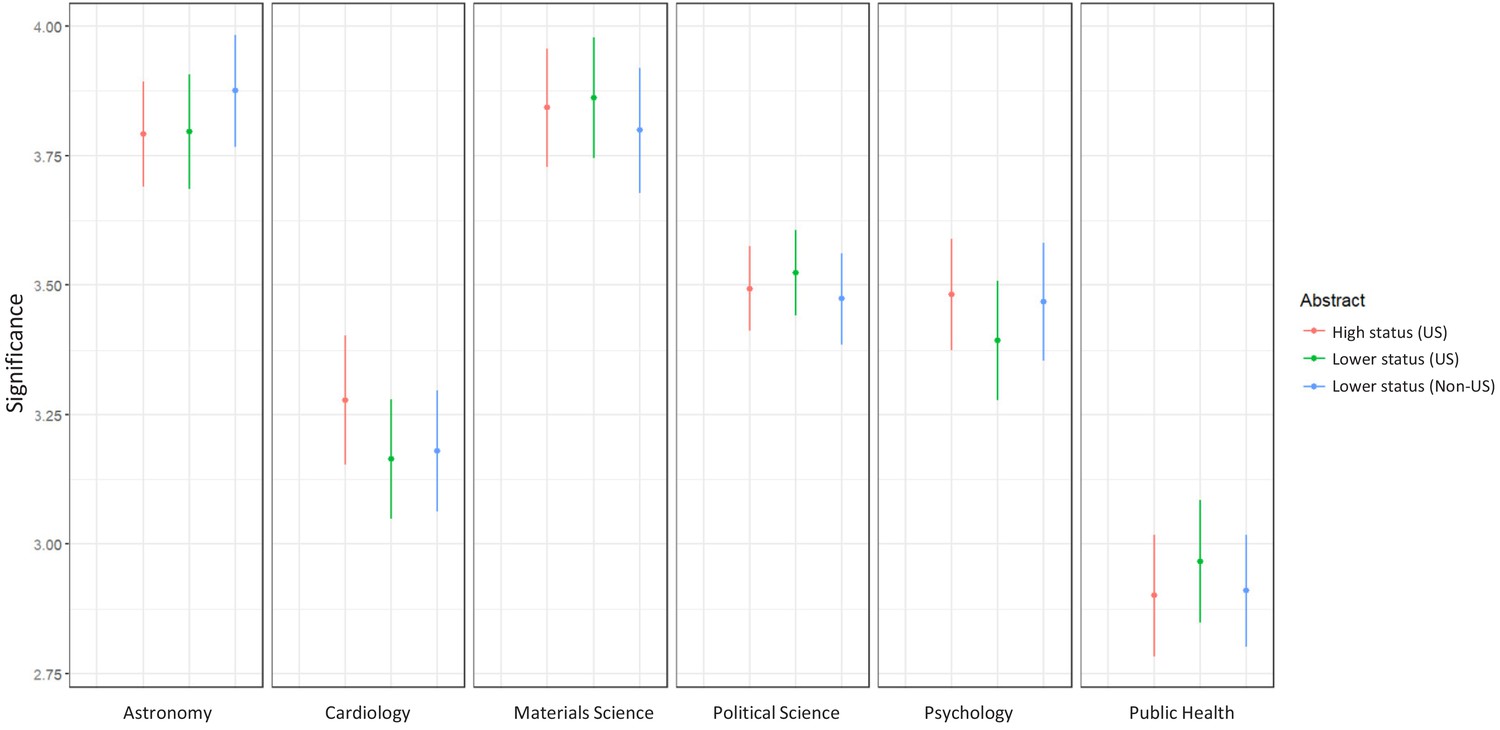
Rating abstracts on “Significance for future research”.
Average abstract ratings and 95% CIs across the three manipulations and six disciplines for the question “Please rate the abstract on the following dimension: Significance for future research” (Response categories: Very poor = 1, Excellent = 5). Error bars represent 95% confidence intervals based on 1000 bootstrap samples.
Figure 1—figure supplement 4
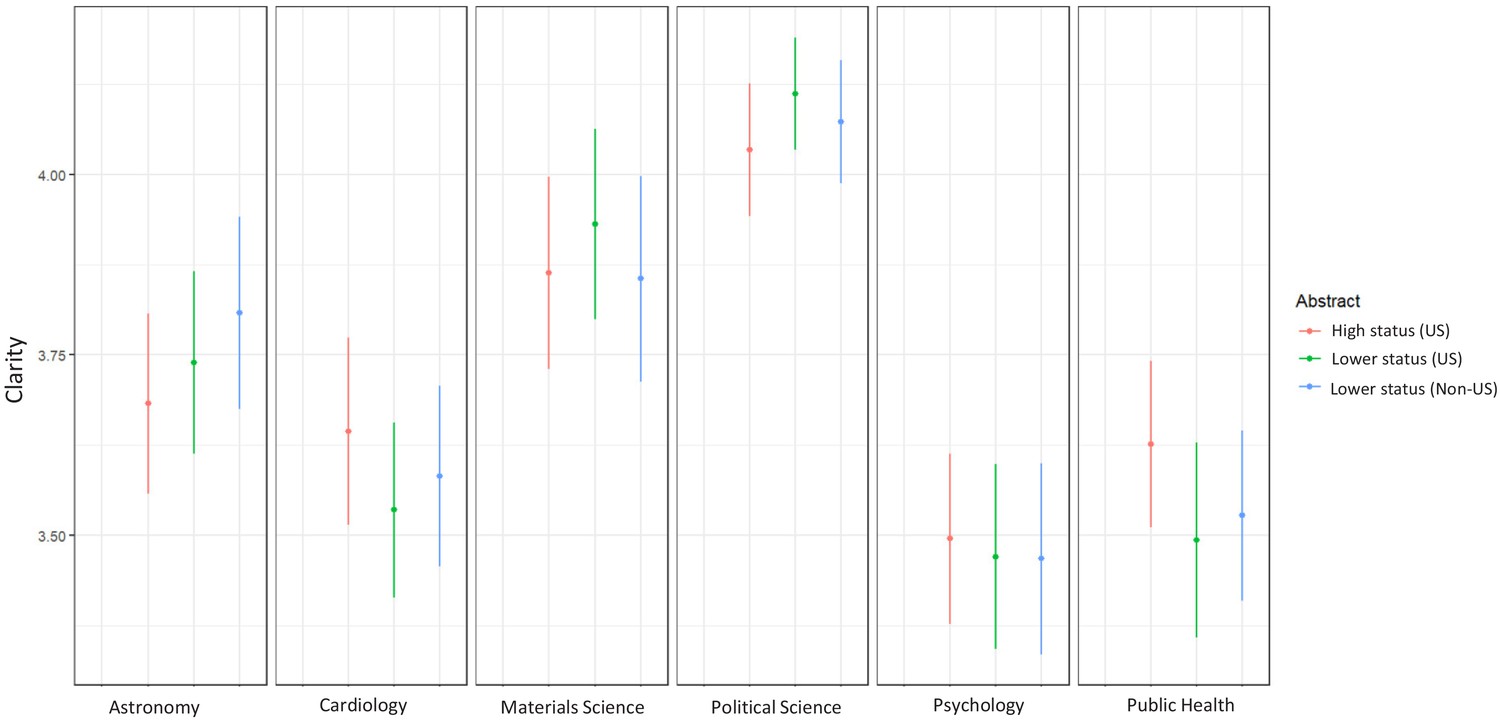
Rating abstracts on “Clarity of the abstract”.
Average abstract ratings and 95% CIs across the three manipulations and six disciplines for the question “Please rate the abstract on the following dimension: Clarity of the abstract” (Response categories: Very poor = 1, Excellent = 5). Error bars represent 95% confidence intervals based on 1000 bootstrap samples.
Figure 1—figure supplement 5
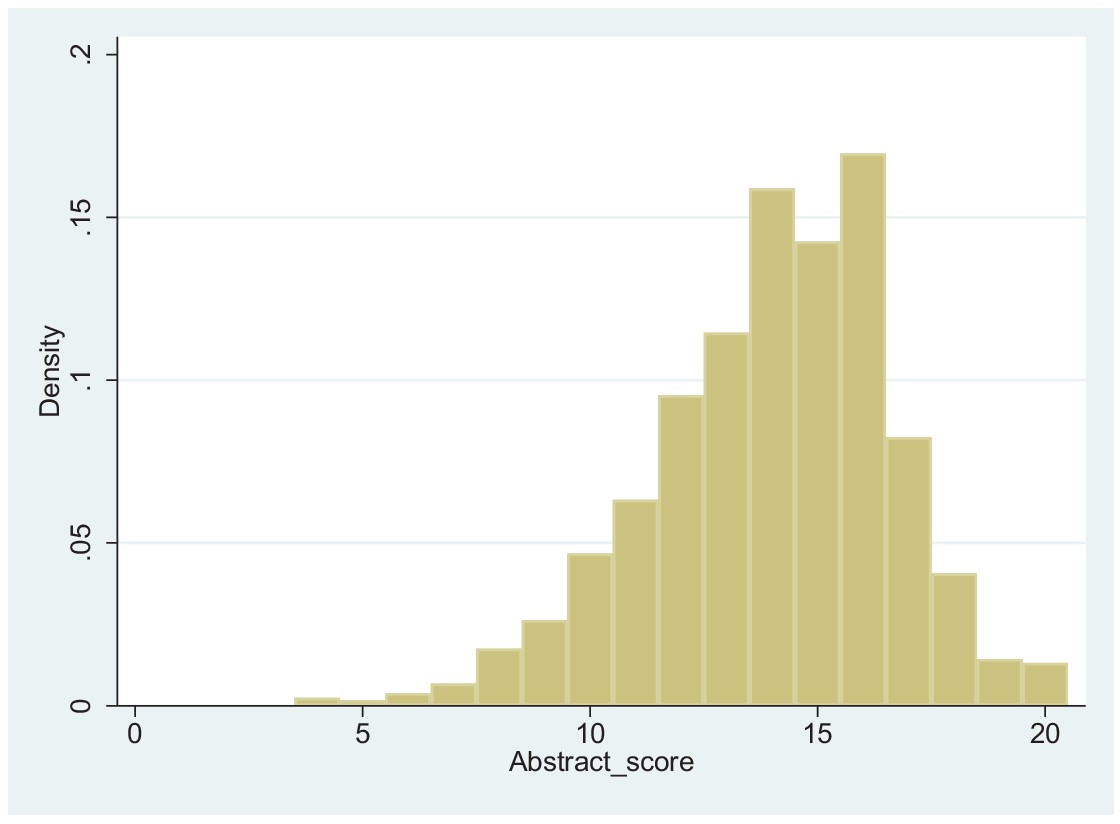
The distribution of abstract scores for the full sample.
Abstracts could receive a score of between 4 (when the originality, credibility, significance and clarity were all deemed to be very poor) and 20 (when these four factors were all deemed to be excellent). This plot shows the distribution of abstract scores for the six abstracts as assessed by the 4147 reviewers.
Figure 2
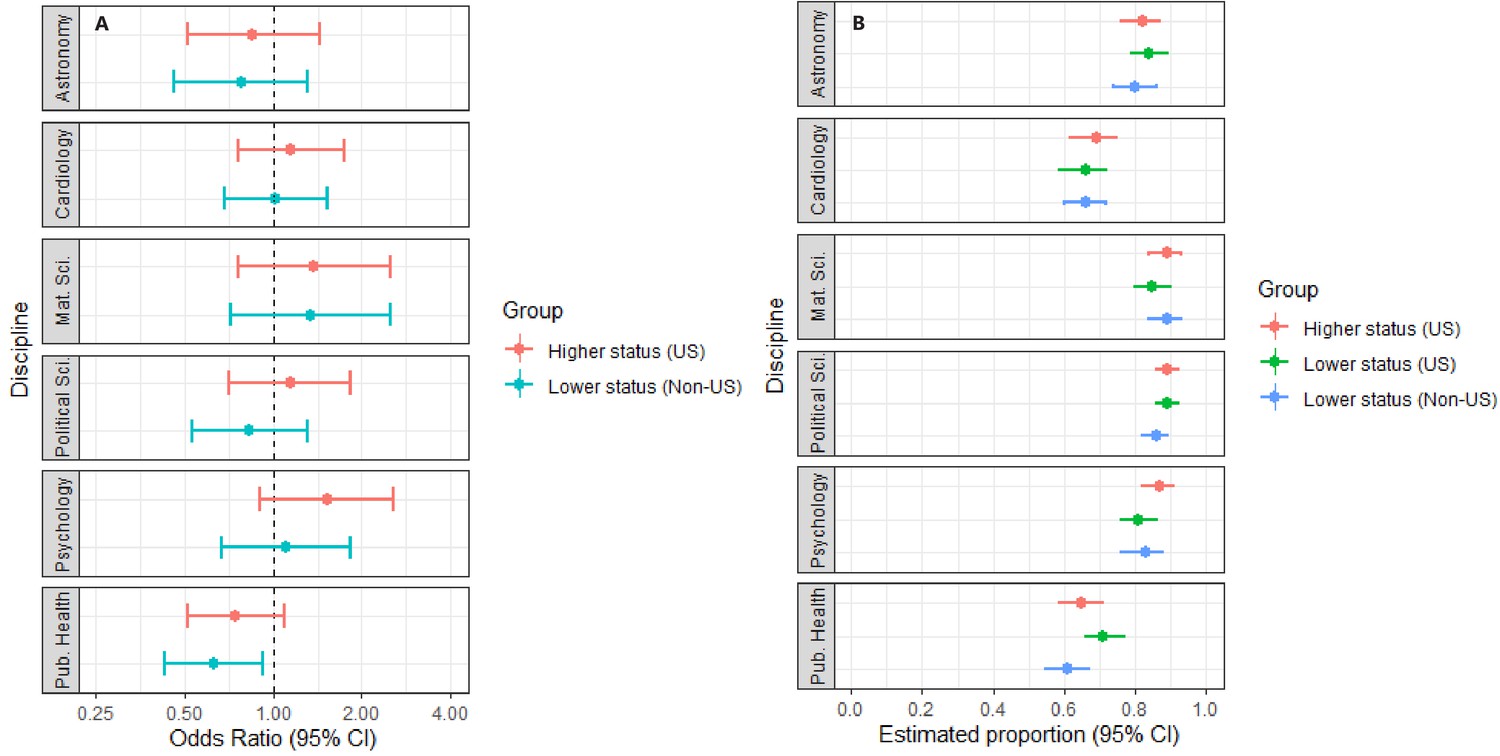
Plots of odds ratios and estimated proportions derived from the discipline-specific logit models with "Open full text" as outcome.
Panel A displays the odds ratios for respondents exposed to manipulation 1 (high-status university, US) or manipulation 3 (lower-status university, non-US). Manipulation 2 (lower-status university, US) is the reference group. Panel B plots the adjusted means for manipulation 1, manipulation 2 and manipulation 3. Error bars represent 95% CIs. As shown in Panel A, peer-evaluators in public health were slightly less likely to show interest in opening the full text when the author affiliation was changed from a lower-status university in the US to a lower-status university elsewhere. The results for the remaining eleven comparisons are inclusive. For model specifications, see Supplementary file 2, Tables S13–S18.
Figure 3
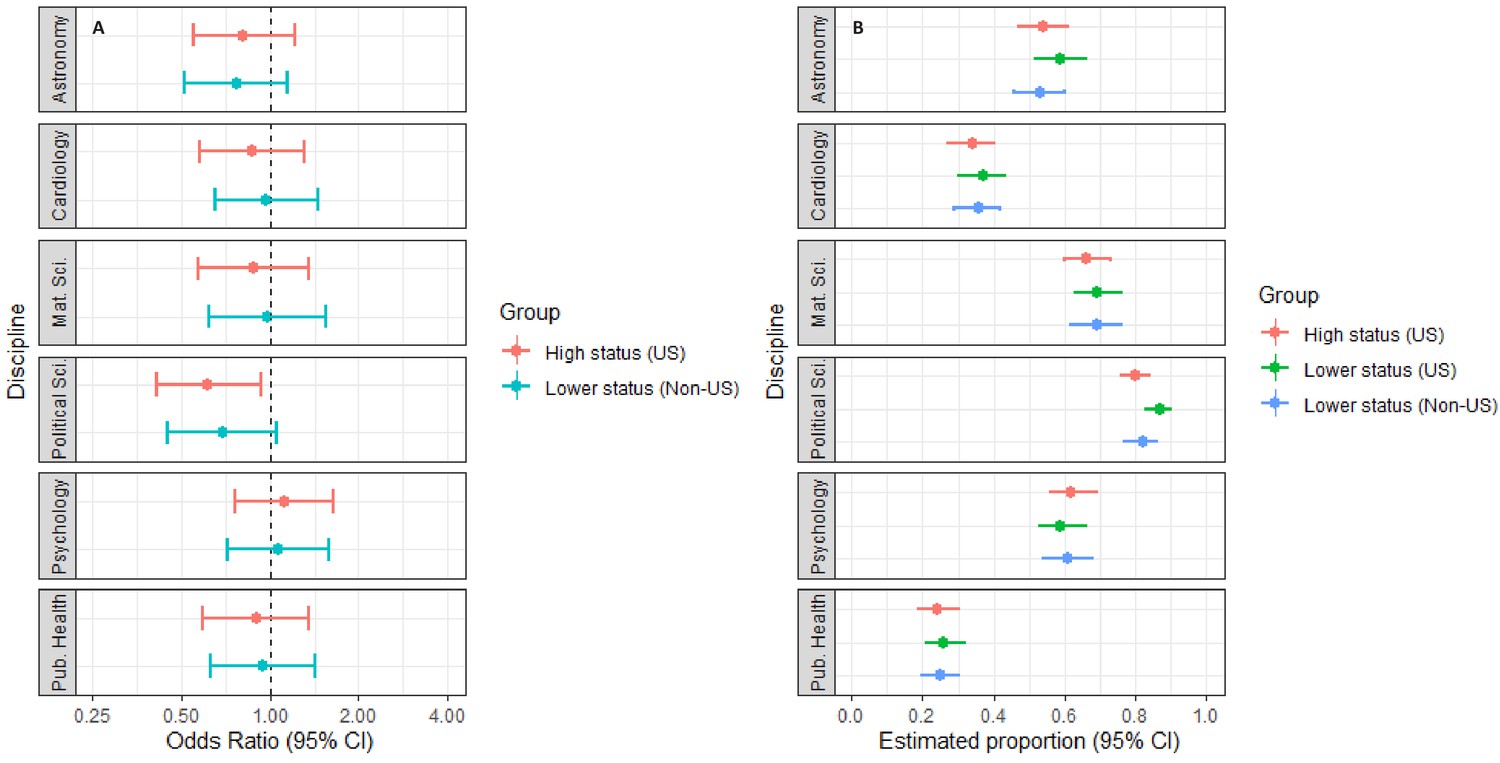
Plots of odds ratios and estimated proportions derived from the discipline-specific logit models with "Include in conference" as outcome.
Panel A displays the odds ratios for respondents exposed to manipulation 1 (high-status university, US) or manipulation 3 (lower-status university, non-US). Manipulation 2 (lower-status university, US) is the reference group. Panel B plots the adjusted means for manipulation 1, manipulation 2 and manipulation 3. Error bars represent 95% CIs. As shown in Panel A, peer-evaluators in political science were slightly less likely to show interest in opening the full text when the author affiliation was changed from a lower-status university in the US to a high-status university in the US. The results for the remaining eleven comparisons are inclusive. For model specifications, see Supplementary file 2, Tables S19–S24.
Figure 4
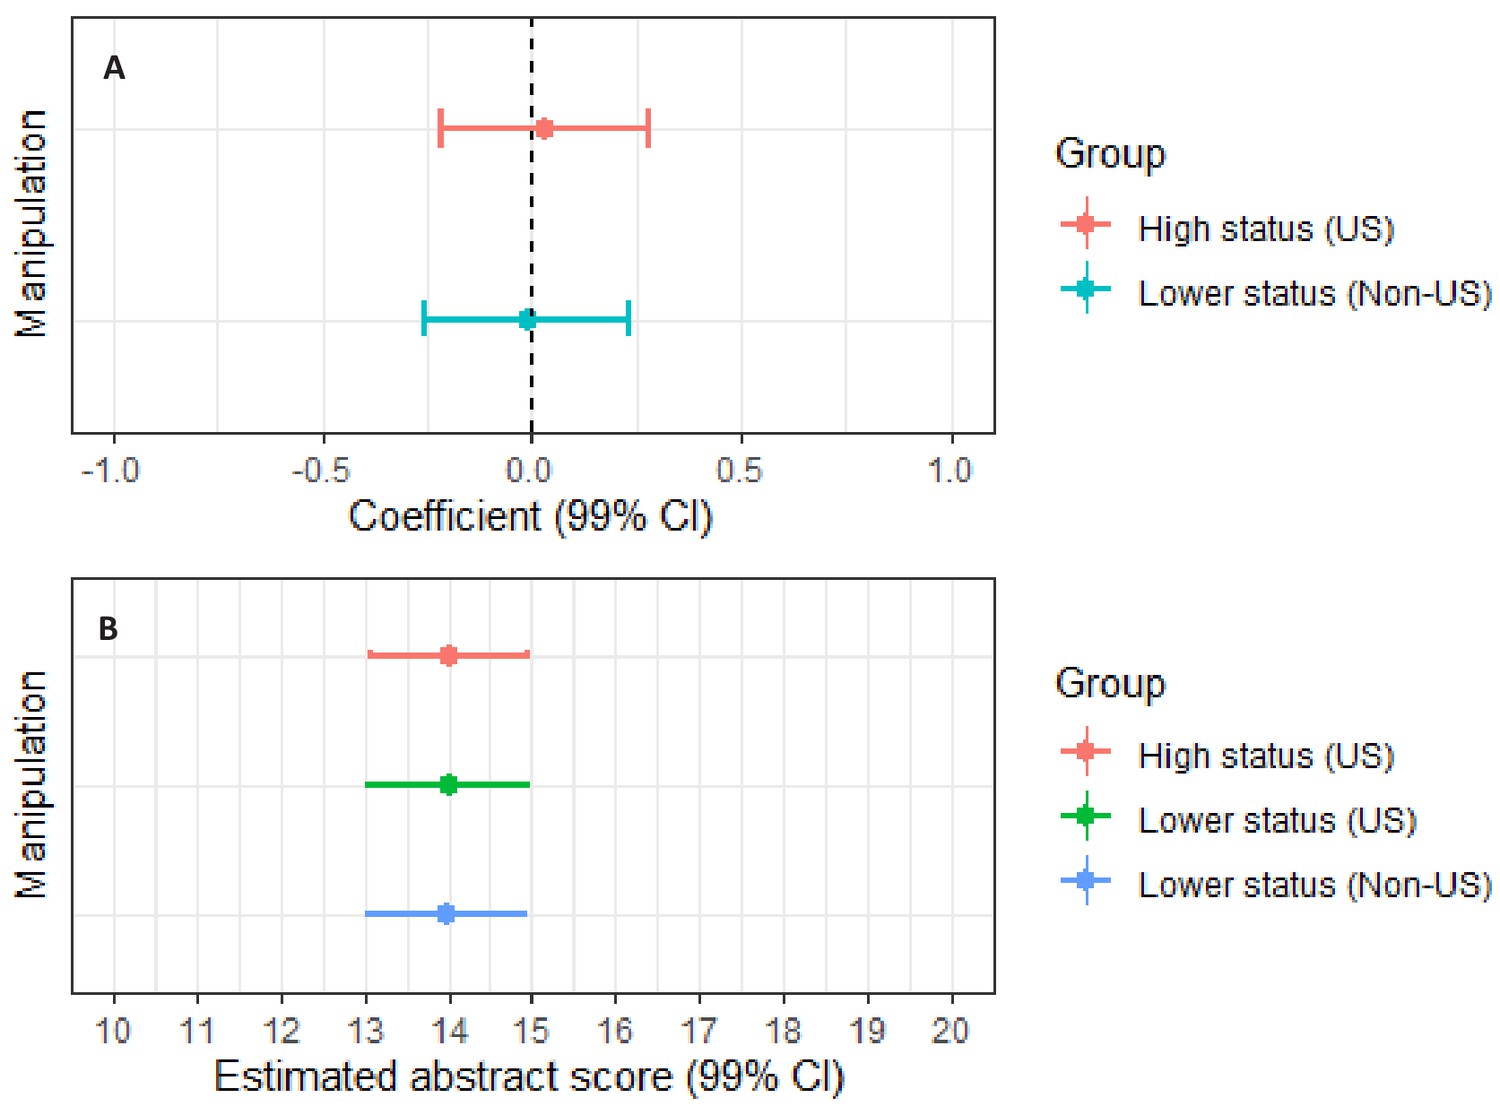
Plots of fixed coefficients and adjusted means derived from the mixed-linear regression model with "Abstract score" as outcome.
Panel A plots the fixed coefficients for manipulation 1 (high-status university, US) and manipulation 3 (lower-status university, non-US). Manipulation 2 (lower-status university, US) is the reference group. Panel B plots the adjusted means for manipulation 1, manipulation 2 and manipulation 3. Error bars represent 99% CIs. The figure shows that status cues in the form of institutional affiliation or national affiliation have no tangible effects on the respondents’ assessments of abstracts. For model specifications, see Supplementary file 2, Table S25.
Figure 5

Plots of odds ratios and adjusted means derived from the mixed logit regressions with "Open full text" (upper part) and "Include in conference" (lower part) as outcomes.
Panel A displays the odds ratios for respondents exposed to manipulation 1 (high-status university, US) or manipulation 3 (lower-status university, non-US). Manipulation 2 (lower-status university, US) is the reference group. Panel B plots the adjusted means for manipulation 1, manipulation 2 and manipulation 3. Error bars represent 99% CIs. As shown in Panel A, the results for both regression models are inconclusive, and the effect sizes are small. For model specifications, see Supplementary file 2, Tables S26–27.
Tables
Table 1
Sample distributions for the three-way factorial design across the six disciplines.
Number of observations, N, by manipulation (rows) and disciplines (columns).
| Manipulation/Discipline | Astronomy (N = 502) | Cardiology (N = 609) | Mat. science (N = 546) | Pol. science (N = 1008) | Psychology (N = 624) | Public health (N = 732) |
|---|---|---|---|---|---|---|
| Higher status (US) | N = 209 | N = 191 | N = 196 | N = 351 | N = 216 | N = 241 |
| Lower status (US) | N = 192 | N = 213 | N = 187 | N = 319 | N = 205 | N = 237 |
| Lower status (non-US) | N = 191 | N = 205 | N = 163 | N = 338 | N = 213 | N = 254 |
Additional files
-
Supplementary file 1
Qualtrics survey (astronomy); the six abstracts used in the survey experiment; email invitation.
- https://cdn.elifesciences.org/articles/64561/elife-64561-supp1-v2.docx
-
Supplementary file 2
Tables S1-S50.
- https://cdn.elifesciences.org/articles/64561/elife-64561-supp2-v2.docx
-
Transparent reporting form
- https://cdn.elifesciences.org/articles/64561/elife-64561-transrepform-v2.pdf
Download links
A two-part list of links to download the article, or parts of the article, in various formats.
Downloads (link to download the article as PDF)
Open citations (links to open the citations from this article in various online reference manager services)
Cite this article (links to download the citations from this article in formats compatible with various reference manager tools)
Meta-Research: Weak evidence of country- and institution-related status bias in the peer review of abstracts
eLife 10:e64561.
https://doi.org/10.7554/eLife.64561


