Climate Classification: Exploring a new way to think about climate regions
A new system for classifying climates emerges from modeling the environmental conditions that 26,000 species of tetrapods experience in their home range.
- Department of Life Sciences, Texas A&M University-Corpus Christi, United States
Most species are adapted to certain climates. Some are suited to the arid conditions of the Australian desert, whereas others prefer milder climates such as the temperate forests of North America. Variations in the Earth’s climate can be used to predict where in the world a species is most likely to inhabit (Woodward et al., 2004; Higgins et al., 2016). Identifying the impact climate has on biodiversity is important for understanding how different species will respond to global climate change (Bellard et al., 2012; Rock and Daru, 2021).
The Köppen system classifies the Earth’s climate into distinct zones based on the vegetation that grows in each region (Köppen, 1923). This system is based on the assumption that plant distributions are closely linked to climate (Olson et al., 2001). However, it is not clear if climate impacts the distribution of other organisms (such as animals) in the same way.
Now, in eLife, Joaquín Calatayud and co-workers, who are based at Umeå University and Universidad Rey Juan Carlos, report a new set of climate regions based on an analysis of 26,000 species of tetrapods, including birds, amphibians, mammals and reptiles (Calatayud et al., 2021). Tetrapods were chosen for this study because their distributions and evolutionary relationships are well known, and because their home ranges and dispersal abilities are different. To determine the local climate of each species, Calatayud et al. calculated the water level (measured as annual rainfall) and energy level (estimated as the amount of evaporation that occurs each month) of their home range: this means, for example, that a tropical rainforest would be a region with high water and energy levels.
Calatayud et al. hypothesized that the geographical location of different climates accounts for most of the geographical variation in tetrapod distributions. To investigate this, they used a computational analysis tool to cluster together local climates that had similar pools of species, and then mapped each group’s geographical location. This revealed 16 distinct climate regions, some of which differ from the regions classified using the Köppen system.
Three of the mismatches were high-energy regions with warmer temperatures that covered rainforests in the Amazonia, Africa and Southeast Asia, while the other four were lower energy regions that covered areas such as the tundra, montane forests, white mountains, and temperate broadleaf forests. Most of these mismatched regions had different species of tetrapods than the regions in the Köppen system, which suggests that variations in climate may impact the distribution of animals differently to plants. It could also imply that these climate regions impose less restrictions, and allow species with a variety of different adaptations to survive in these conditions.
Common approaches for the classification of climate regions are well suited for detecting abrupt changes in climate (Kottek et al., 2006), but may fail to detect more gradual transitions. Calatayud et al. found that most of the regions they identified had more ‘diffuse’ boundaries and contained tetrapod species from neighboring climate groups. This suggests that variations in climate restricts the dispersal of tetrapods less than plants, with the exception of arid climates, such as deserts and continental polar regions, which showed more abrupt transitions.
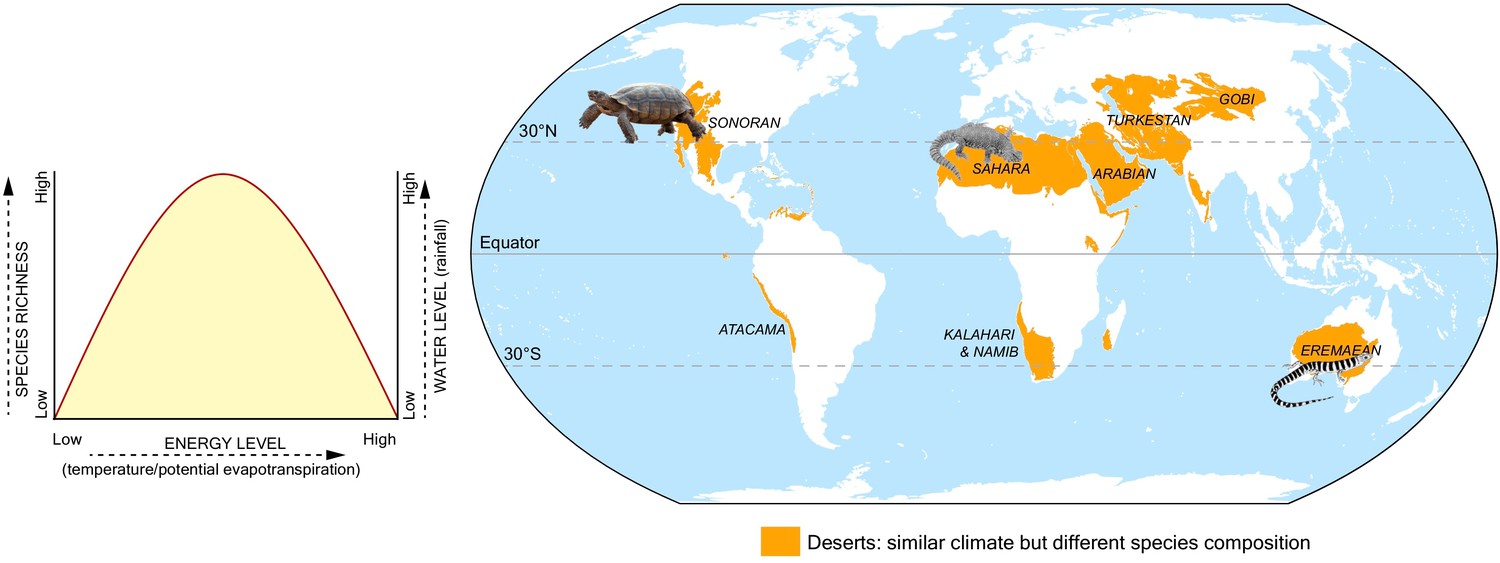
Lastly, Calatayud et al. also found that similar climate regions had similar tetrapod populations, even if they were thousands of miles apart (such as the Amazonian and African rainforests), but there were exceptions: for example, species living in the Australian desert differed from those in the Namib desert or Horn of Africa, despite all three locations being deserts with similar climates (Figure 1). This implies that climate alone is insufficient to account for all patterns of species distribution and abundance, and other variables – such as geographical barriers, colonization abilities, or differences in evolutionary history – may also limit the spread of a species.
Figure 1
Climate and the distribution of tetrapod species.
Calatayud et al. analyzed the climate that 26,000 species of tetrapods experience in their home range, which led to the identification of 16 climate regions. Climates were analyzed in terms of water level (measured as annual rainfall) and energy level (estimated amount of evaporation that occurs each month). Plotting the species richness (y-axis; left), energy (x-axis) and water levels (y-axis; right) in each of these regions reveals that areas with mid-levels of energy and high rainfall have the greatest species richness (left side graph). Calatayud et al. found that similar climate regions tended to have similar tetrapod populations, even if they were thousands of miles apart. However, this was not the case for arid regions such as deserts (shown in orange on the map): for example, bearded lizards that have colonized the Sahara are not found in the Eremaean desert region in Australia, despite both having similar climates.
A number of complications in the analysis will no doubt raise questions. As with all clustering analysis, selecting the optimal number of bins (the number of intervals that the values recorded will be aggregated into) is critical for biogeographic regionalization (Kreft and Jetz, 2013; Daru et al., 2020). An insufficient number of bins can result in the loss of information, whereas an excessive number can compromise model performance (Rosvall and Bergstrom, 2008; Vilhena and Antonelli, 2015). In addition, the analysis only used two climatic variables – water and energy – and other variables may show different results.
Nonetheless, this study challenges the idea of using the same climate classification for multiple organisms, and suggests ecological studies should use systems tailored for each taxonomic group. An exciting avenue of research could be to quantify the phylogenetic and functional differences underlying the climate region of each tetrapod group in comparison to lesser known taxa, such as microbes or insects. Further analyses of climate classification might also help identify climate regions that are the result of human activities, causing organisms to spread into new environments, or native species to go extinct.
These findings have direct implications for our understanding of how tetrapods track climate differently to plants. They may also provide clues as to which animal communities are most susceptible to changes driven by the overall warming of the Earth’s climate.
References
-
Impacts of climate change on the future of biodiversityEcology Letters 15:365–377.https://doi.org/10.1111/j.1461-0248.2011.01736.x
-
phyloregion: R package for biogeographical regionalization and macroecologyMethods in Ecology and Evolution 11:1483–1491.https://doi.org/10.1111/2041-210X.13478
-
Defining functional biomes and monitoring their change globallyGlobal Change Biology 22:3583–3593.https://doi.org/10.1111/gcb.13367
-
World map of the Köppen-Geiger climate classification updatedMeteorologische Zeitschrift 15:259–263.https://doi.org/10.1127/0941-2948/2006/0130
-
Impediments to understanding seagrasses’ response to global changeFrontiers in Marine Science 8:608867.https://doi.org/10.3389/fmars.2021.608867
-
A network approach for identifying and delimiting biogeographical regionsNature Communications 6:6848.https://doi.org/10.1038/ncomms7848
-
Global climate and the distribution of plant biomesPhilosophical Transactions of the Royal Society of London. Series B: Biological Sciences 359:1465–1476.https://doi.org/10.1098/rstb.2004.1525
Article and author information
Author details
Publication history
Copyright
© 2021, Daru
This article is distributed under the terms of the Creative Commons Attribution License, which permits unrestricted use and redistribution provided that the original author and source are credited.
Metrics
-
- 1,129
- views
-
- 81
- downloads
-
- 2
- citations
Views, downloads and citations are aggregated across all versions of this paper published by eLife.
Download links
A two-part list of links to download the article, or parts of the article, in various formats.
Downloads (link to download the article as PDF)
Open citations (links to open the citations from this article in various online reference manager services)
Cite this article (links to download the citations from this article in formats compatible with various reference manager tools)
Climate Classification: Exploring a new way to think about climate regions
eLife 10:e67422.
https://doi.org/10.7554/eLife.67422
Further reading
-
- Ecology
Optimal foraging theory posits that foragers adjust their movements based on prey abundance to optimize food intake. While extensively studied in terrestrial and marine environments, aerial foraging has remained relatively unexplored due to technological limitations. This study, uniquely combining BirdScan-MR1 radar and the Advanced Tracking and Localization of Animals in Real-Life Systems biotelemetry system, investigates the foraging dynamics of Little Swifts (Apus affinis) in response to insect movements over Israel’s Hula Valley. Insect movement traffic rate (MoTR) substantially varied across days, strongly influencing swift movement. On days with high MoTR, swifts exhibited reduced flight distance, increased colony visit rate, and earlier arrivals at the breeding colony, reflecting a dynamic response to prey availability. However, no significant effects were observed in total foraging duration, flight speed, or daily route length. Notably, as insect abundance increased, inter-individual distances decreased. These findings suggest that Little Swifts optimize their foraging behavior in relation to aerial insect abundance, likely influencing reproductive success and population dynamics. The integration of radar technology and biotelemetry systems provides a unique perspective on the interactions between aerial insectivores and their prey, contributing to a comprehensive understanding of optimal foraging strategies in diverse environments.
-
- Ecology
- Evolutionary Biology
Understanding the origins of novel, complex phenotypes is a major goal in evolutionary biology. Poison frogs of the family Dendrobatidae have evolved the novel ability to acquire alkaloids from their diet for chemical defense at least three times. However, taxon sampling for alkaloids has been biased towards colorful species, without similar attention paid to inconspicuous ones that are often assumed to be undefended. As a result, our understanding of how chemical defense evolved in this group is incomplete. Here, we provide new data showing that, in contrast to previous studies, species from each undefended poison frog clade have measurable yet low amounts of alkaloids. We confirm that undefended dendrobatids regularly consume mites and ants, which are known sources of alkaloids. Thus, our data suggest that diet is insufficient to explain the defended phenotype. Our data support the existence of a phenotypic intermediate between toxin consumption and sequestration — passive accumulation — that differs from sequestration in that it involves no derived forms of transport and storage mechanisms yet results in low levels of toxin accumulation. We discuss the concept of passive accumulation and its potential role in the origin of chemical defenses in poison frogs and other toxin-sequestering organisms. In light of ideas from pharmacokinetics, we incorporate new and old data from poison frogs into an evolutionary model that could help explain the origins of acquired chemical defenses in animals and provide insight into the molecular processes that govern the fate of ingested toxins.


