Comment on ‘SARS-CoV-2 suppresses anticoagulant and fibrinolytic gene expression in the lung’
- Division of Biology and Medicine, Department of Molecular Microbiology and Immunology, Brown University, United States
Figures
Figure 1

Graphical representation of health meta-data from control group samples as reported in Garvin et al.
(Supplementary file 1 – “Patient Meta-data”).
Figure 2

Box and Whisker plot of the percent of rRNA reads.
Control group and SARS-CoV-2+ fastq files were accessed from public repositories and aligned with CLC genomics workbench as described in Garvin et al. Count data for known RefSeq rRNA features were sorted from CLC generated count tables and summed per sample. rRNA count sums were then divided by the total counts per sample to generate percentages.
Figure 3
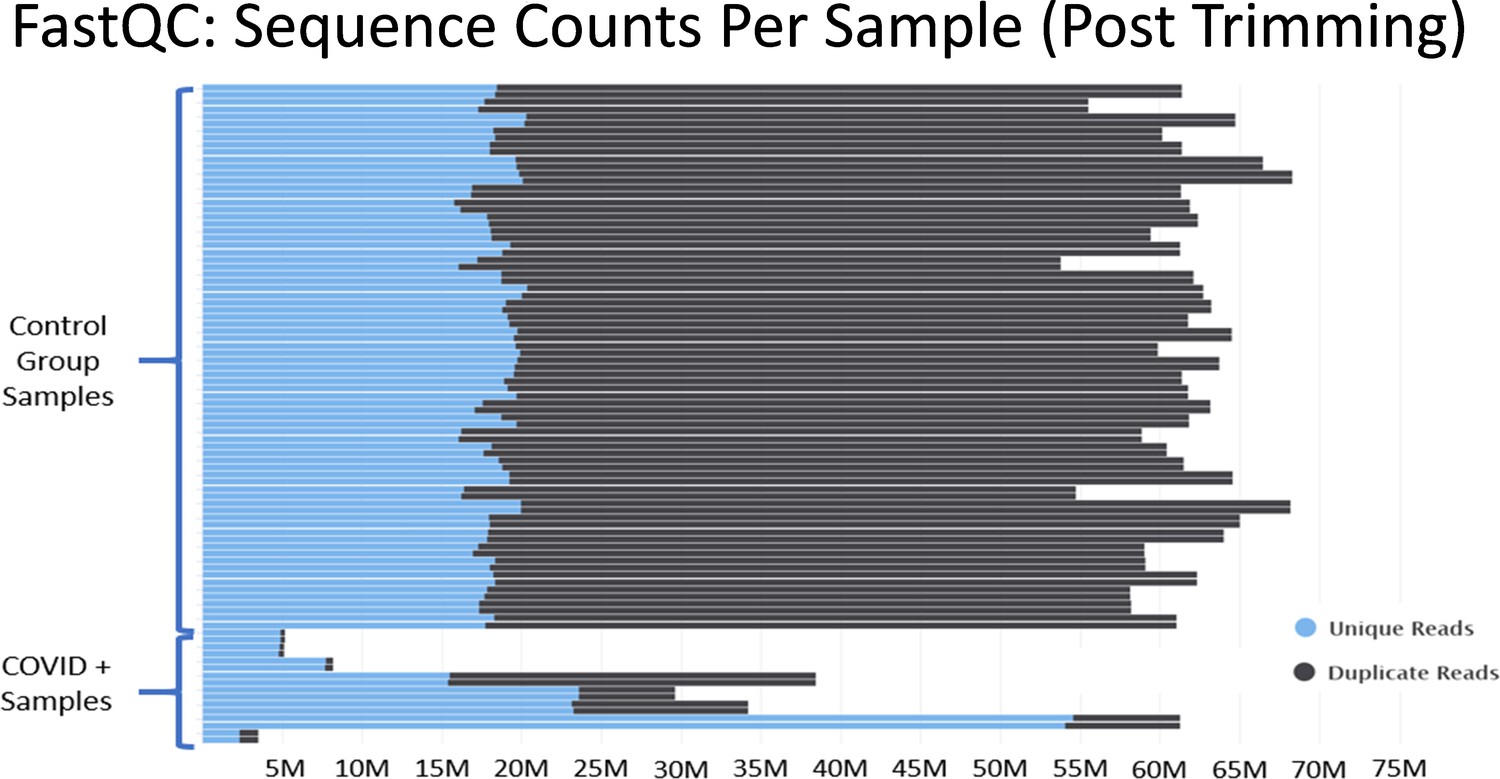
Histograms of the total number of reads per sample after adapter and quality trimming was performed with TrimGalore.
This graphic was generated by analyzing trimmed fastq files using the package FastQC, and then processing the FastQC output into the package MultiQC. MultiQC was used to generate the histogram.
Additional files
-
Supplementary file 1
This file contains a subset of count data derived from Source data 2.
The genes included in the subset were generated using Ensembl Biomart. We first selected human genes (GRCh38.p13) as our data set, before then filtering to only include genes annotated as rRNA encoding (Gene type = rRNA). All rRNA genes identified in the data set with any counts were included.
- https://cdn.elifesciences.org/articles/74268/elife-74268-supp1-v1.xlsx
-
Supplementary file 2
This file contains a subset of count data derived from Source data 2.
The subset of genes include all mentioned genes of interest analyzed in the Mast et al., 2021 publication. All genes of interest from Mast et al. were included regardless of count totals.
- https://cdn.elifesciences.org/articles/74268/elife-74268-supp2-v1.xlsx
-
Transparent reporting form
- https://cdn.elifesciences.org/articles/74268/elife-74268-transrepform1-v1.pdf
-
Source data 1
CLC Alignment QC Reports.
This file contains quality control reports generated during our reproduction of the Mast et al., 2021 data analysis in CLC Genomics Workbench. They demonstrate that we implemented identical analyses based on their description of their methods and provide useful summary information about the alignment process.
- https://cdn.elifesciences.org/articles/74268/elife-74268-supp3-v1.zip
-
Source data 2
Raw Count Tables.
This file contains raw count data for all samples. These counts were generated during the CLC Genomics workbench based alignment process, which was performed as described in the methods of Mast et al., 2021.
- https://cdn.elifesciences.org/articles/74268/elife-74268-supp4-v1.zip
-
Source data 3
EdgeR_DEGs_Mast.
This file contains the output from applying the Mast_EdgeR_script.R code on the raw counts provided in Source data 2.
- https://cdn.elifesciences.org/articles/74268/elife-74268-supp5-v1.zip
-
Source code 1
Mast_EdgeR_script.R.
This file contains an R script which was produced based on correspondence with the authors of Mast et al. It reproduced the implementation of EdgeR which they utilized for differential expression analysis of
- https://cdn.elifesciences.org/articles/74268/elife-74268-supp6-v1.zip
Download links
A two-part list of links to download the article, or parts of the article, in various formats.
Downloads (link to download the article as PDF)
Open citations (links to open the citations from this article in various online reference manager services)
Cite this article (links to download the citations from this article in formats compatible with various reference manager tools)
Comment on ‘SARS-CoV-2 suppresses anticoagulant and fibrinolytic gene expression in the lung’
eLife 11:e74268.
https://doi.org/10.7554/eLife.74268


