Meta-Research: Systemic racial disparities in funding rates at the National Science Foundation
- Chemical and Isotopic Signatures Group, Division of Nuclear and Chemical Sciences, Lawrence Livermore National Laboratory, United States
- Center for Diverse Leadership in Science, University of California, Los Angeles, United States
- Department of Integrative Biology and Museum of Paleontology, University of California, Berkeley, United States
- Department of Earth, Planetary, and Space Sciences, Department of Atmospheric and Oceanic Sciences, Institute of the Environment and Sustainability, and American Indian Studies Center, University of California, Los Angeles, United States
- Department of Earth Sciences, University of Bristol, United Kingdom
- Department of Oceanography and Sea Grant College Program, Daniel K Inouye Center for Microbial Oceanography: Research and Education, University of Hawaiʻi at Mānoa, United States
- School of Mathematical and Natural Sciences, New College of Interdisciplinary Arts and Sciences, Arizona State University, United States
- Department of City and Regional Planning, College of Environmental Design, University of California, Berkeley, United States
Figures
Figure 1 with 3 supplements
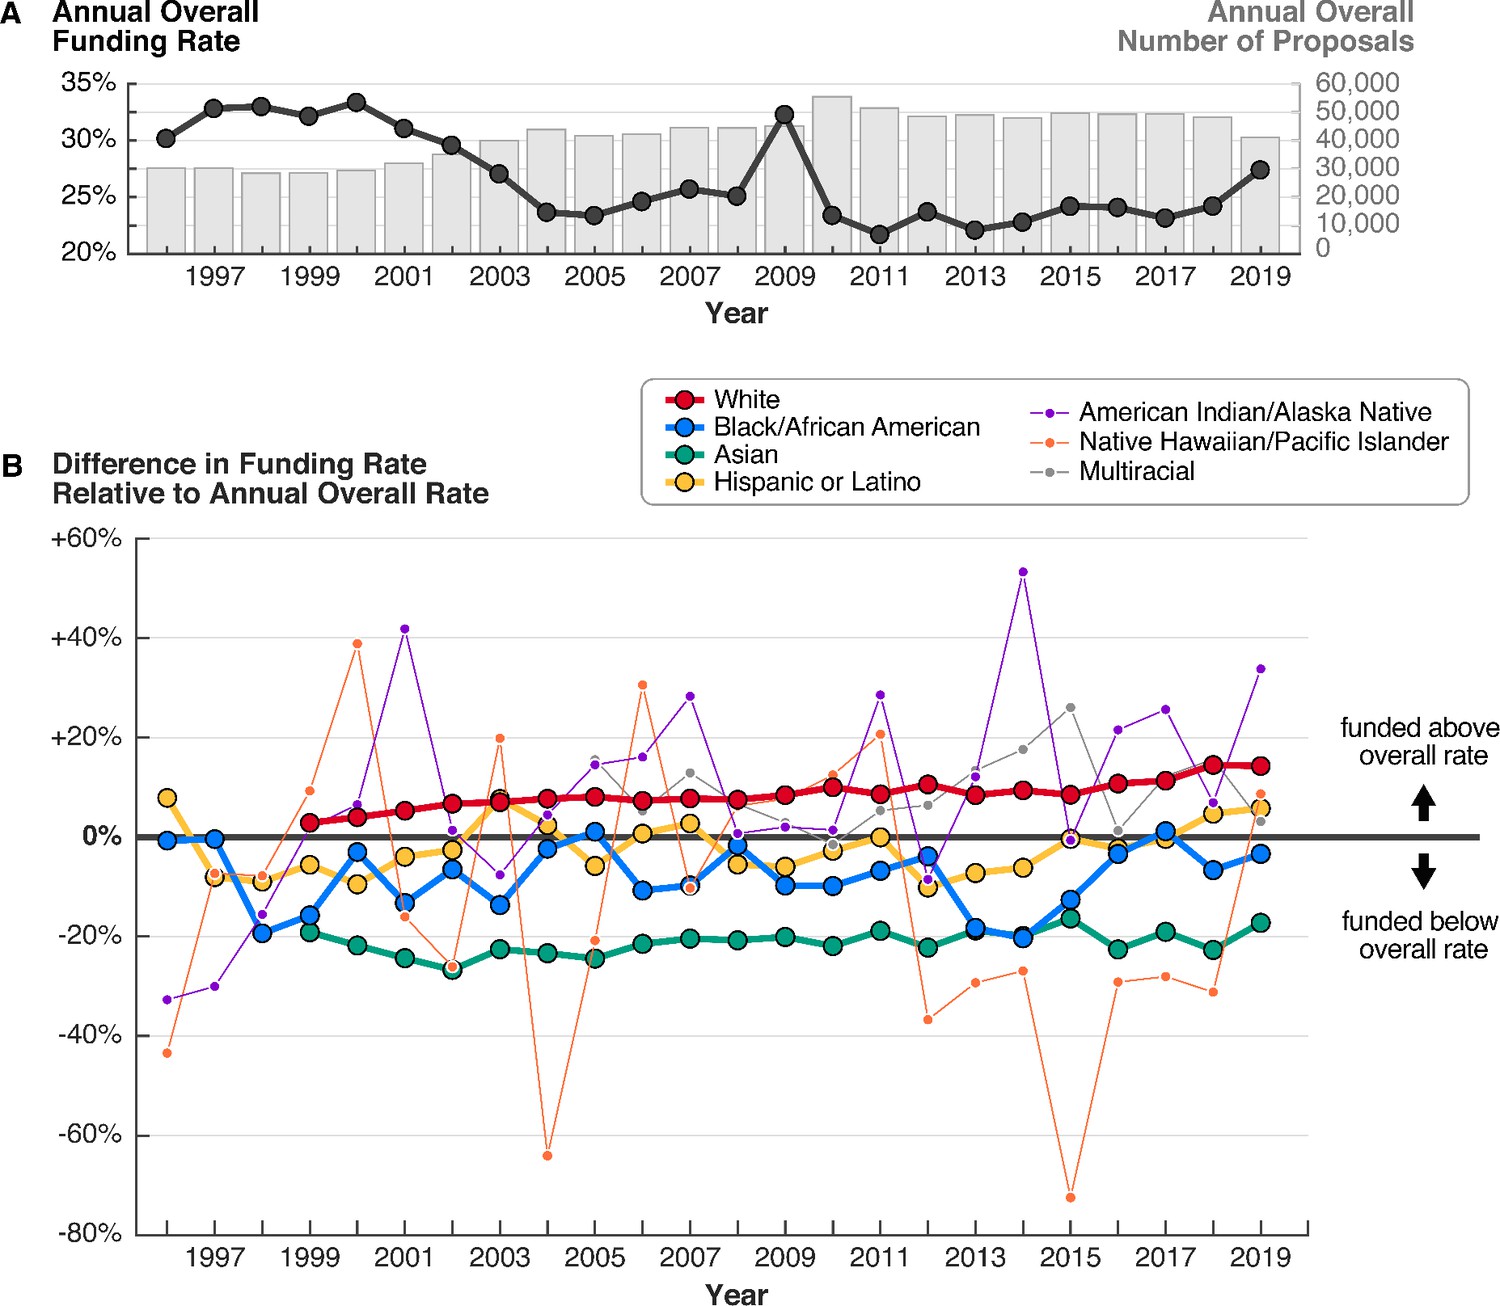
From 1999 to 2019, proposals by white PIs were consistently funded at rates above the overall average, while proposals by most other groups were funded at rates below the overall average.
(A) Overall funding rates (black line) and total number of proposals (gray bars) have fluctuated on a yearly basis over time. (B) Racial disparities in funding rates have persisted for more than 20 years. Funding rates by PI race and ethnicity are normalized to the overall rate for each year. Groups represented by thinner lines submitted on average fewer than 500 proposals annually. Data for white and Asian PIs are only available starting in 1999, and for multiracial PIs starting in 2005. Source data: Data S1 in the accompanying data repository (https://doi.org/10.5061/dryad.2fqz612rt).
Figure 1—figure supplement 1
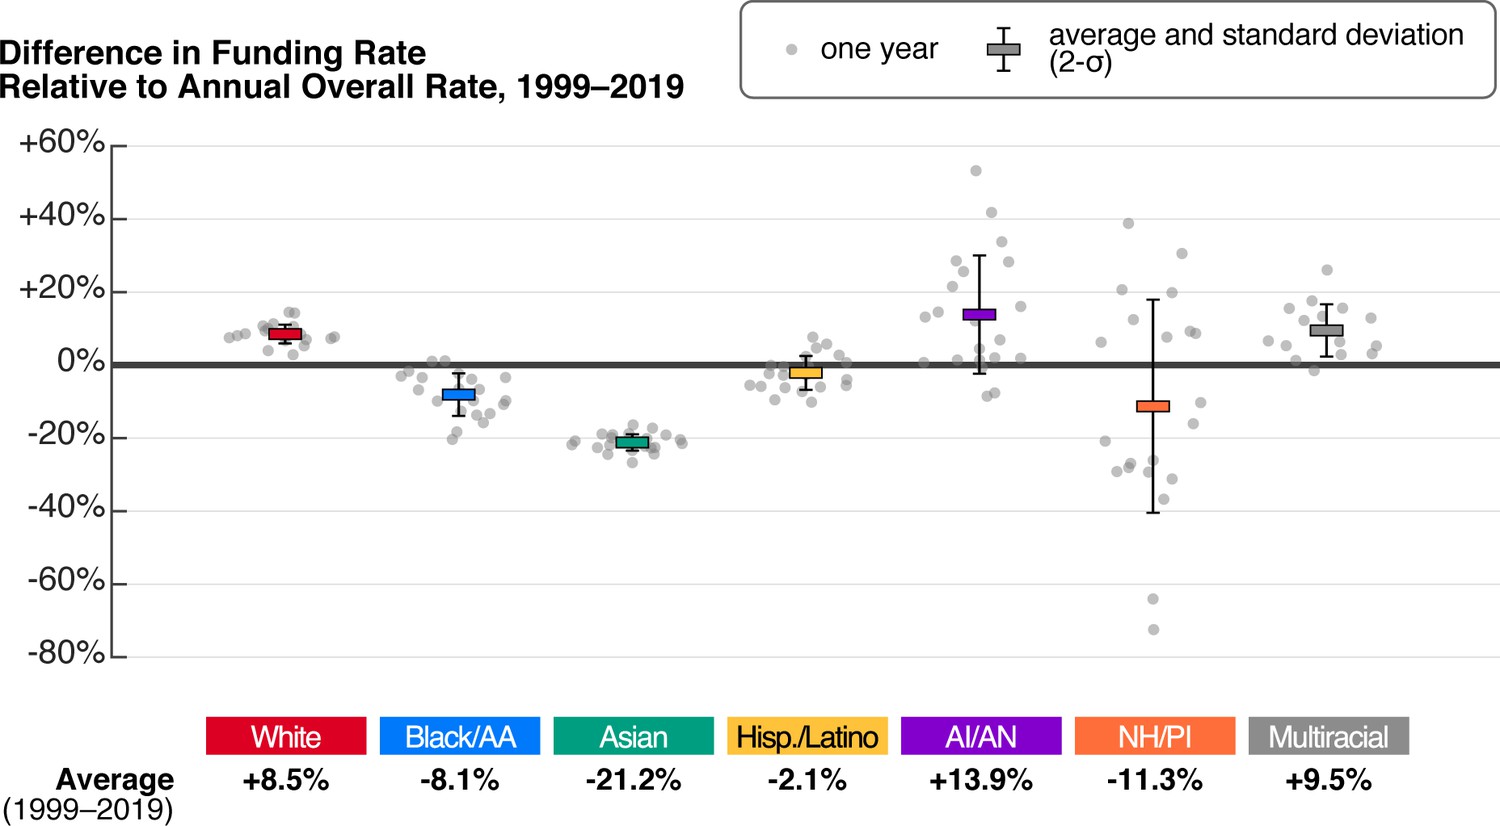
Jitter plot illustrating the variance of annual overall relative funding rates for all proposals by PI race and ethnicity, 1999–2019.
Each gray dot shows the data for one year. The colored horizontal bars with error bars represent the average and standard deviation of the annual overall relative funding rate for all available data for each group. Averages are reported for each group along the bottom of the chart. Note that only 15 years of data are available for proposals by multiracial PIs (2005–2019). While data for Black/AA, AI/AN, NH/PI and Hispanic or Latino PIs exist for the years 1996–1998, averages are only calculated for the years 1999–2019 to allow for comparability with data for white and Asian PIs, for which data are only available since 1999. Source data: Data S1 in the accompanying data repository (https://doi.org/10.5061/dryad.2fqz612rt).
Figure 1—figure supplement 2
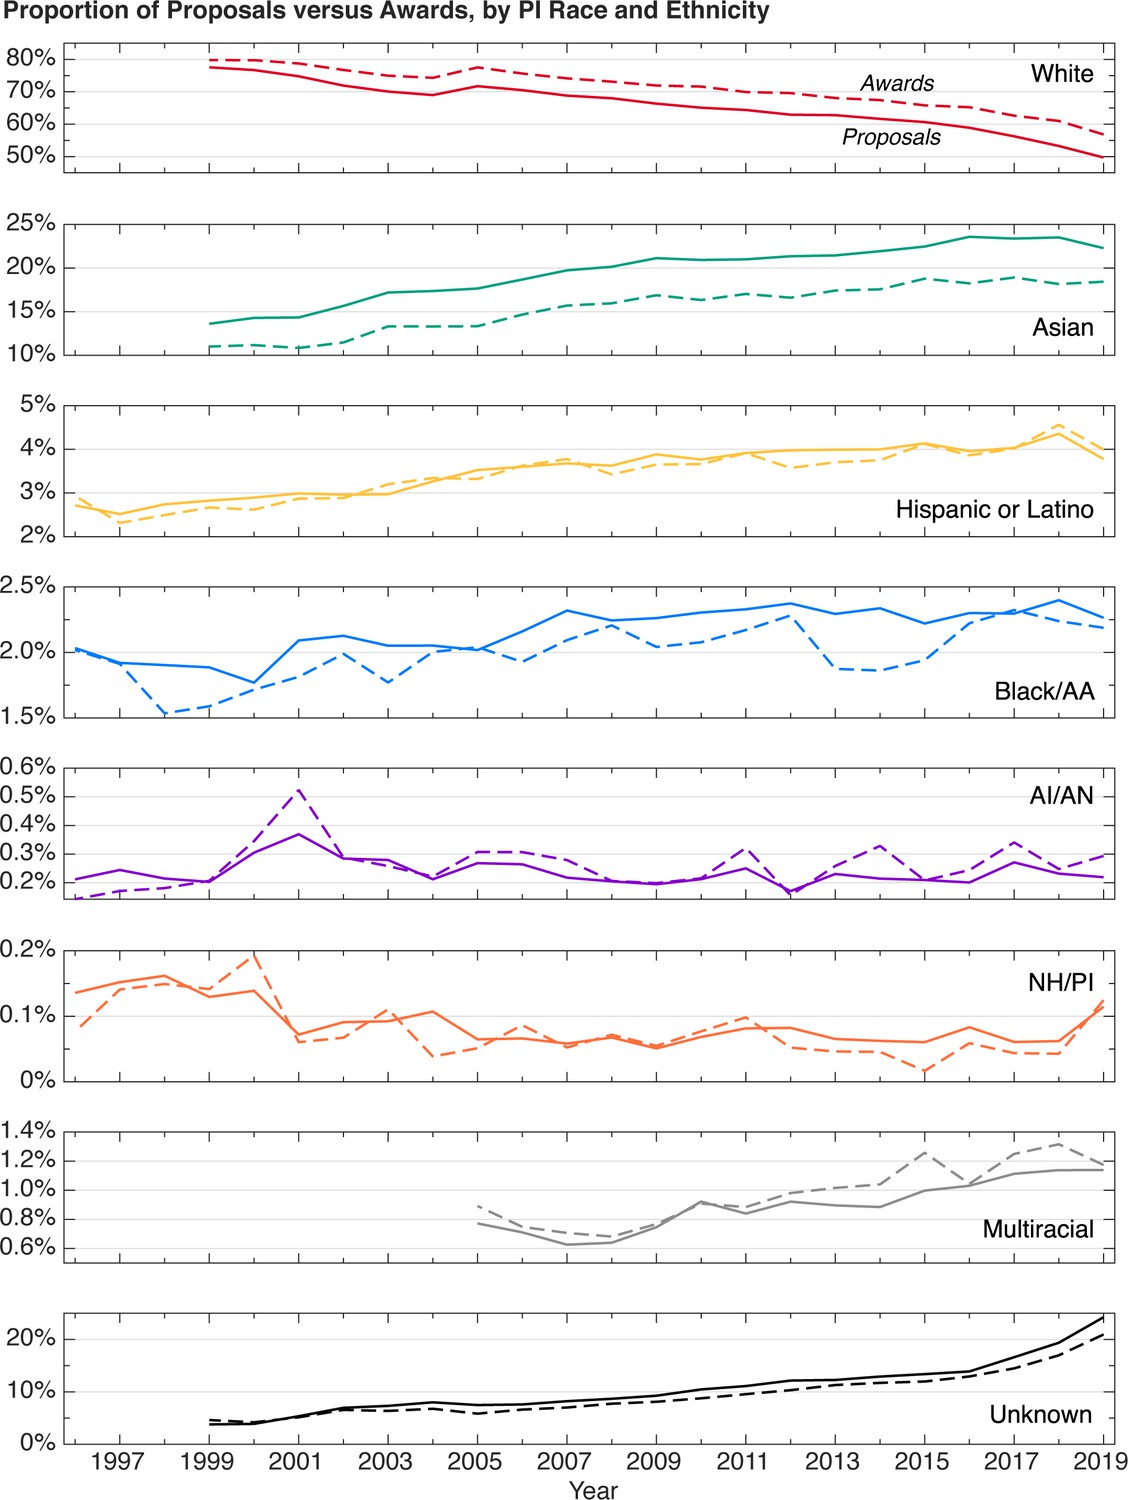
The proportions of all proposals and all awards by PI race and ethnicity, 1996–2019.
Source data: Data S1 in the accompanying data repository (https://doi.org/10.5061/dryad.2fqz612rt).
Figure 1—figure supplement 3
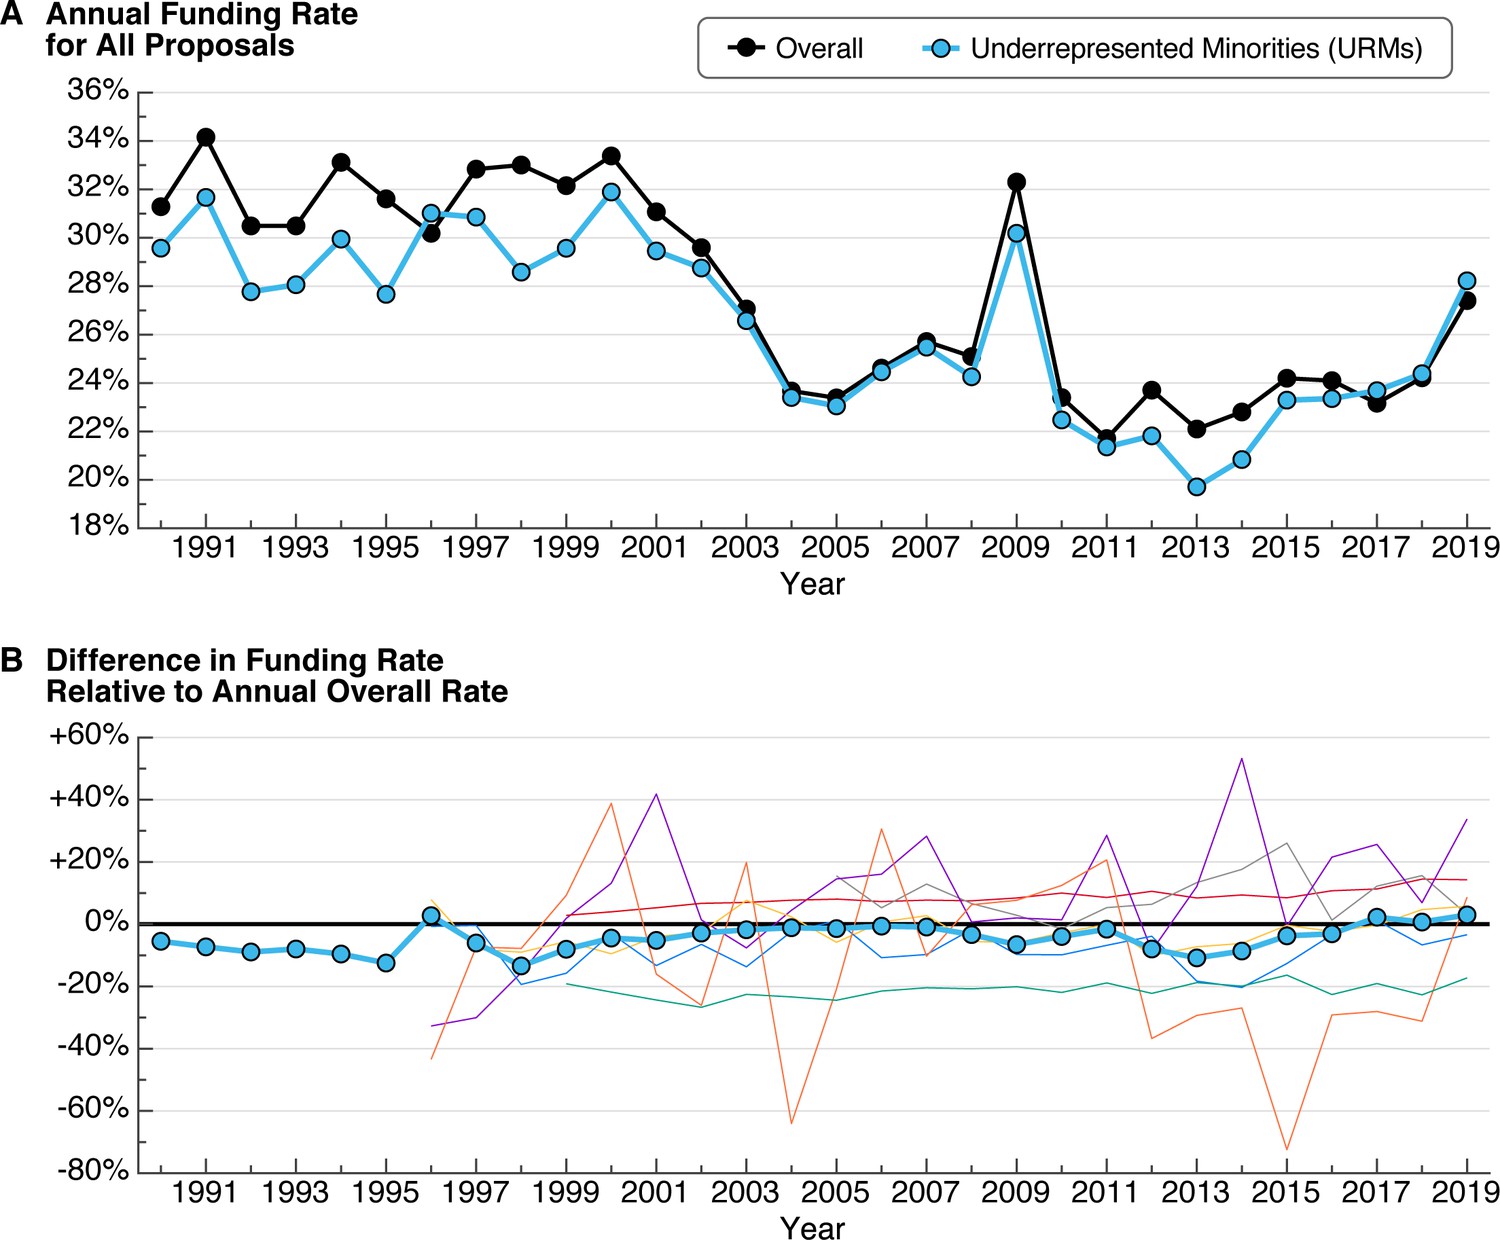
Funding rates and relative funding rates for underrepresented racial and ethnic minority PIs.
(A) Comparison of the overall funding rate (black) and the funding rate for proposals by PIs who are underrepresented racial and ethnic minorities (URMs; blue). NSF defines URM as a category that includes American Indian/Alaska Native (AI/AN), Black/African American (Black/AA), Hispanic or Latino, and Native Hawaiian/Pacific Islander (NH/PI) PIs, and excludes Asian and non-Hispanic white PIs. (B) Comparison of the relative funding rate for proposals by URM PIs (thick blue line with markers) and the relative funding rate for proposals by PIs of other racial and ethnic groups (thin lines; from Figure 1B). Source data: Data S6 in the accompanying data repository (https://doi.org/10.5061/dryad.2fqz612rt).
Figure 2

In 2019, racial disparities in funding rates corresponded to hundreds of awards in surplus to white PIs and hundreds of awards in deficit to other groups.
Each box represents 10 proposals. Light gray boxes are unsuccessful proposals; colored boxes are funded proposals (awards). The black outlines represent 27.4% of the proposals submitted by each group, where 27.4% is the overall funding rate in 2019. For each group, the number of awards above (surplus) or below (deficit) this threshold is in bold. This graphic does not include proposals by multiracial PIs or PIs who did not provide their race or ethnicity. Source data: Data S1 in the accompanying data repository (https://doi.org/10.5061/dryad.2fqz612rt).
Figure 3 with 1 supplement
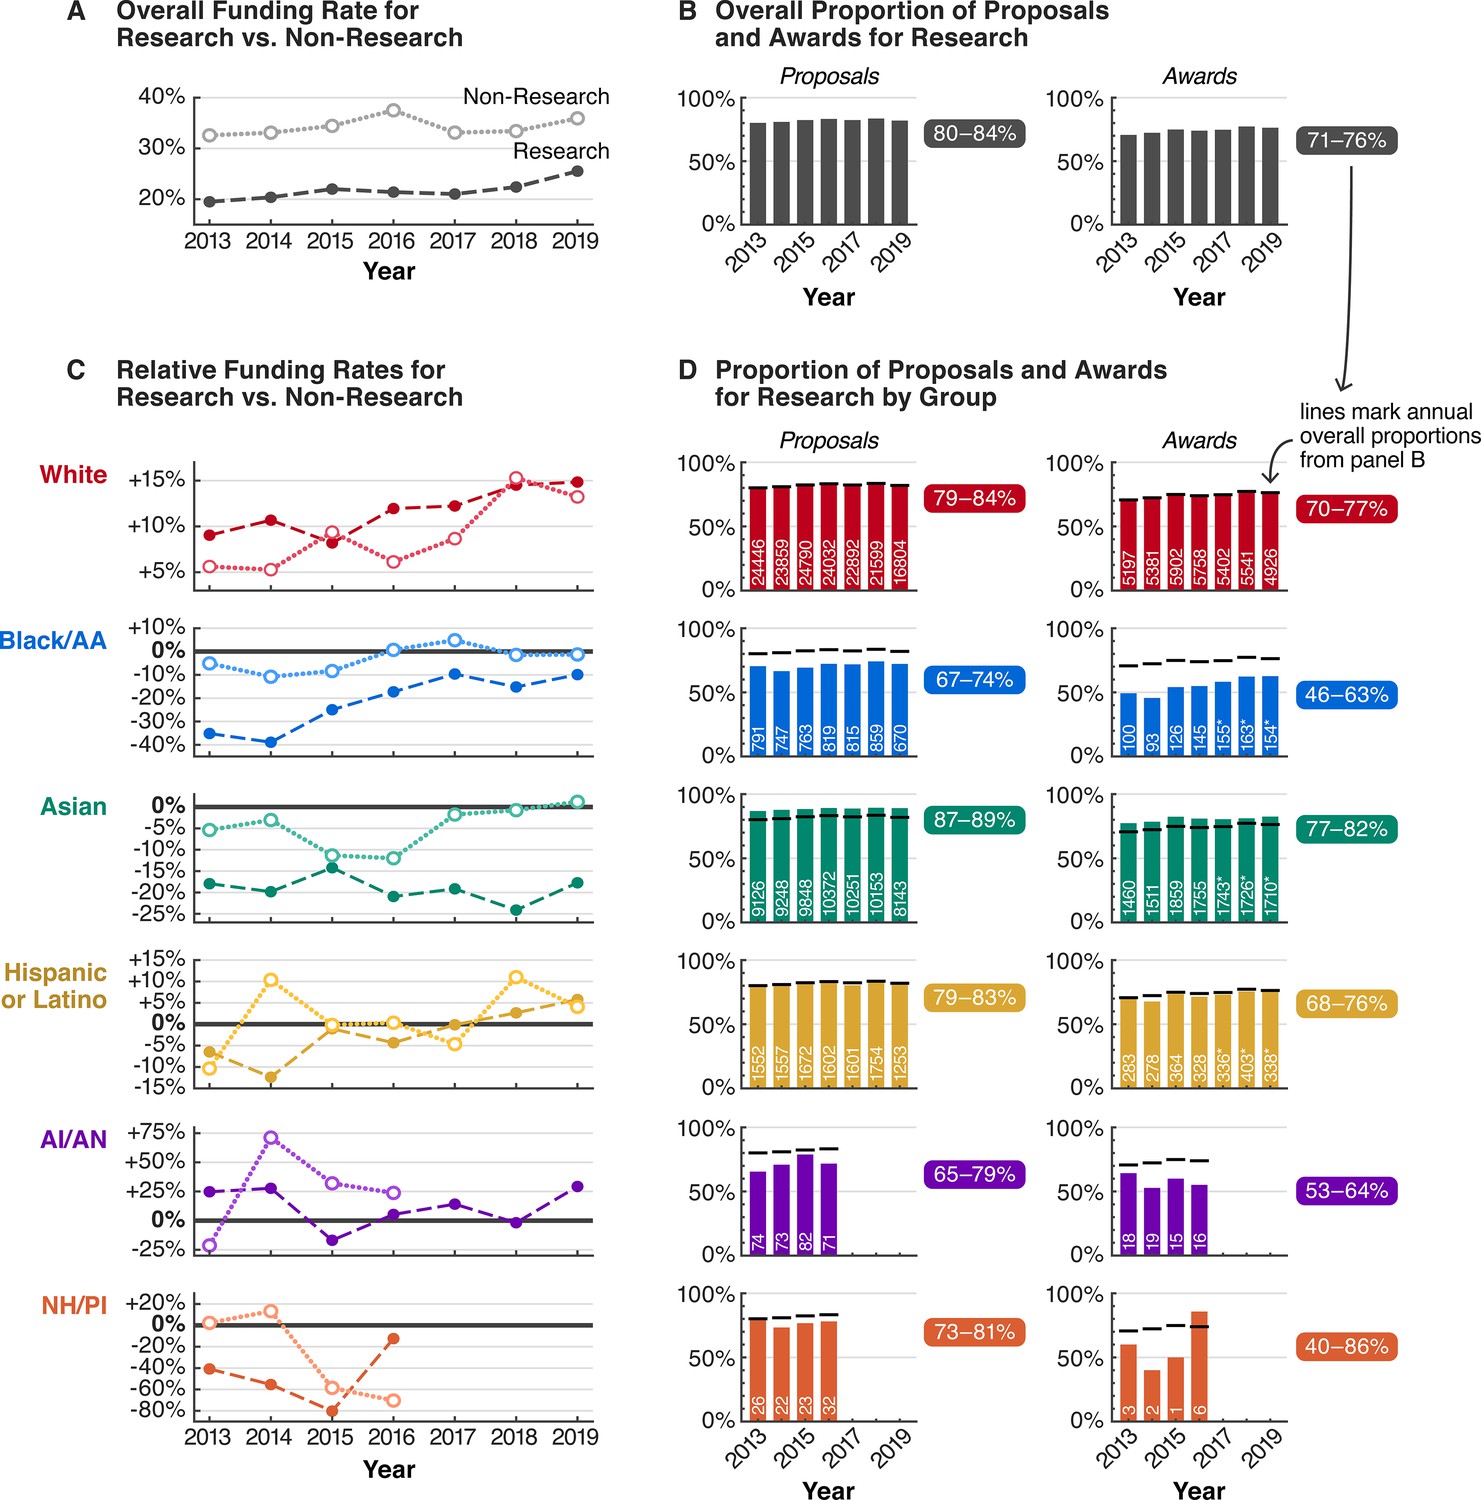
From 2013 to 2019, racial funding disparities were even greater for Research proposals, contributing to racial stratification in Research versus Non-Research activities.
(A) Overall funding rates for Research proposals (dark dashed line) are more competitive than overall funding rates for Non-Research proposals (light dotted line). (B) 80–84% of all proposals and 71–76% of all awards were for Research activities. (C) Both Research and Non-Research proposals by white PIs were funded above overall rates. In contrast, Research proposals by PIs of most other groups were funded below overall rates, and at rates generally lower than those for Non-Research. (D) Only 46–63% of all awards to Black/AA PIs were for Research, far below overall proportions of awards for Research for all groups combined (black horizontal lines; panel B), contributing to a stratification of awarded activities by race. White text denotes the number of Research proposals or awards for each group per year; asterisk indicates that numbers are estimates based on available data. Non-Research data for AI/AN and NH/PI PIs were not available 2017–2019. Source data: Data S2–3 in the accompanying data repository (https://doi.org/10.5061/dryad.2fqz612rt).
Figure 3—figure supplement 1
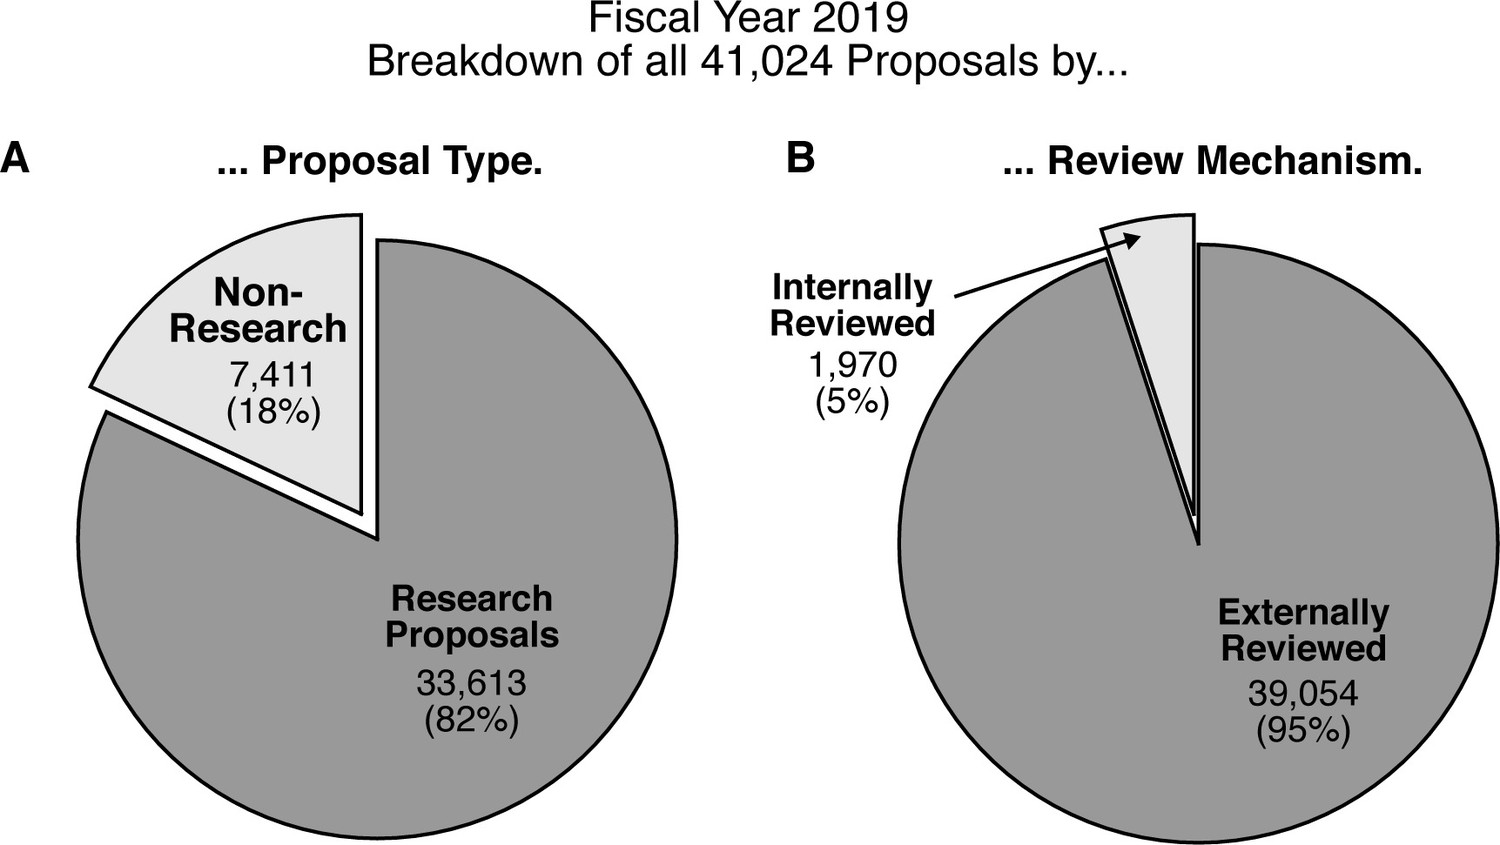
Pie charts representing the percentage breakdown of all proposals from 2019 by proposal type and review mechanism.
(A) Research proposals are the typical mechanism through which NSF funds PIs. NSF defines Non-Research proposals as those for education and training; operation costs for facilities; grants for equipment, instrumentation, conferences, and symposia; and grants in the Small Business Innovation Research program. (B) The “Externally Reviewed” category includes proposals reviewed by panels and/or ad hoc external reviews. The “Internally Reviewed” category includes proposals that were reviewed by NSF program managers and experts, but did not receive external reviews. Proposal types which are not externally reviewed include RAPID, EAGER, RAISE proposals, and small grants for travel and symposia. Proposals that are not included in these charts and are not evaluated in this study are proposals that are returned without review (770 in 2019) and proposals withdrawn by the PI (280 in 2019), which NSF describes as proposals without an award or decline decision.
Figure 4 with 22 supplements
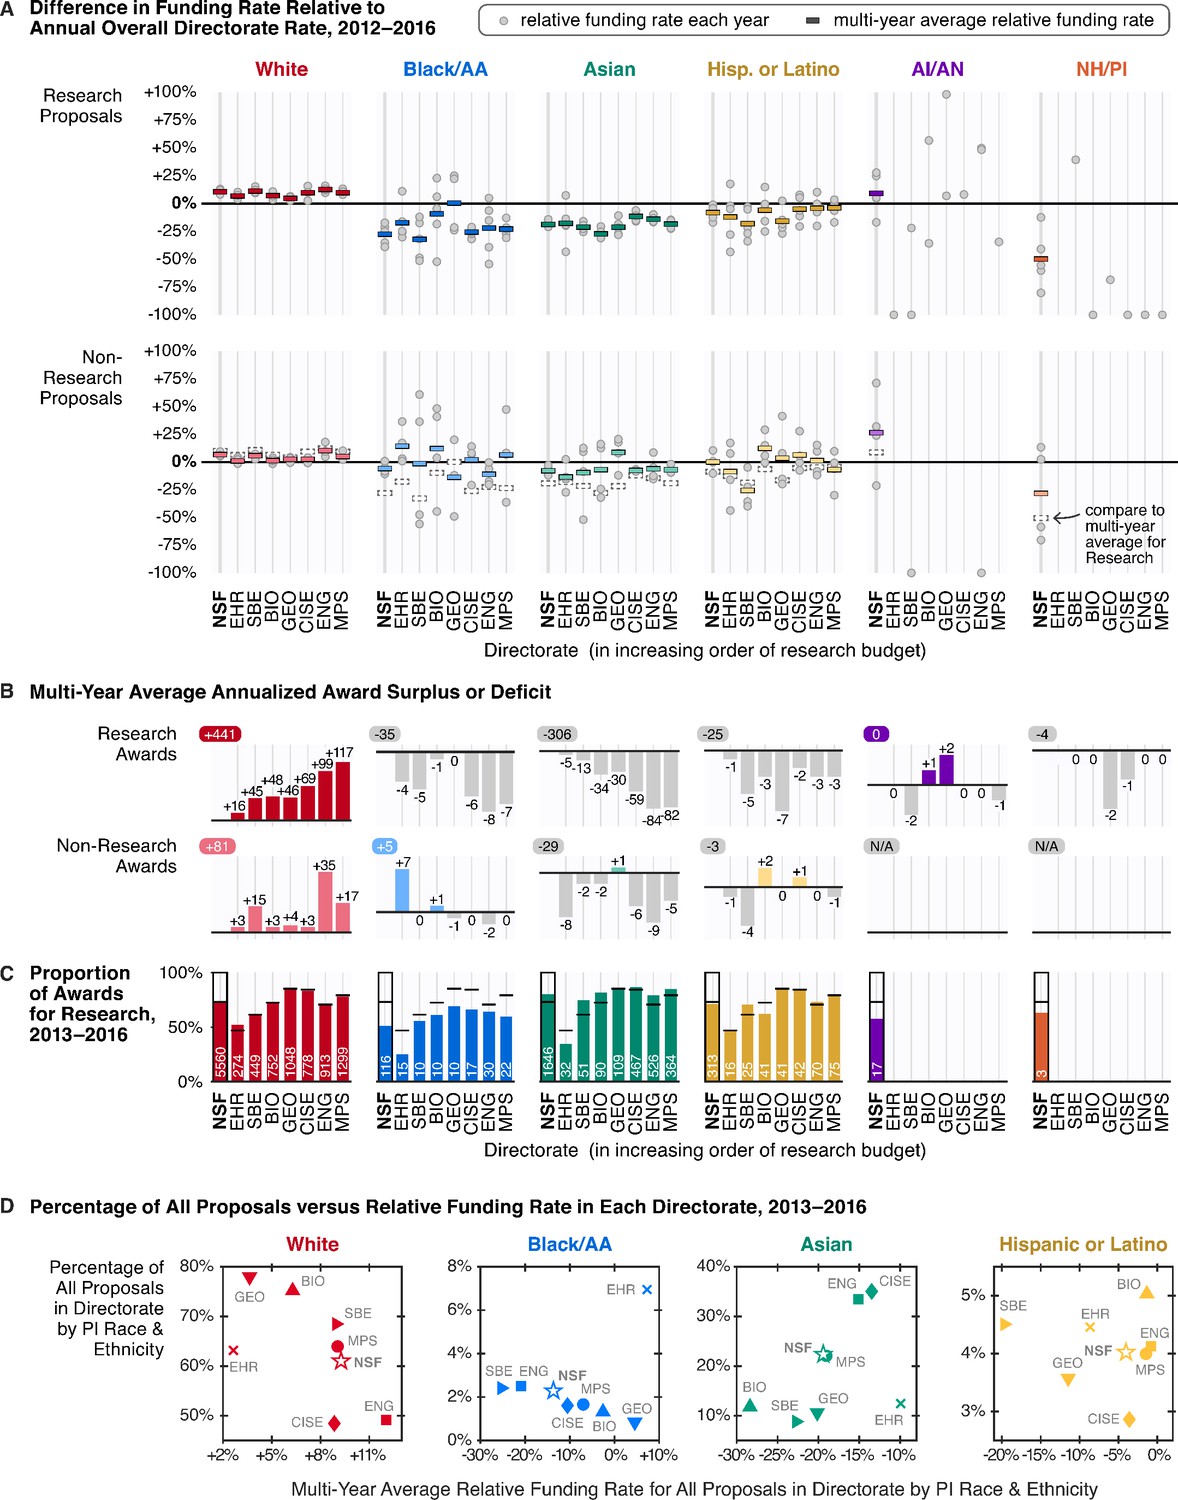
From 2012 to 2016, all disciplinary directorates exhibited racial disparities in funding rates and racial stratification in awarded activities.
(A) Relative funding rates by directorate for Research (top) versus Non-Research (bottom) proposals by PI race and ethnicity. Gray circles mark relative funding rates for each available year; colored rectangles represent the multi-year average. To aid visual comparison, the multi-year average relative funding rate for Research proposals is superimposed on the Non-Research panel as a dotted rectangle. For Research proposals, data are available for at most 5 years (2012–2016); for Non-Research proposals, data are available for at most 4 years (2013–2016). (B) Multi-year average annualized award surplus or deficit per directorate by PI race and ethnicity, for Research (top) and Non-Research (bottom). The upper-left number in each sub-panel is the multi-year average annualized award surplus or deficit for each group for all seven directorates, excluding awards made by the Office of the Director. For AI/AN and NH/PI PIs, only data for Research awards in 2012 are shown; no directorate data for Non-Research awards are available. (C) Proportion of awards for Research by directorate and PI race and ethnicity, compared to overall directorate proportions (black horizontal lines), 2013–2016. White text denotes average annual number of Research awards per directorate to each group. (D) Percentage of all proposals submitted to each directorate by white (red), Black/AA (blue), Asian (green), and Hispanic or Latino PIs (yellow) versus the multi-year average relative funding rate for all proposals by each group, 2013–2016. Source data: Data S4 in the accompanying data repository (https://doi.org/10.5061/dryad.2fqz612rt).
Figure 4—figure supplement 1
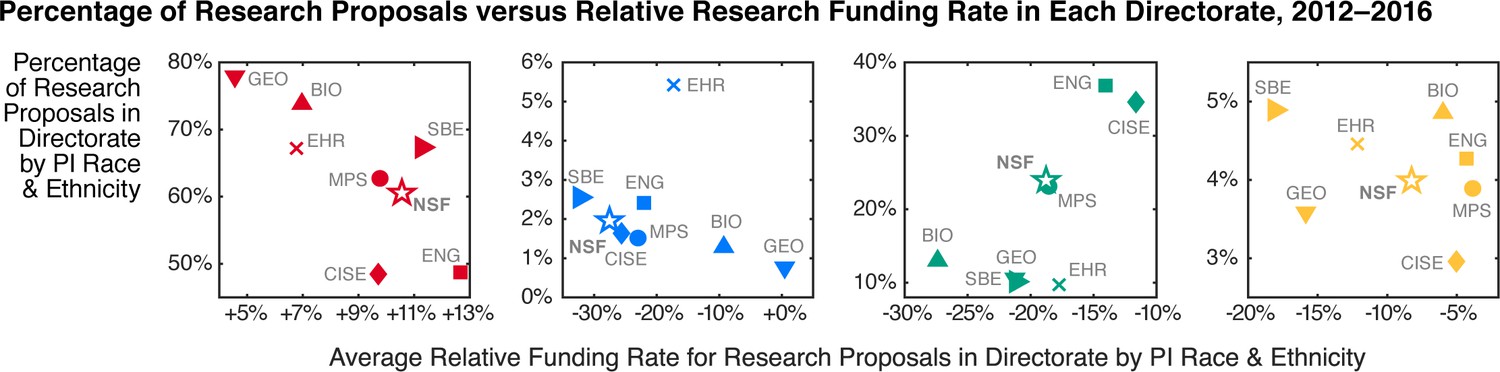
Comparison of average relative funding rates for Research proposals in each directorate and the proportion of Research proposal in each directorate for white, Black/AA, Asian, and Hispanic or Latino PIs.
From left to right: white PIs (red), Black/AA PIs (blue); Asian PIs (green); and Hispanic or Latino PIs (yellow). Abbreviations: Education and Human Resources (EHR); Social, Behavioral, and Economic Sciences (SBE); Biological Sciences (BIO); Geosciences (GEO); Computer and Information Science and Engineering (CISE); Engineering (ENG); and Mathematical and Physical Sciences (MPS). Source data: Data S4 in the accompanying data repository (https://doi.org/10.5061/dryad.2fqz612rt).
Figure 4—figure supplement 2
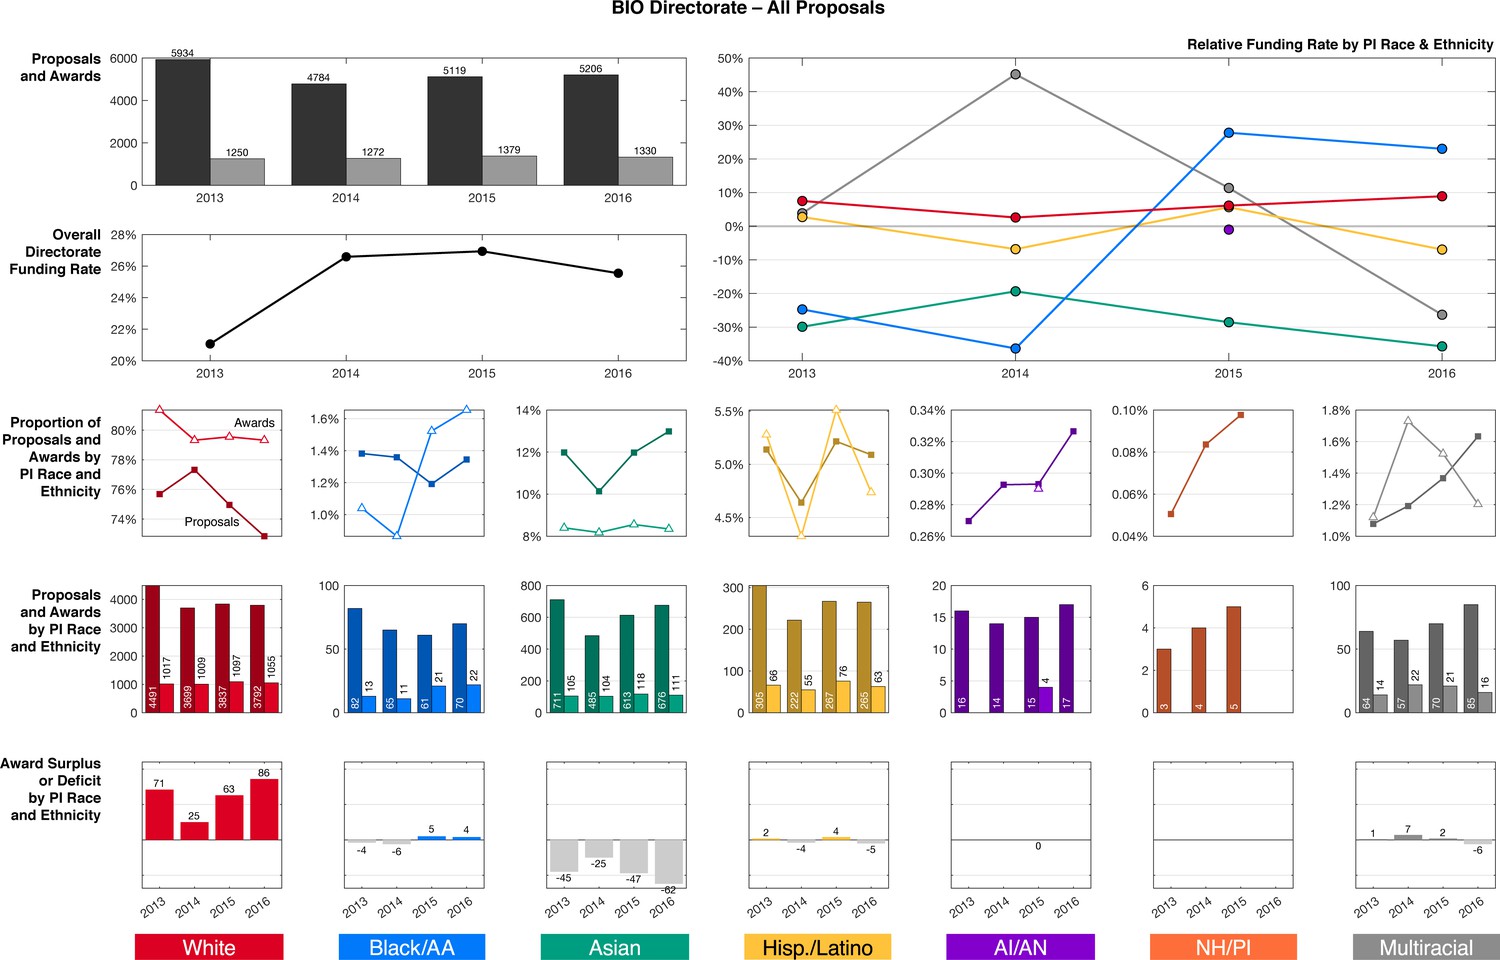
Funding outcomes by PI race and ethnicity for all proposals in the BIO Directorate, 2012–2016.
Source data: Data S4 in the accompanying data repository (https://doi.org/10.5061/dryad.2fqz612rt).
Figure 4—figure supplement 3
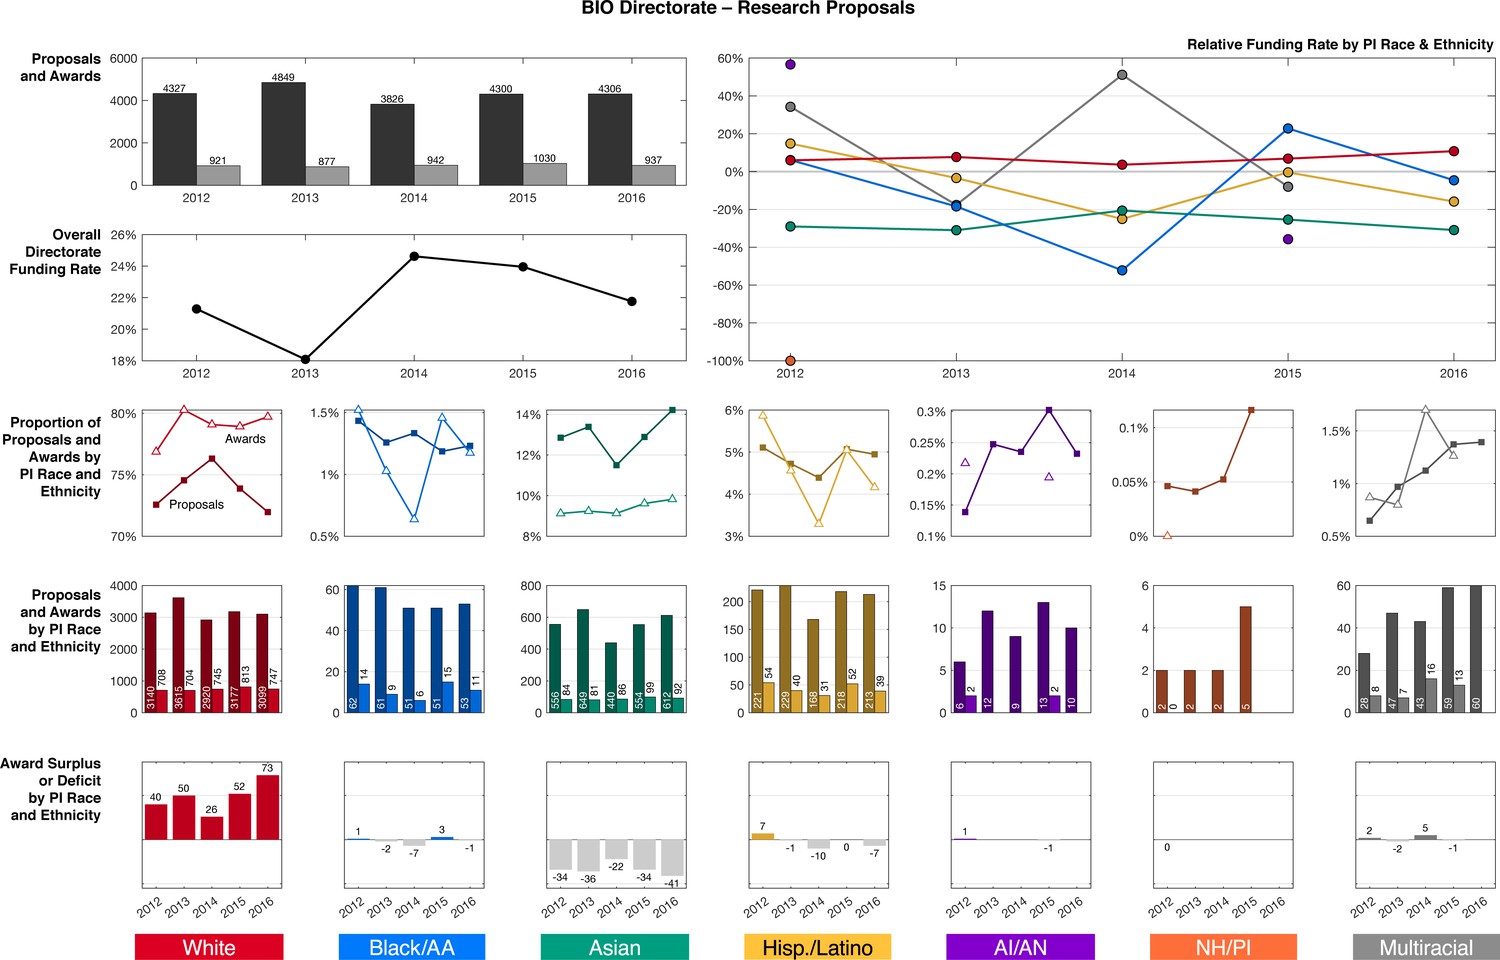
Funding outcomes by PI race and ethnicity for Research proposals in the BIO Directorate, 2012–2016.
Source data: Data S4 in the accompanying data repository (https://doi.org/10.5061/dryad.2fqz612rt).
Figure 4—figure supplement 4
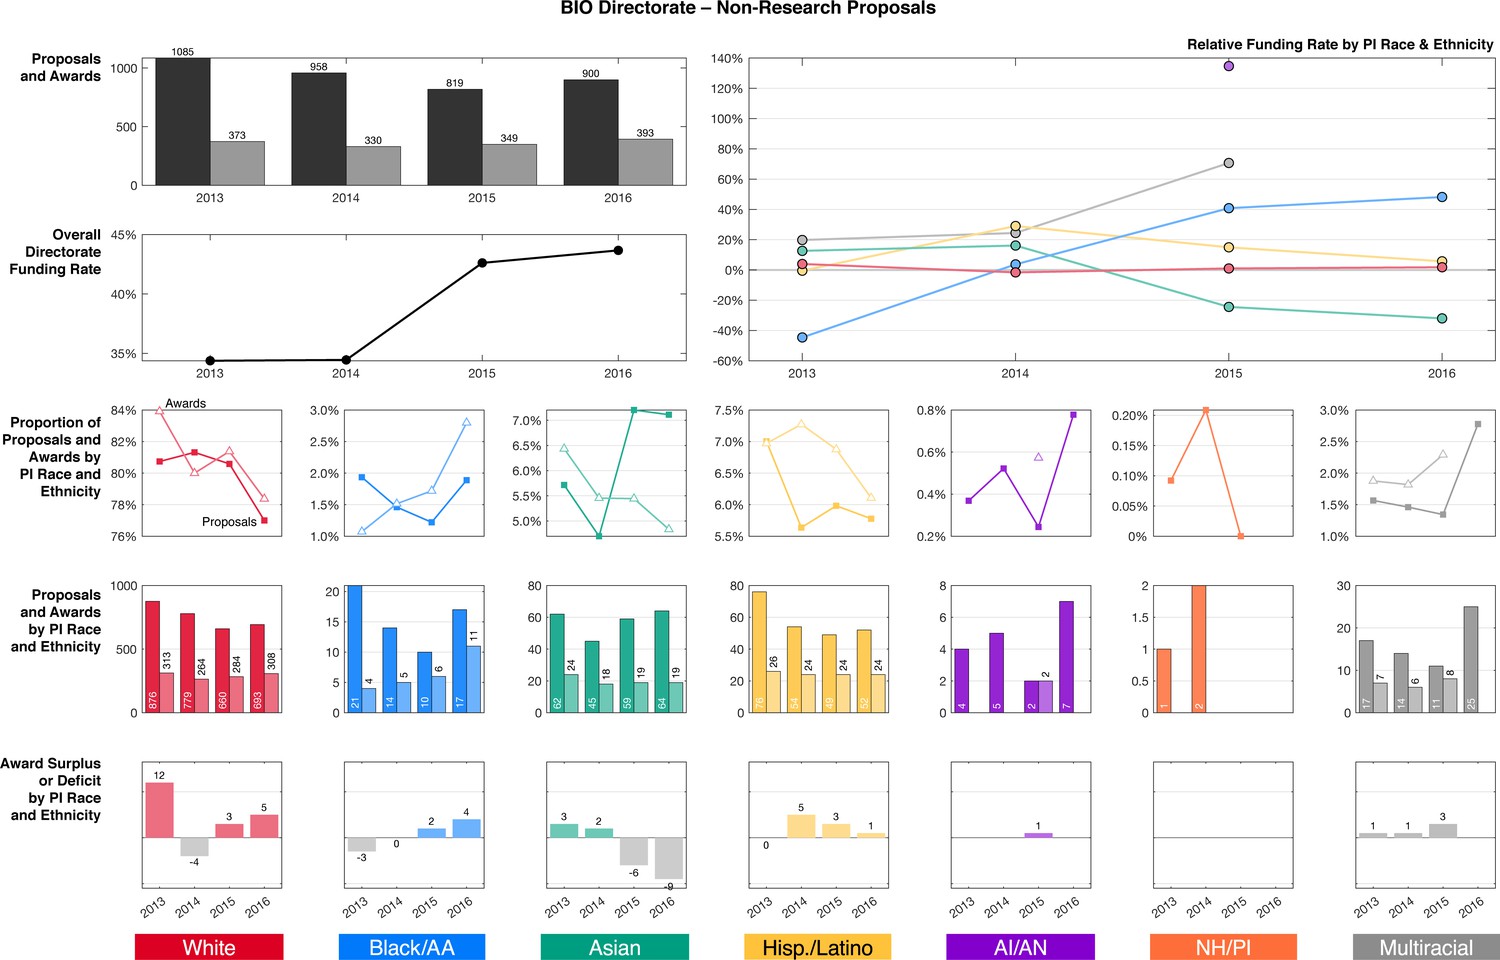
Funding outcomes by PI race and ethnicity for Non-Research proposals in the BIO Directorate, 2012–2016.
Source data: Data S4 in the accompanying data repository (https://doi.org/10.5061/dryad.2fqz612rt).
Figure 4—figure supplement 5
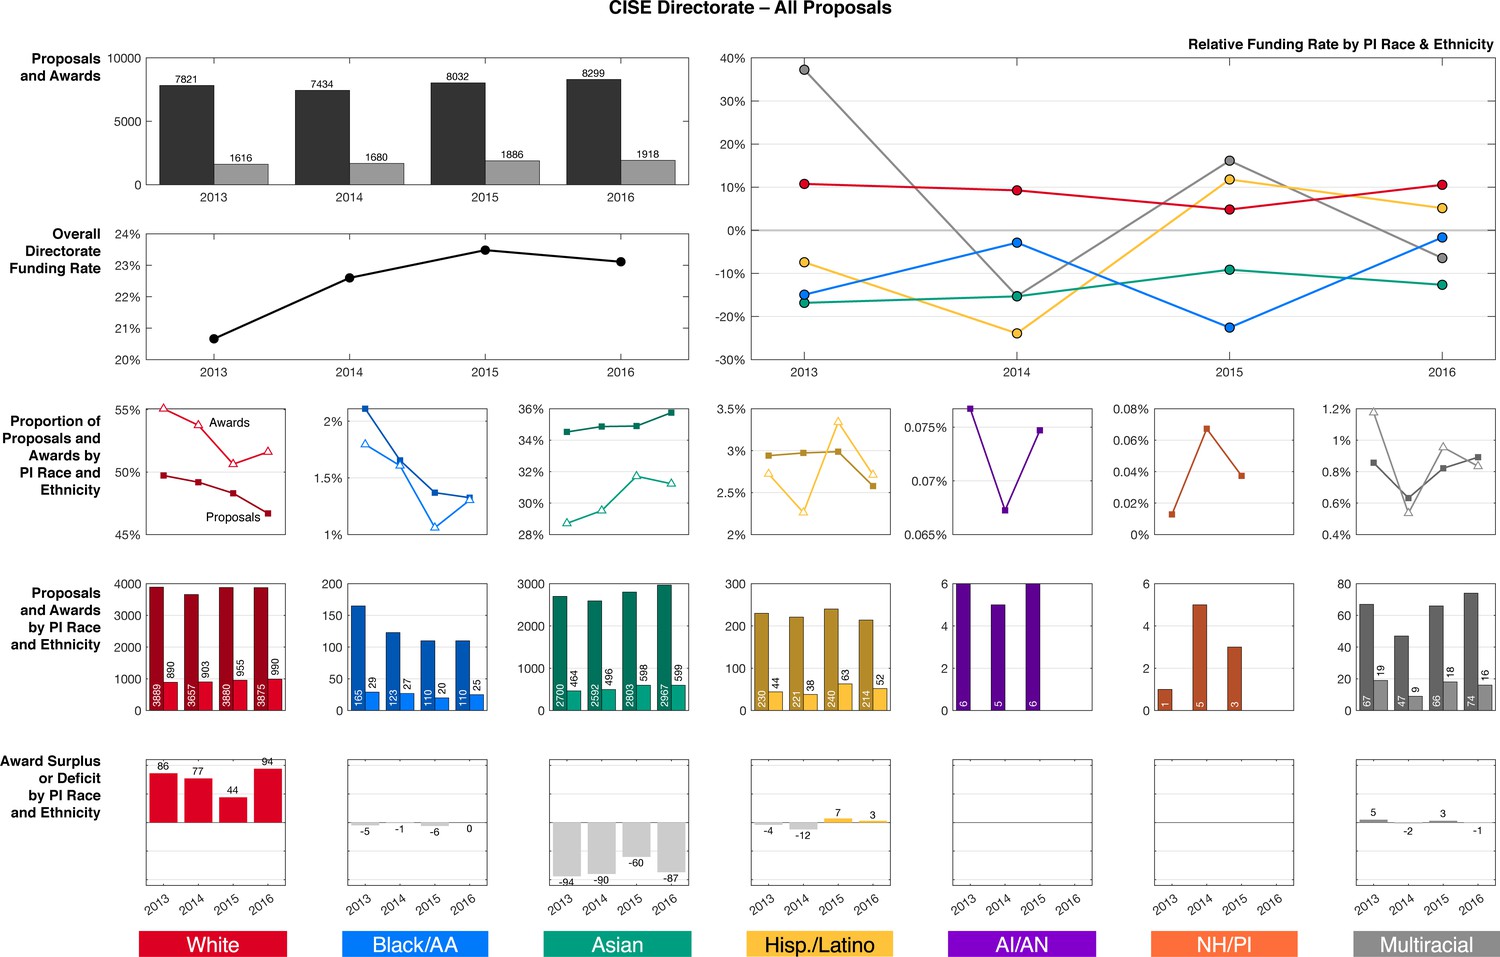
Funding outcomes by PI race and ethnicity for all proposals in the CISE Directorate, 2012–2016.
Source data: Data S4 in the accompanying data repository (https://doi.org/10.5061/dryad.2fqz612rt).
Figure 4—figure supplement 6
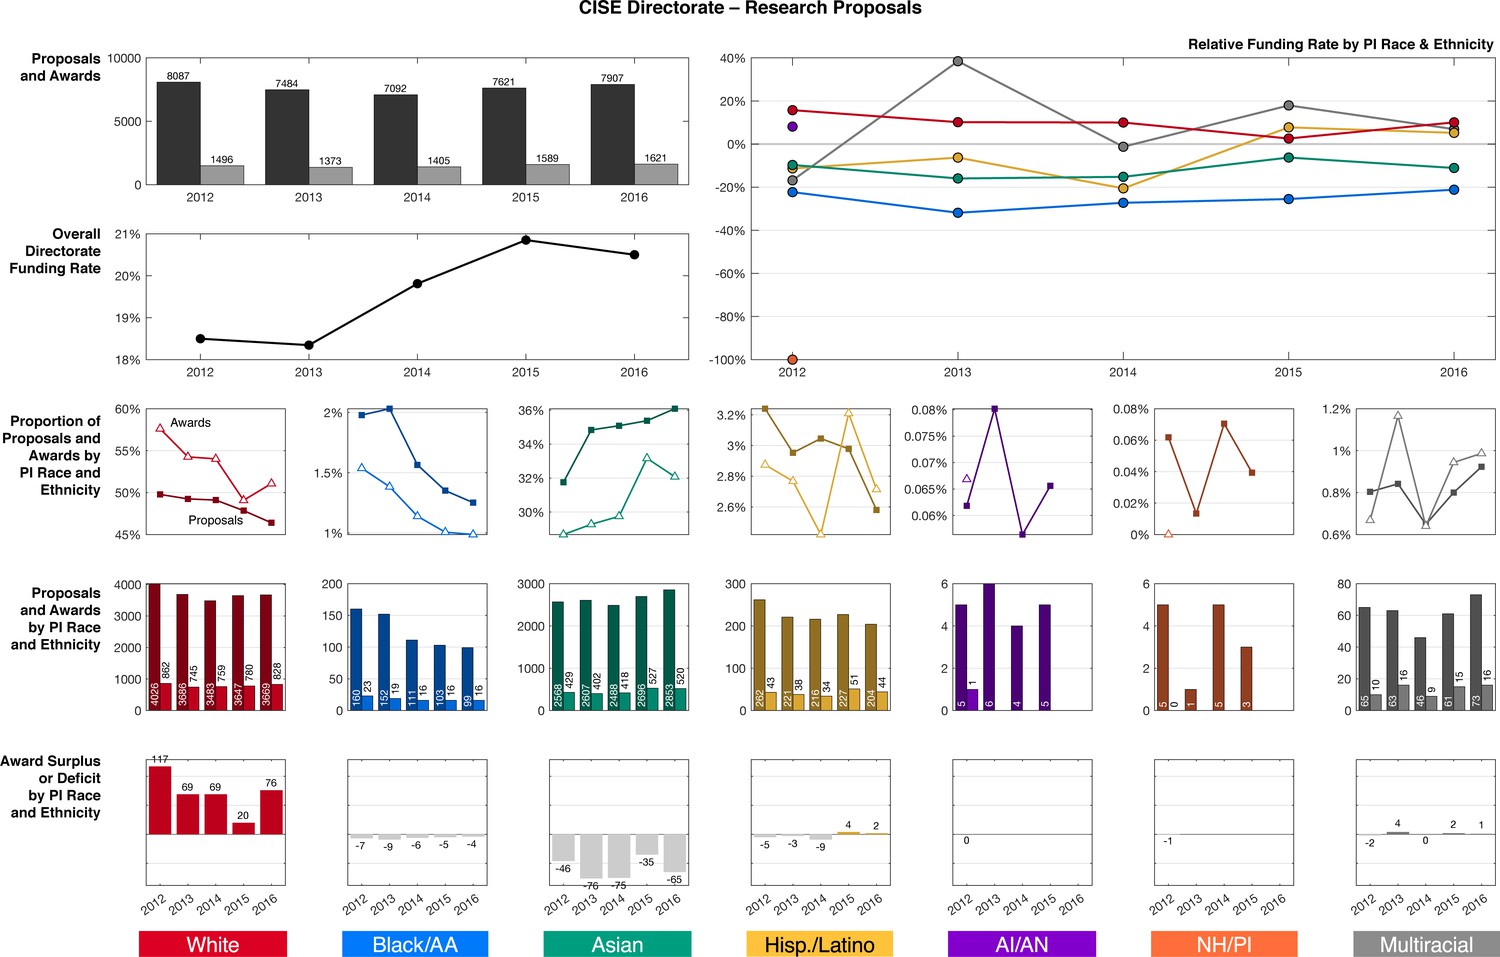
Funding outcomes by PI race and ethnicity for Research proposals in the CISE Directorate, 2012–2016.
Source data: Data S4 in the accompanying data repository (https://doi.org/10.5061/dryad.2fqz612rt).
Figure 4—figure supplement 7
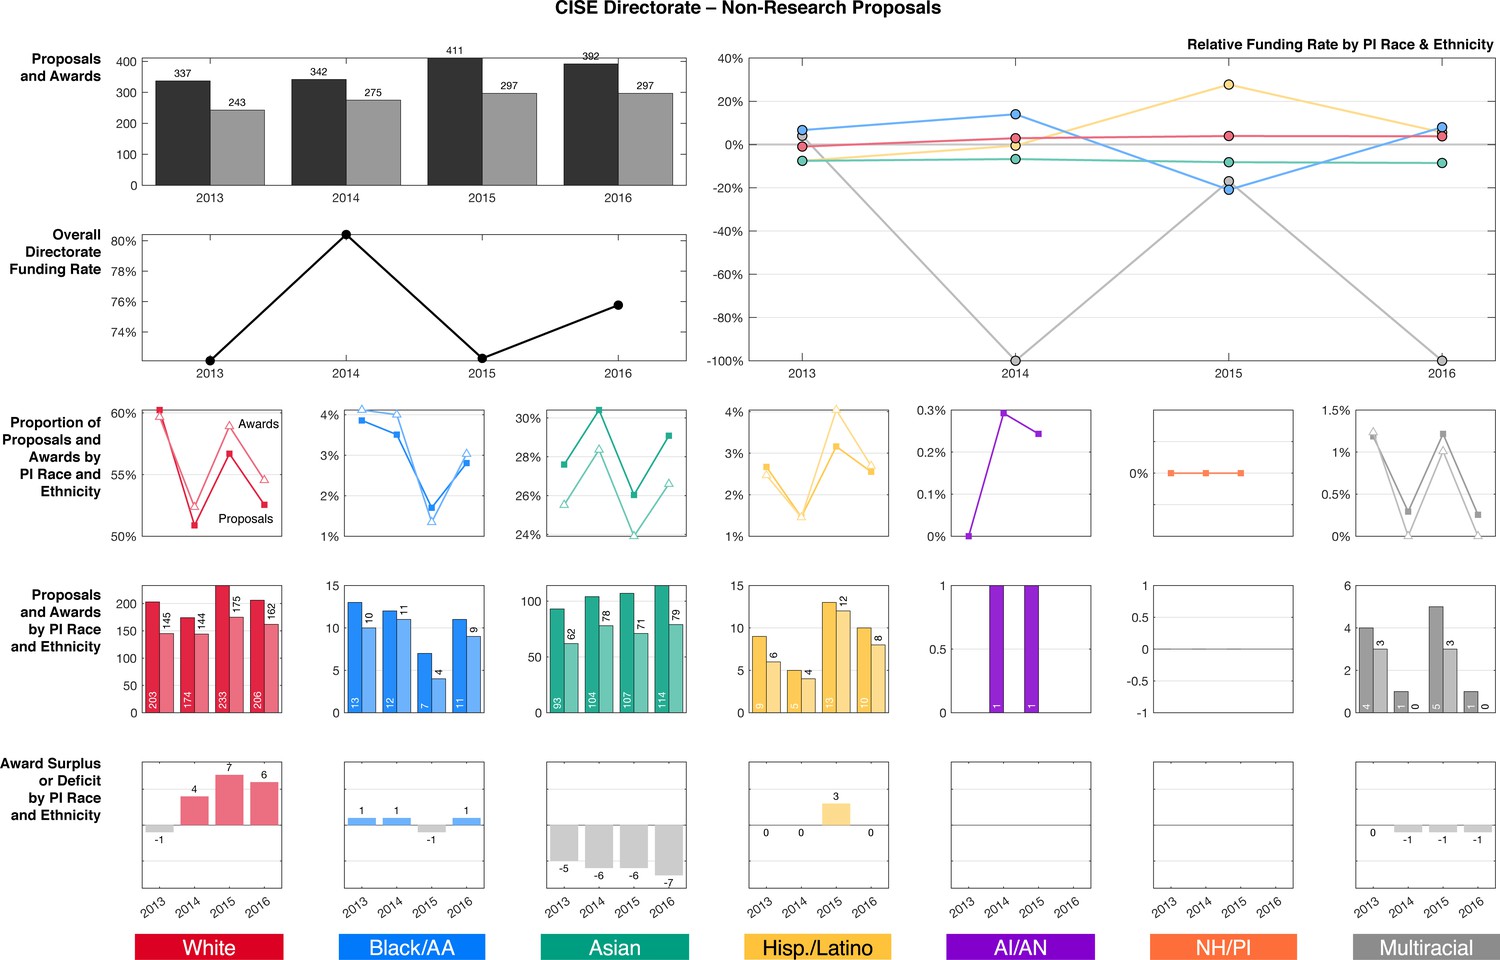
Funding outcomes by PI race and ethnicity for Non-Research proposals in the CISE Directorate, 2012–2016.
Source data: Data S4 in the accompanying data repository (https://doi.org/10.5061/dryad.2fqz612rt).
Figure 4—figure supplement 8
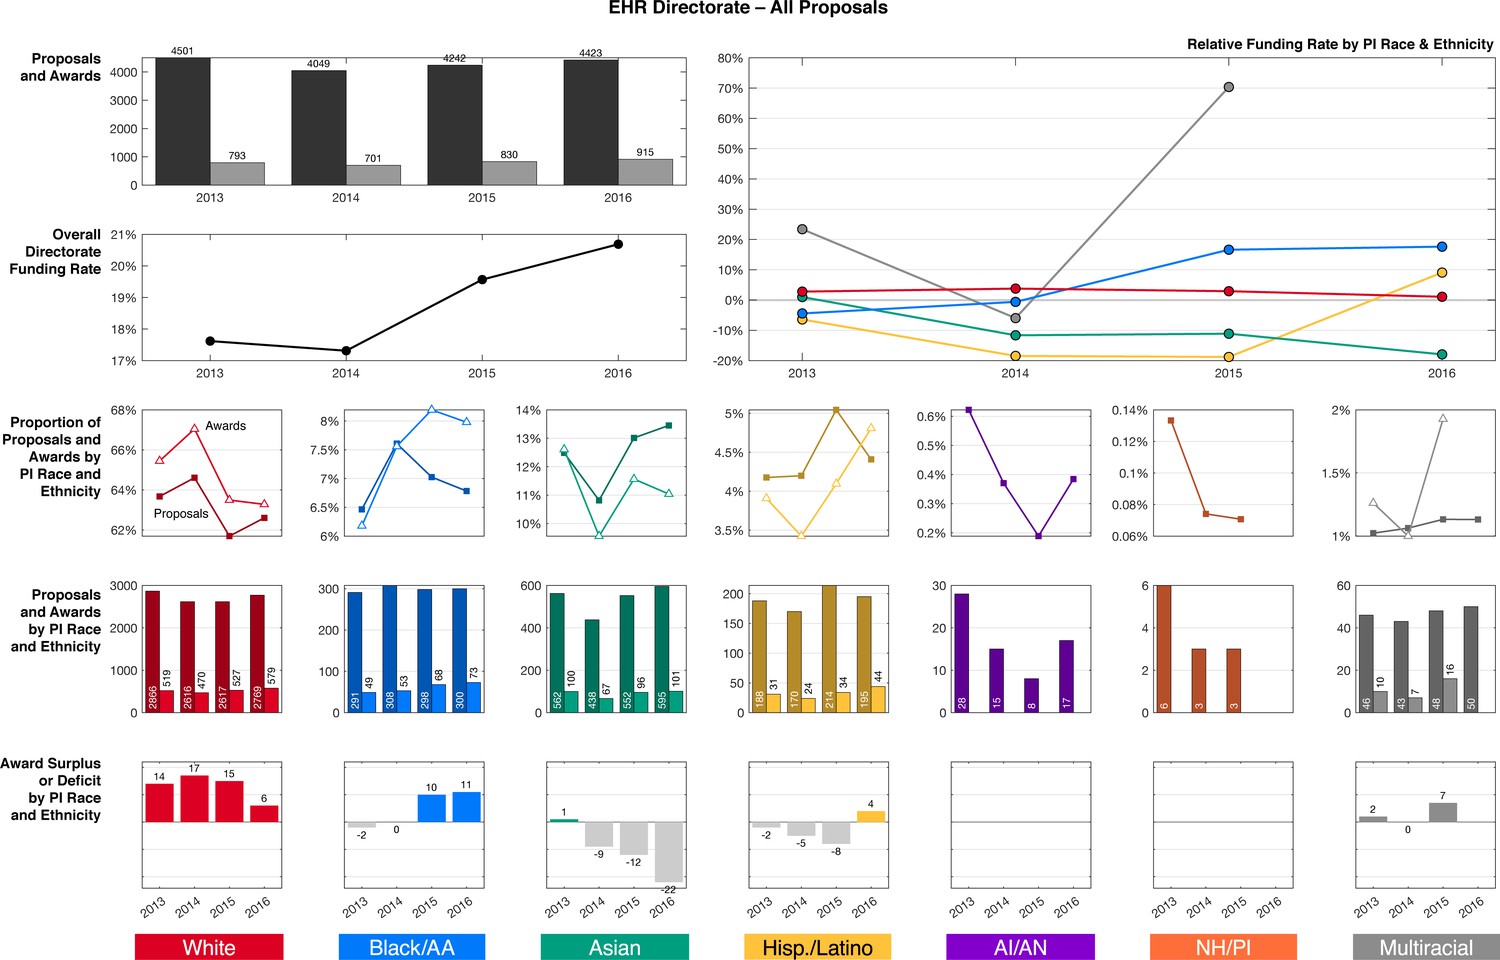
Funding outcomes by PI race and ethnicity for all proposals in the EHR Directorate, 2012–2016.
Source data: Data S4 in the accompanying data repository (https://doi.org/10.5061/dryad.2fqz612rt).
Figure 4—figure supplement 9
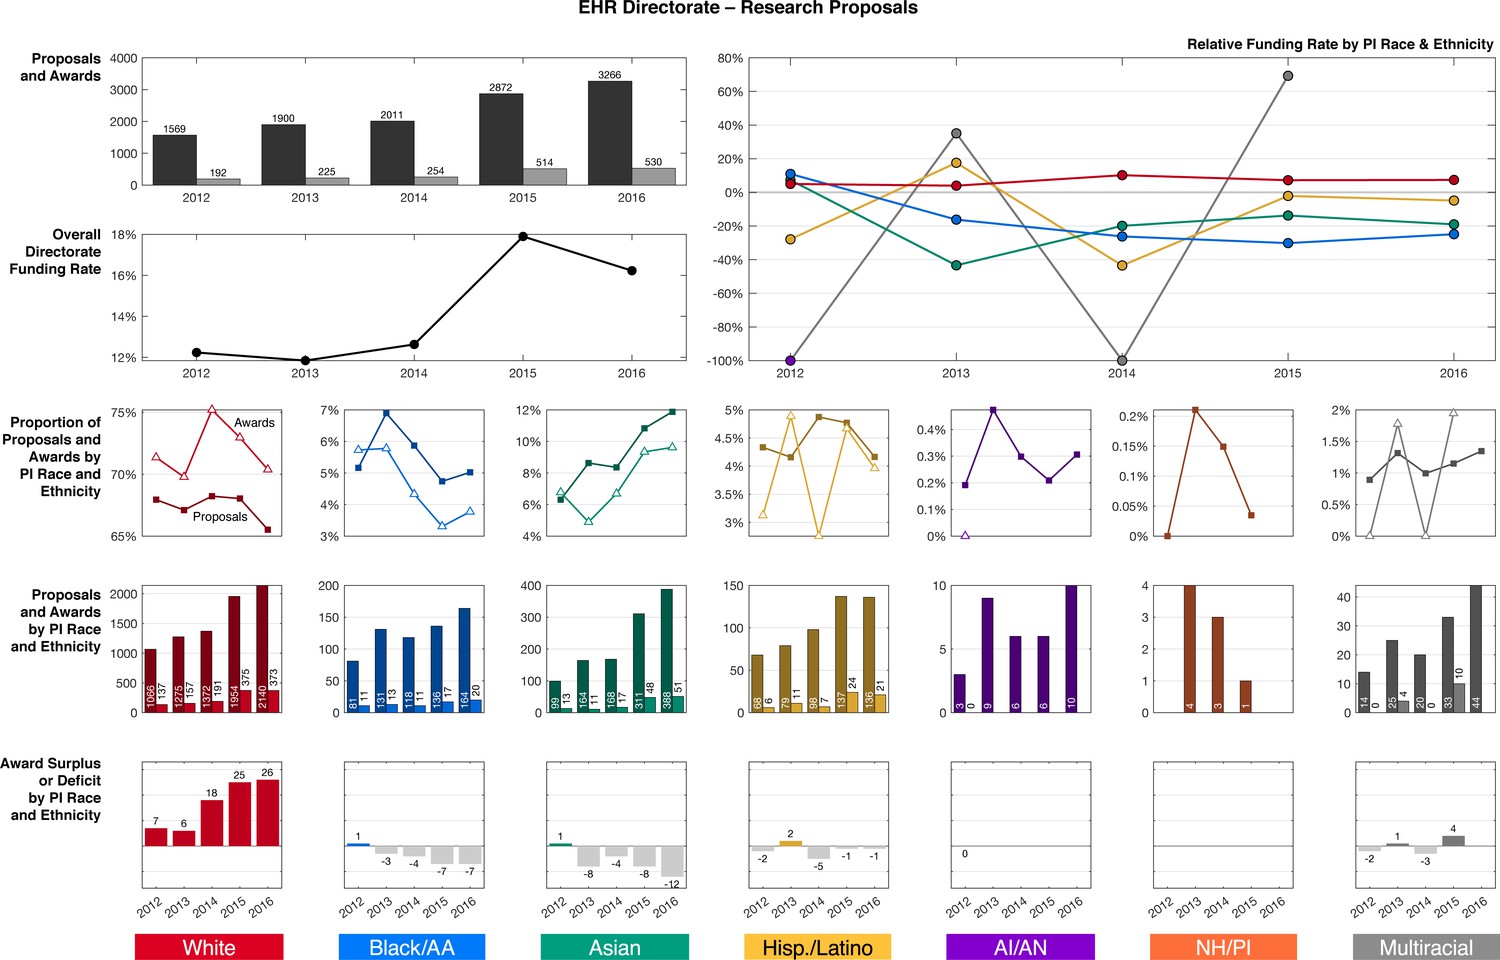
Funding outcomes by PI race and ethnicity for Research proposals in the EHR Directorate, 2012–2016.
Source data: Data S4 in the accompanying data repository (https://doi.org/10.5061/dryad.2fqz612rt).
Figure 4—figure supplement 10
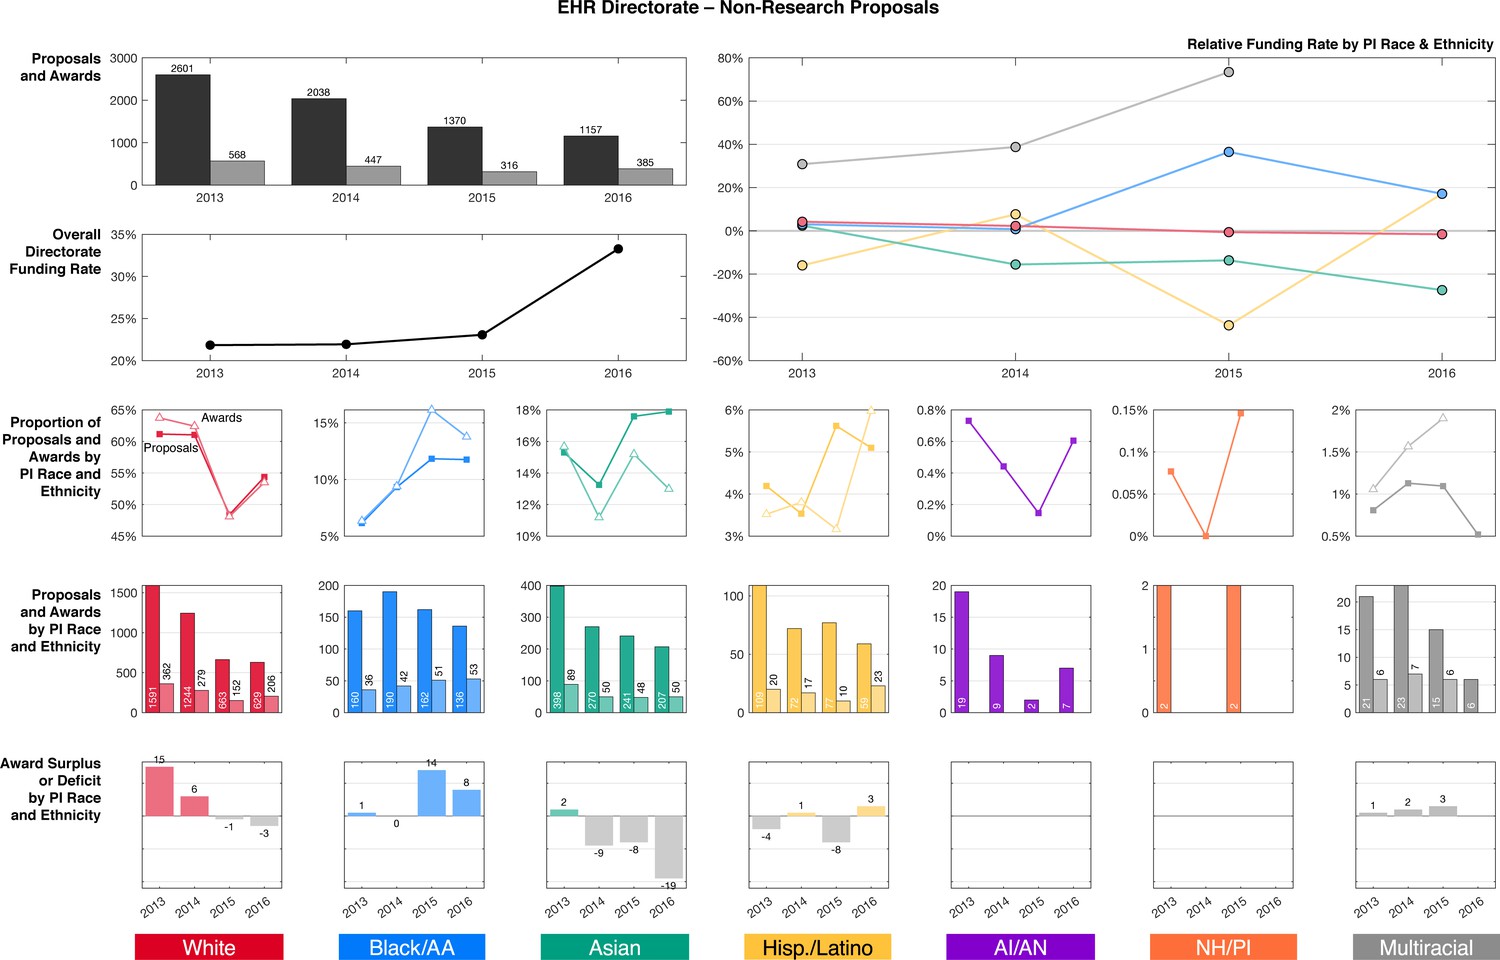
Funding outcomes by PI race and ethnicity for Non-Research proposals in the EHR Directorate, 2012–2016.
Source data: Data S4 in the accompanying data repository (https://doi.org/10.5061/dryad.2fqz612rt).
Figure 4—figure supplement 11

Funding outcomes by PI race and ethnicity for all proposals in the ENG Directorate, 2012–2016.
Source data: Data S4 in the accompanying data repository (https://doi.org/10.5061/dryad.2fqz612rt).
Figure 4—figure supplement 12
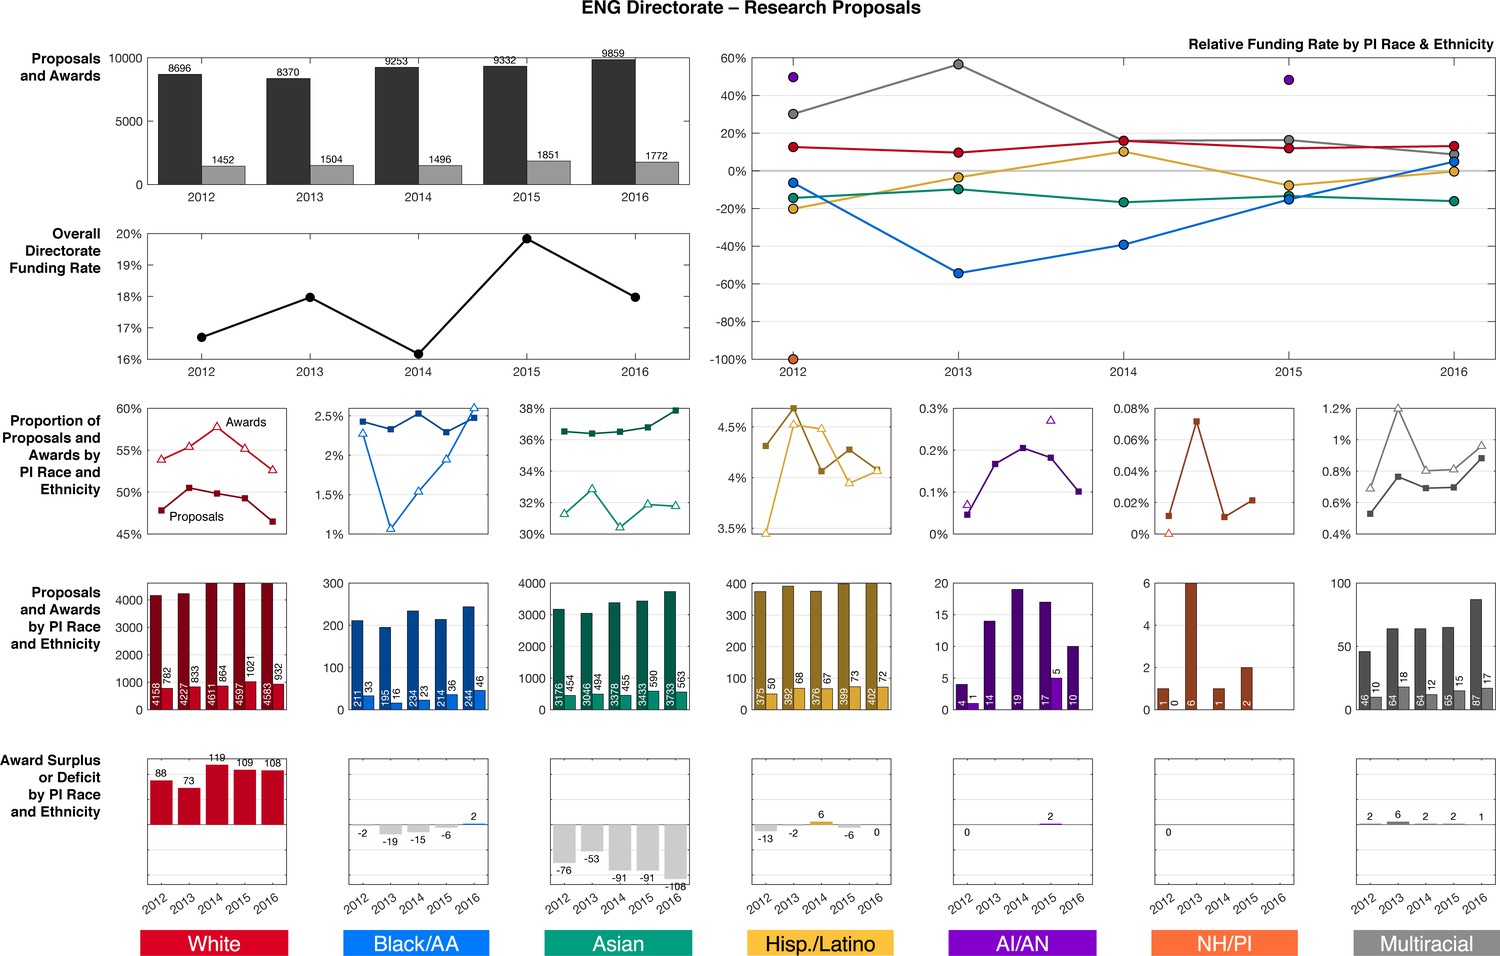
Funding outcomes by PI race and ethnicity for Research proposals in the ENG Directorate, 2012–2016.
Source data: Data S4 in the accompanying data repository (https://doi.org/10.5061/dryad.2fqz612rt).
Figure 4—figure supplement 13
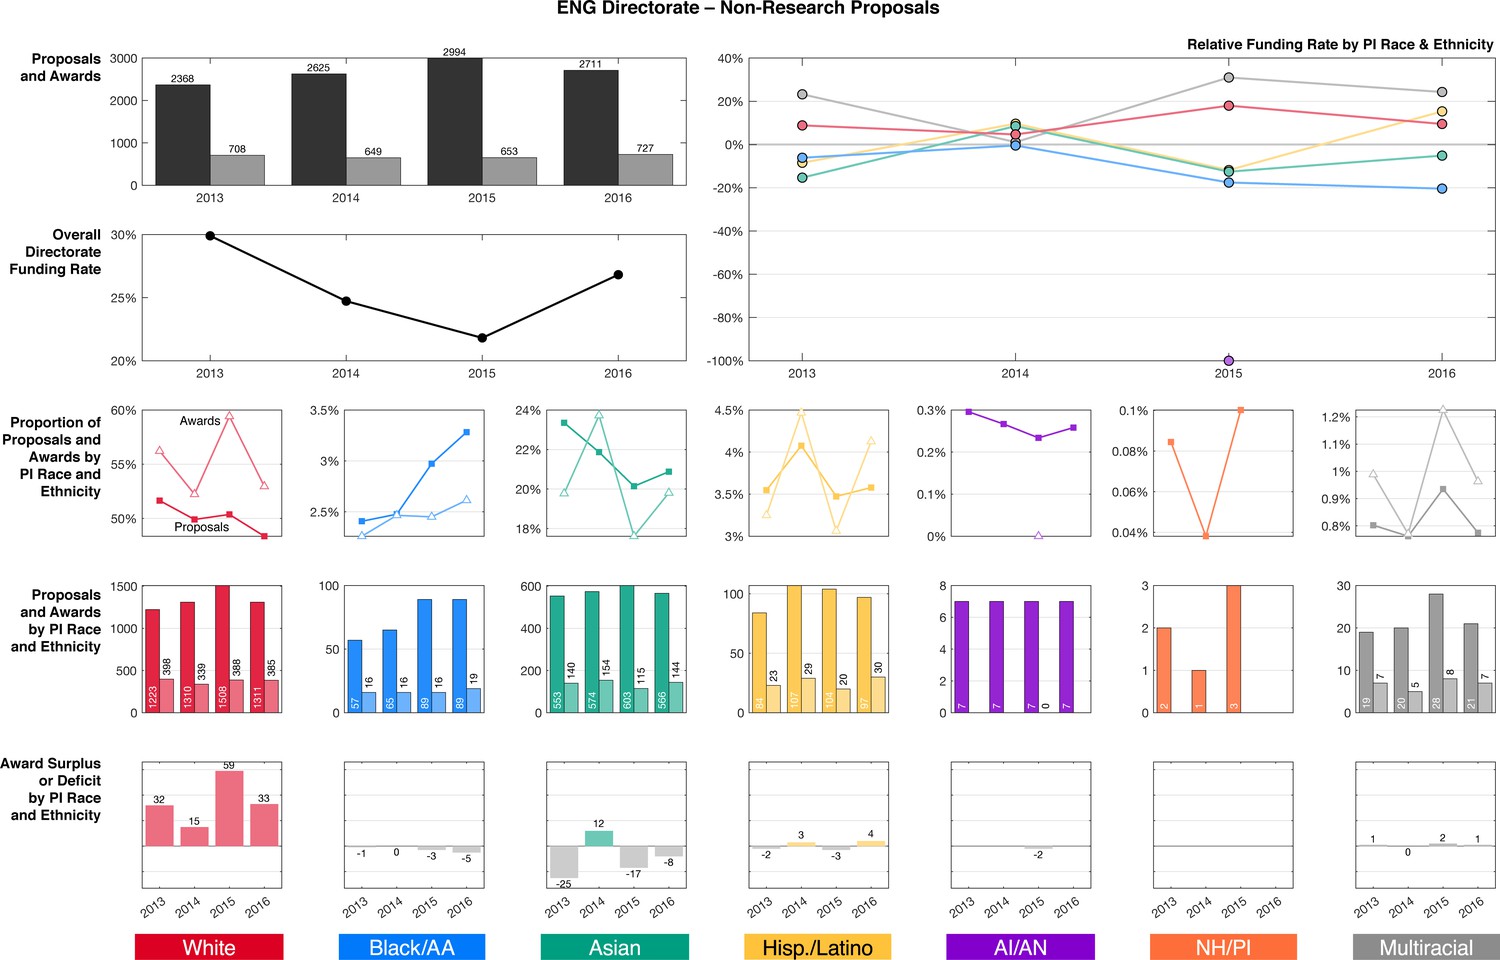
Funding outcomes by PI race and ethnicity for Non-Research proposals in the ENG Directorate, 2012–2016.
Source data: Data S4 in the accompanying data repository (https://doi.org/10.5061/dryad.2fqz612rt).
Figure 4—figure supplement 14
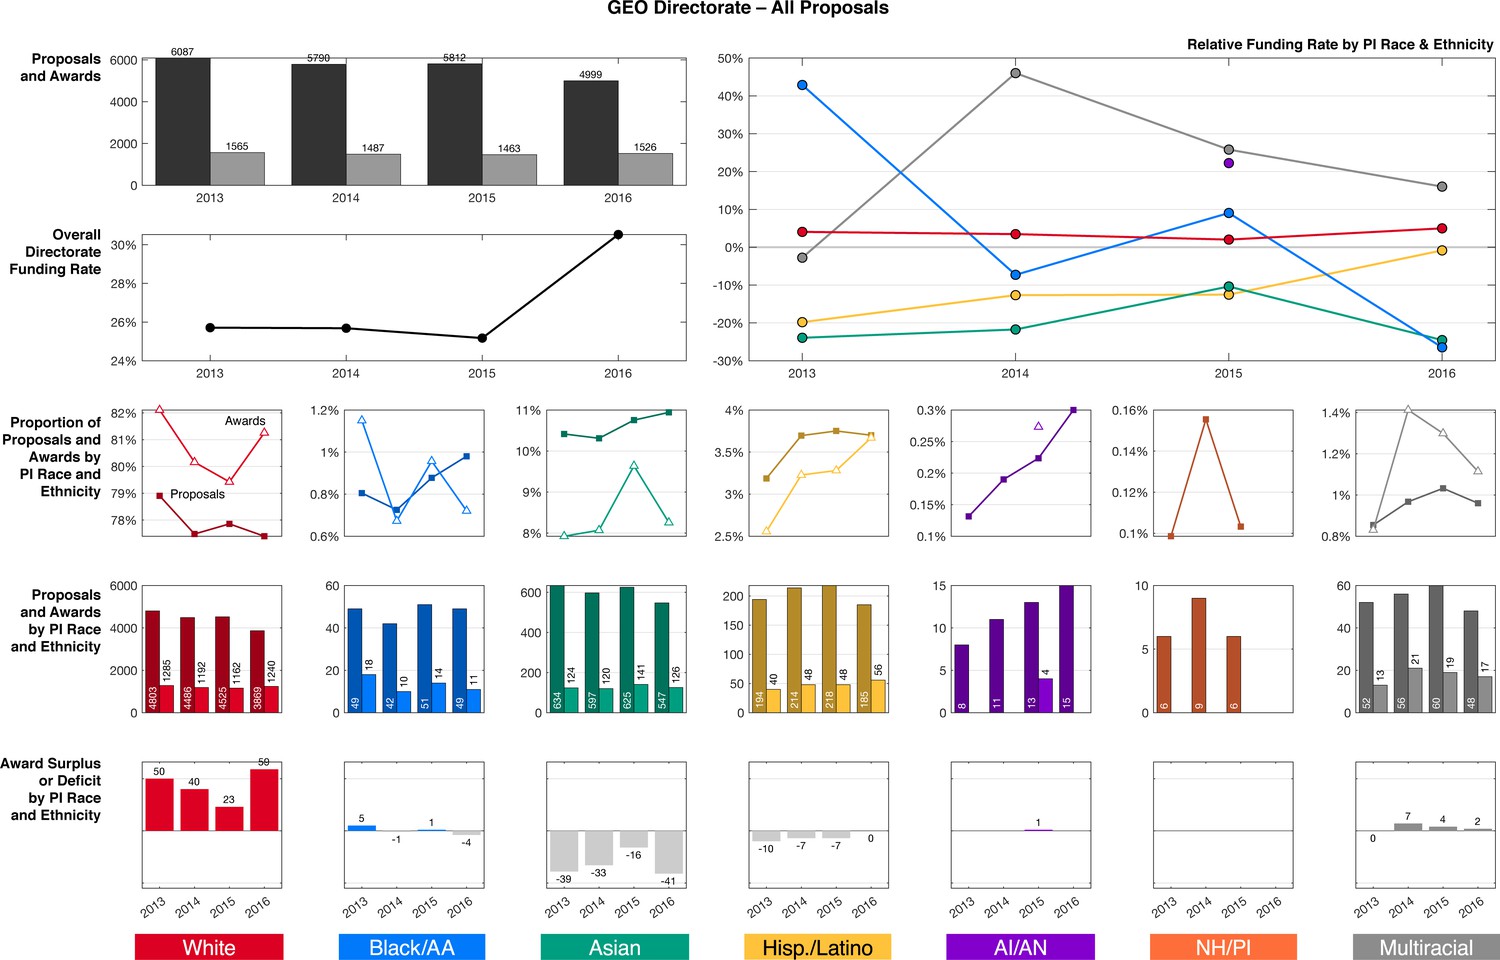
Funding outcomes by PI race and ethnicity for all proposals in the GEO Directorate, 2012–2016.
Source data: Data S4 in the accompanying data repository (https://doi.org/10.5061/dryad.2fqz612rt).
Figure 4—figure supplement 15
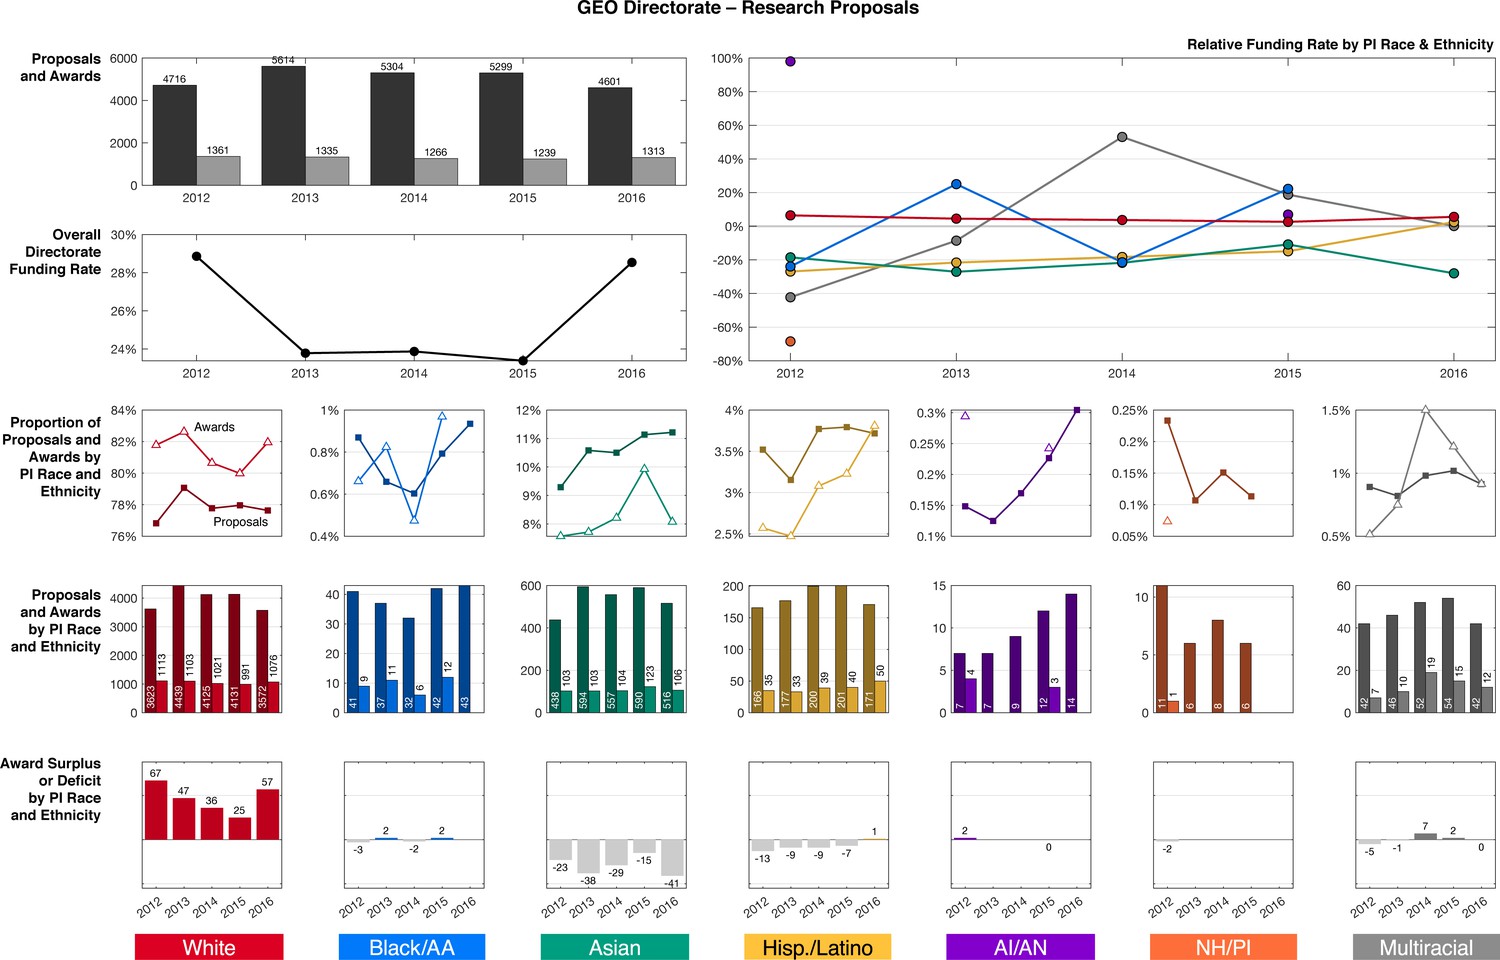
Funding outcomes by PI race and ethnicity for Research proposals in the GEO Directorate, 2012–2016.
Source data: Data S4 in the accompanying data repository (https://doi.org/10.5061/dryad.2fqz612rt).
Figure 4—figure supplement 16
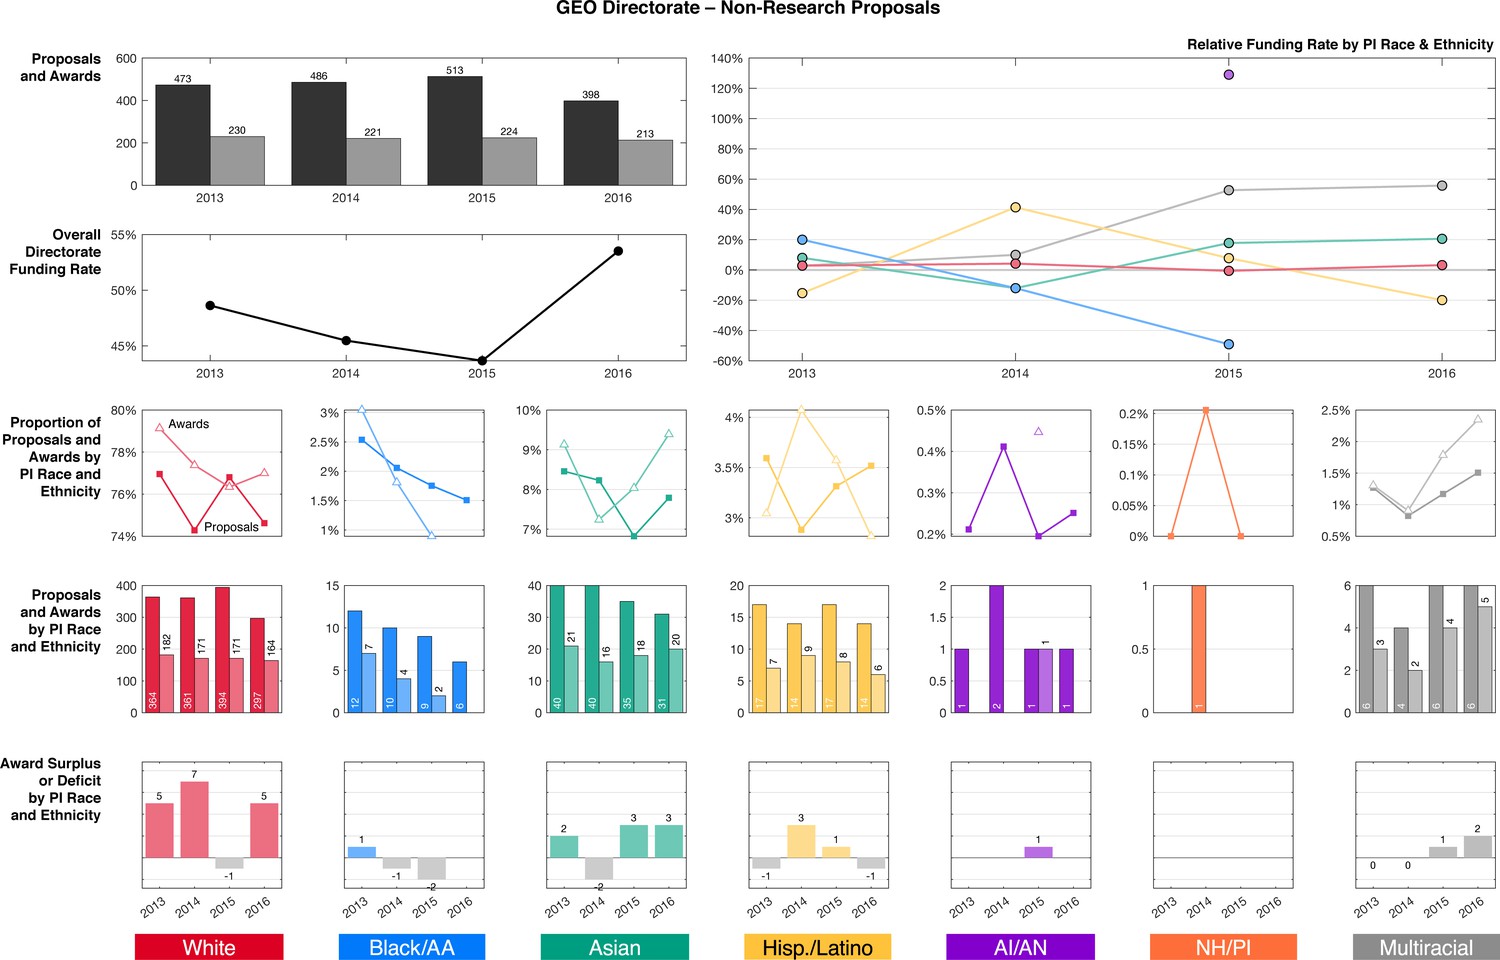
Funding outcomes by PI race and ethnicity for Non-Research proposals in the GEO Directorate, 2012–2016.
Source data: Data S4 in the accompanying data repository (https://doi.org/10.5061/dryad.2fqz612rt).
Figure 4—figure supplement 17
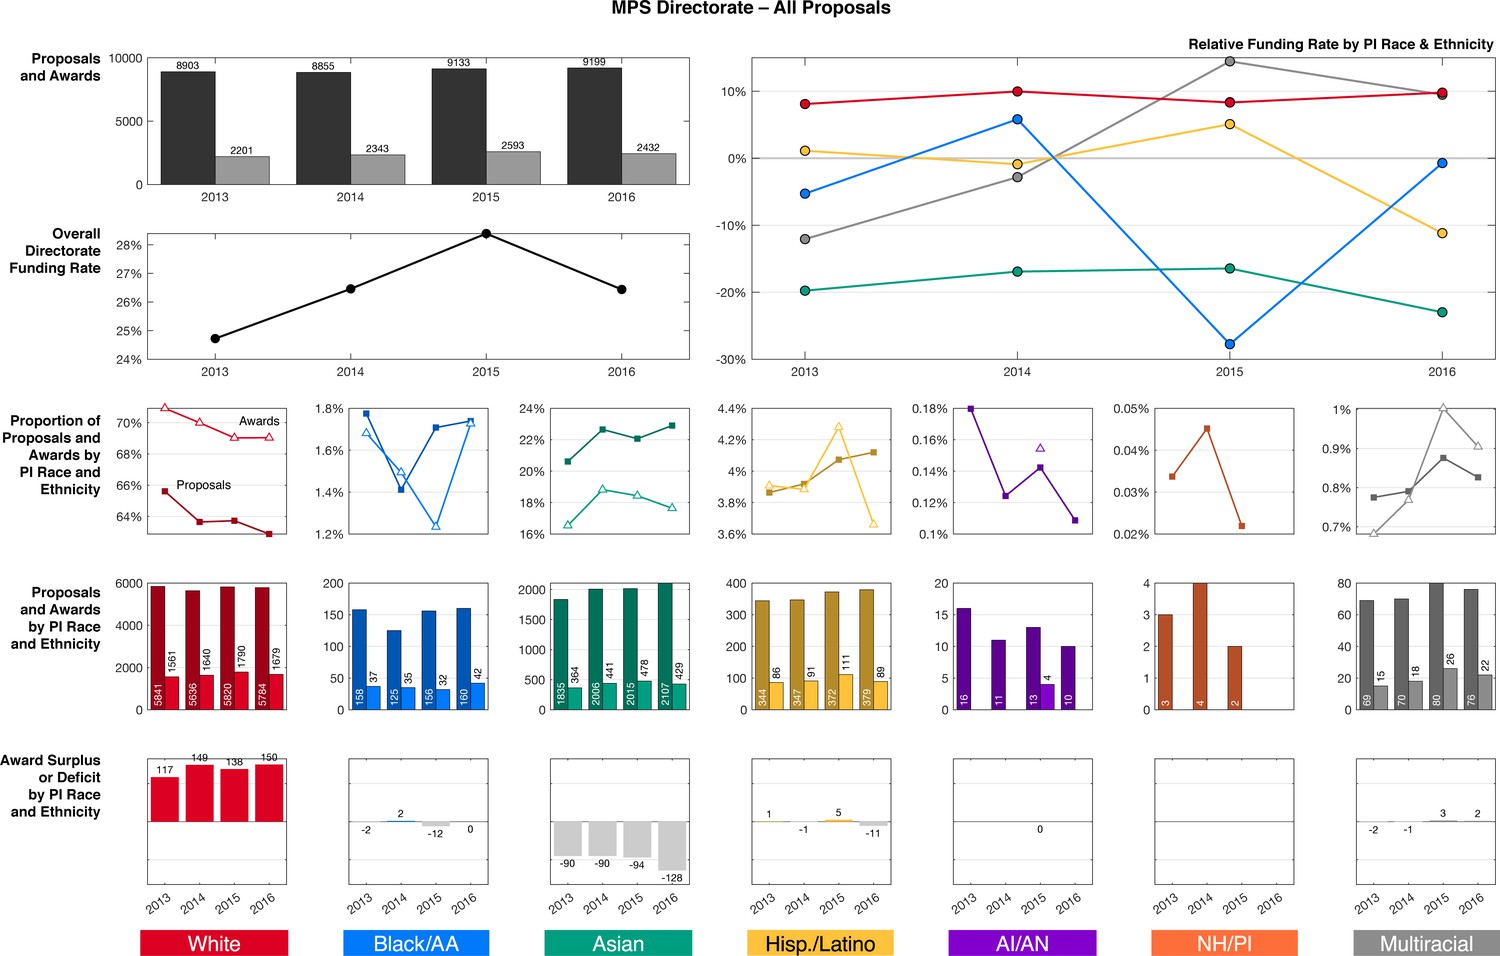
Funding outcomes by PI race and ethnicity for all proposals in the MPS Directorate, 2012–2016.
Source data: Data S4 in the accompanying data repository (https://doi.org/10.5061/dryad.2fqz612rt).
Figure 4—figure supplement 18
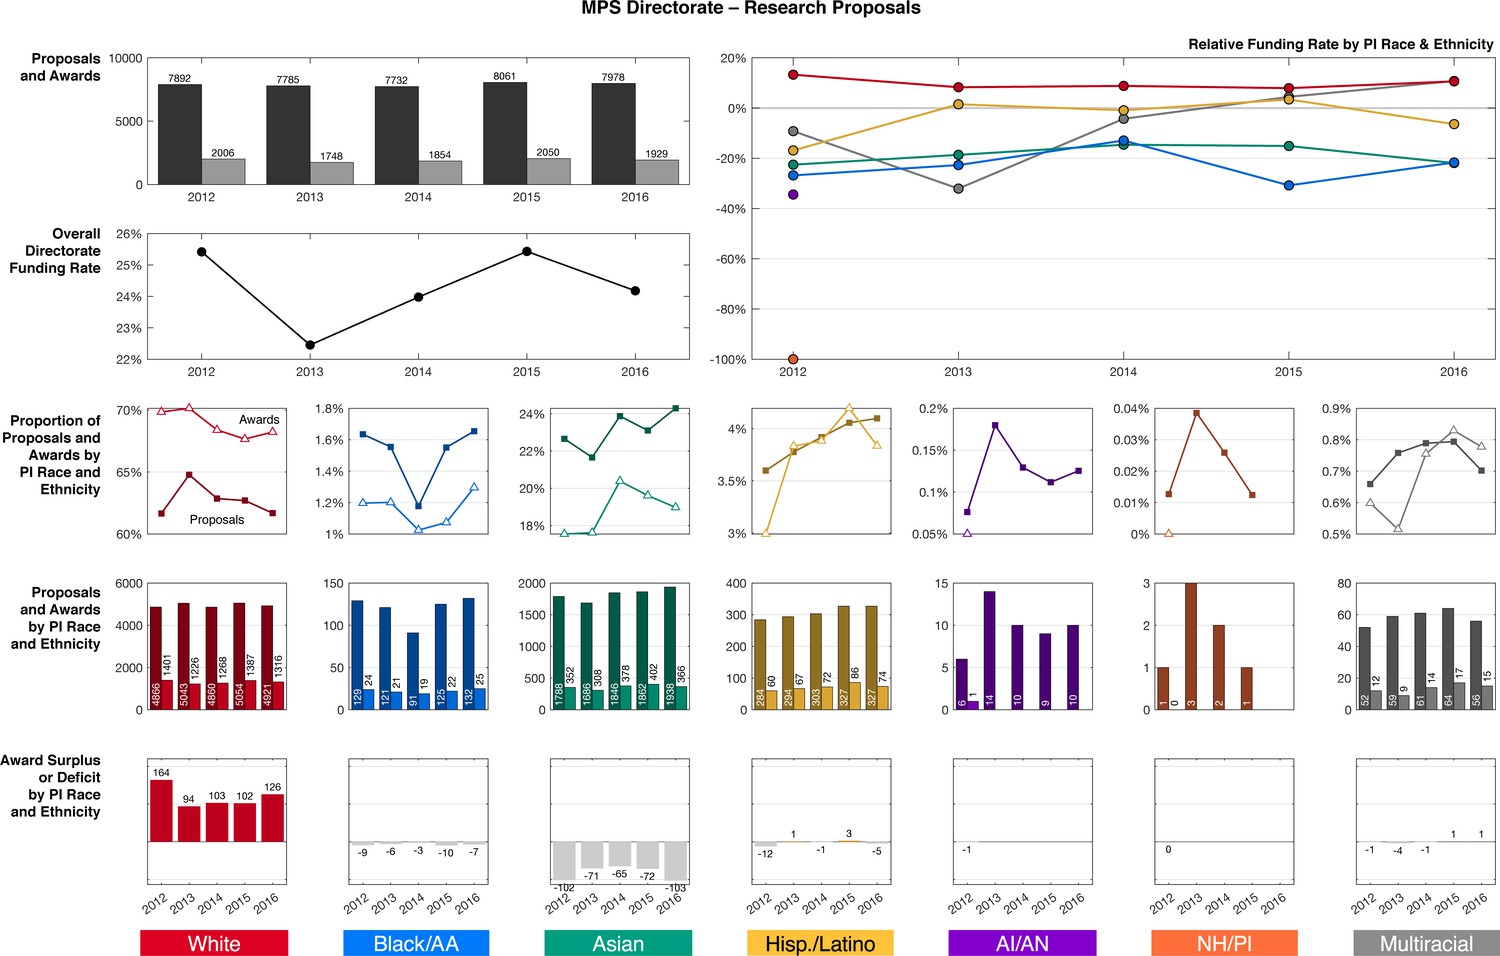
Funding outcomes by PI race and ethnicity for Research proposals in the MPS Directorate, 2012–2016.
Source data: Data S4 in the accompanying data repository (https://doi.org/10.5061/dryad.2fqz612rt).
Figure 4—figure supplement 19
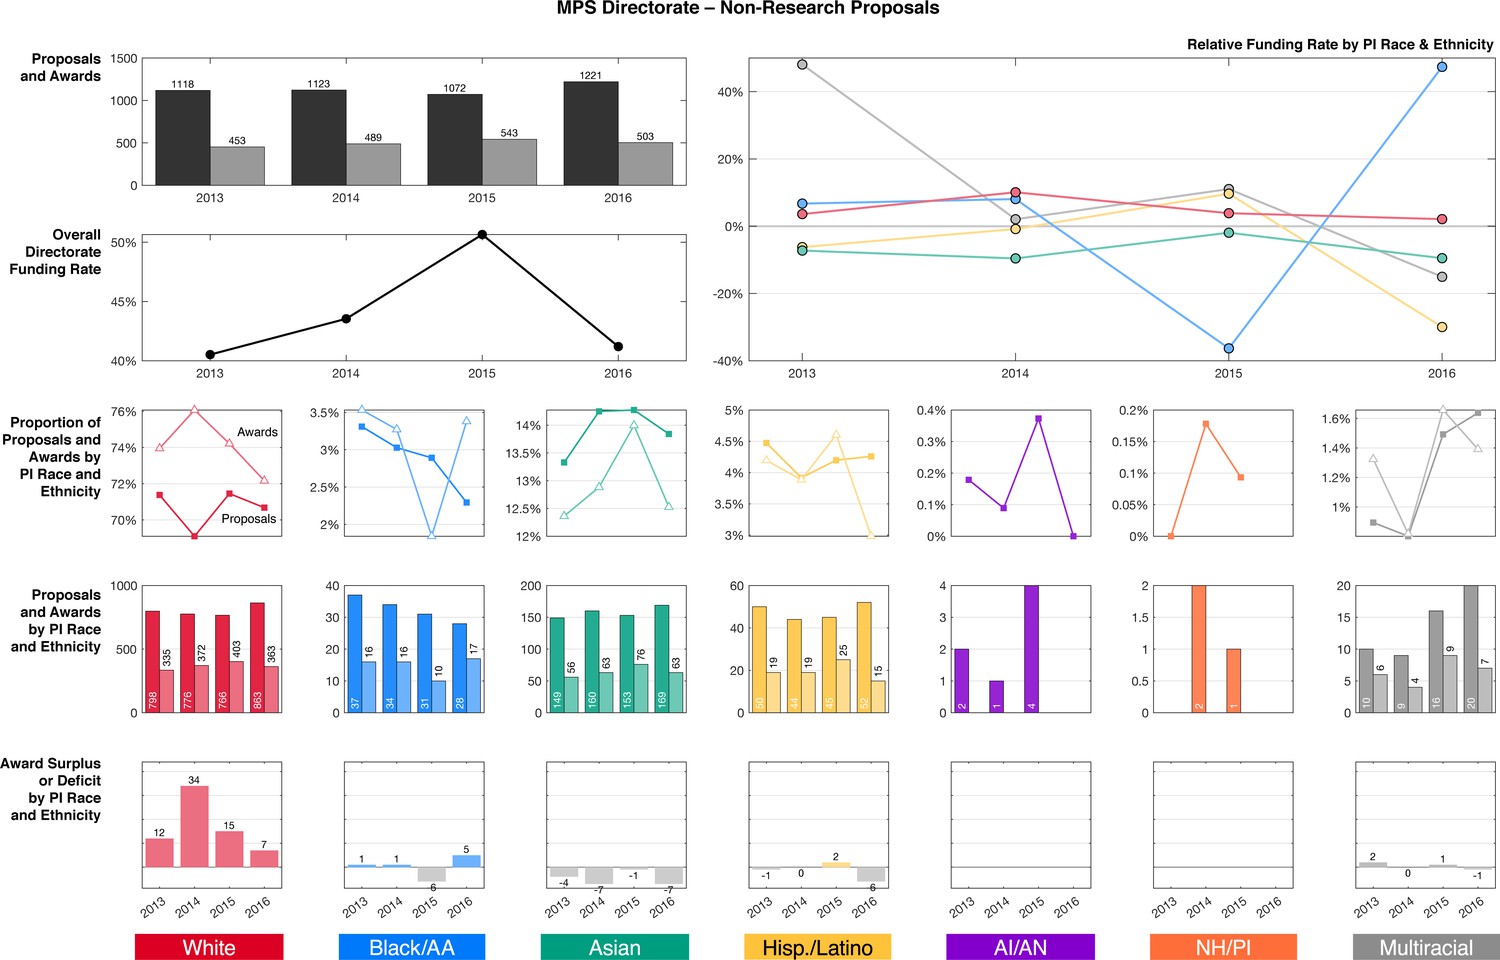
Funding outcomes by PI race and ethnicity for Non-Research proposals in the MPS Directorate, 2012–2016.
Source data: Data S4 in the accompanying data repository (https://doi.org/10.5061/dryad.2fqz612rt).
Figure 4—figure supplement 20
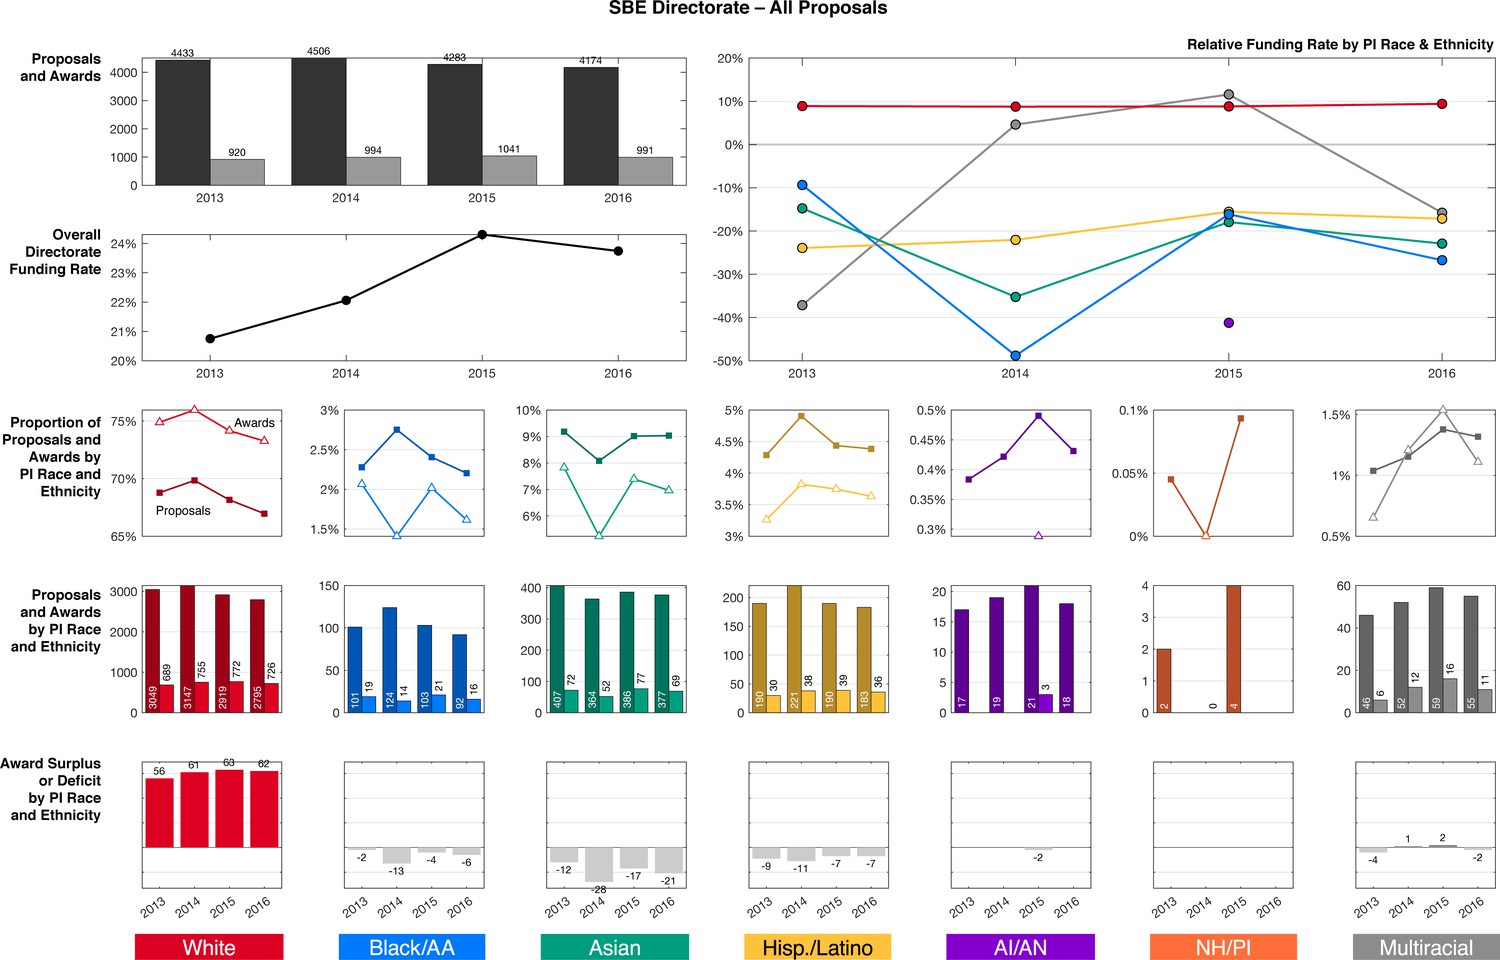
Funding outcomes by PI race and ethnicity for all proposals in the SBE Directorate, 2012–2016.
Source data: Data S4 in the accompanying data repository (https://doi.org/10.5061/dryad.2fqz612rt).
Figure 4—figure supplement 21
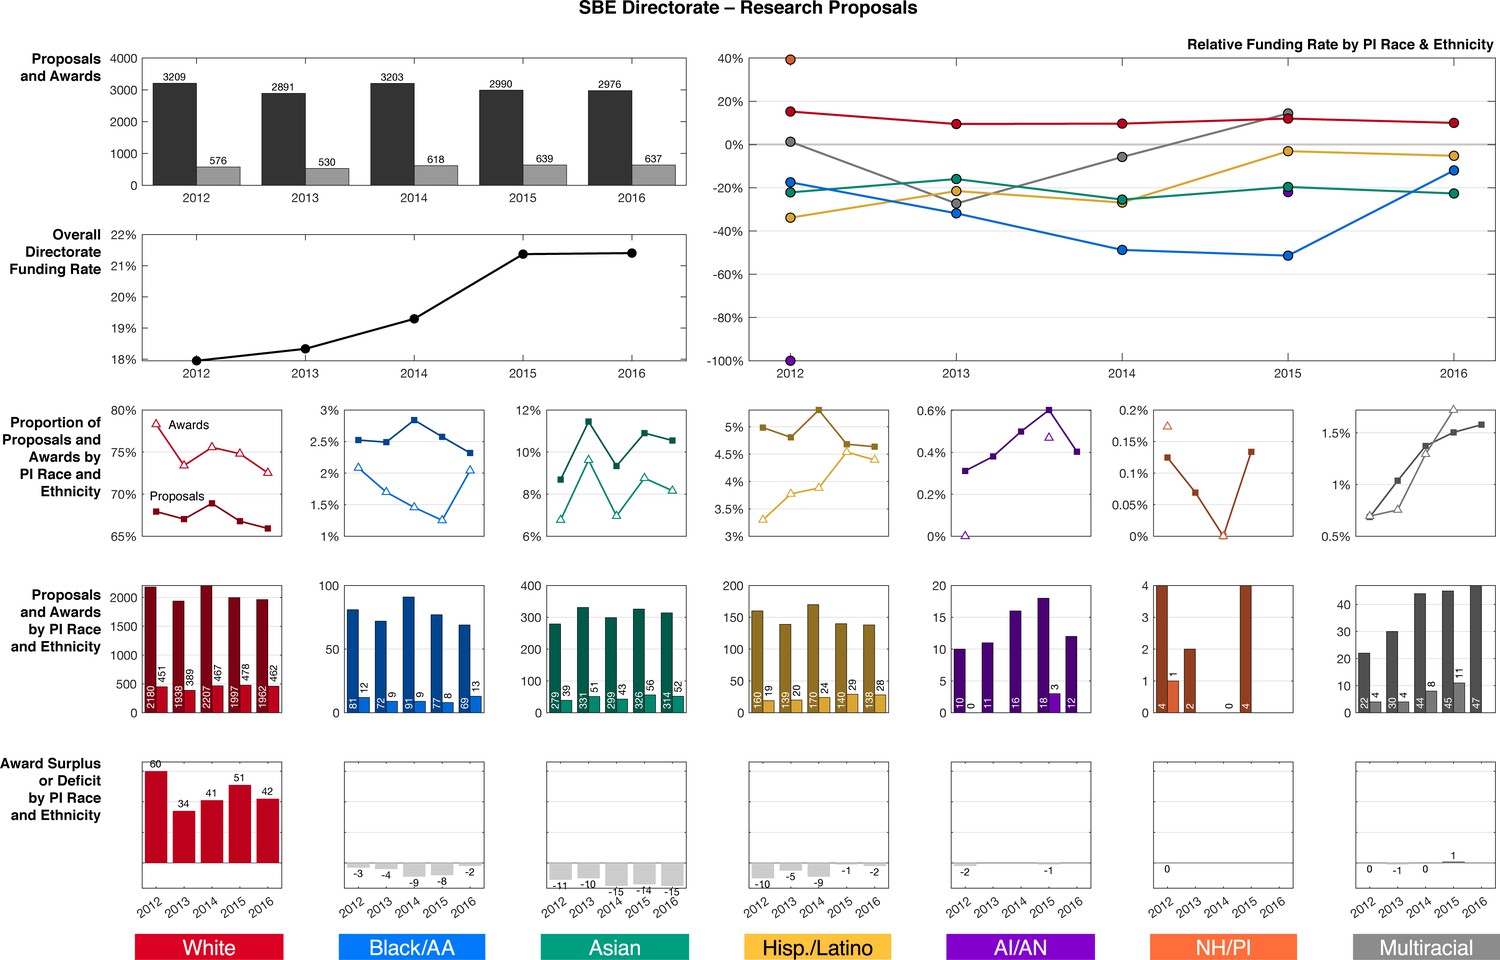
Funding outcomes by PI race and ethnicity for Research proposals in the SBE Directorate, 2012–2016.
Source data: Data S4 in the accompanying data repository (https://doi.org/10.5061/dryad.2fqz612rt).
Figure 4—figure supplement 22
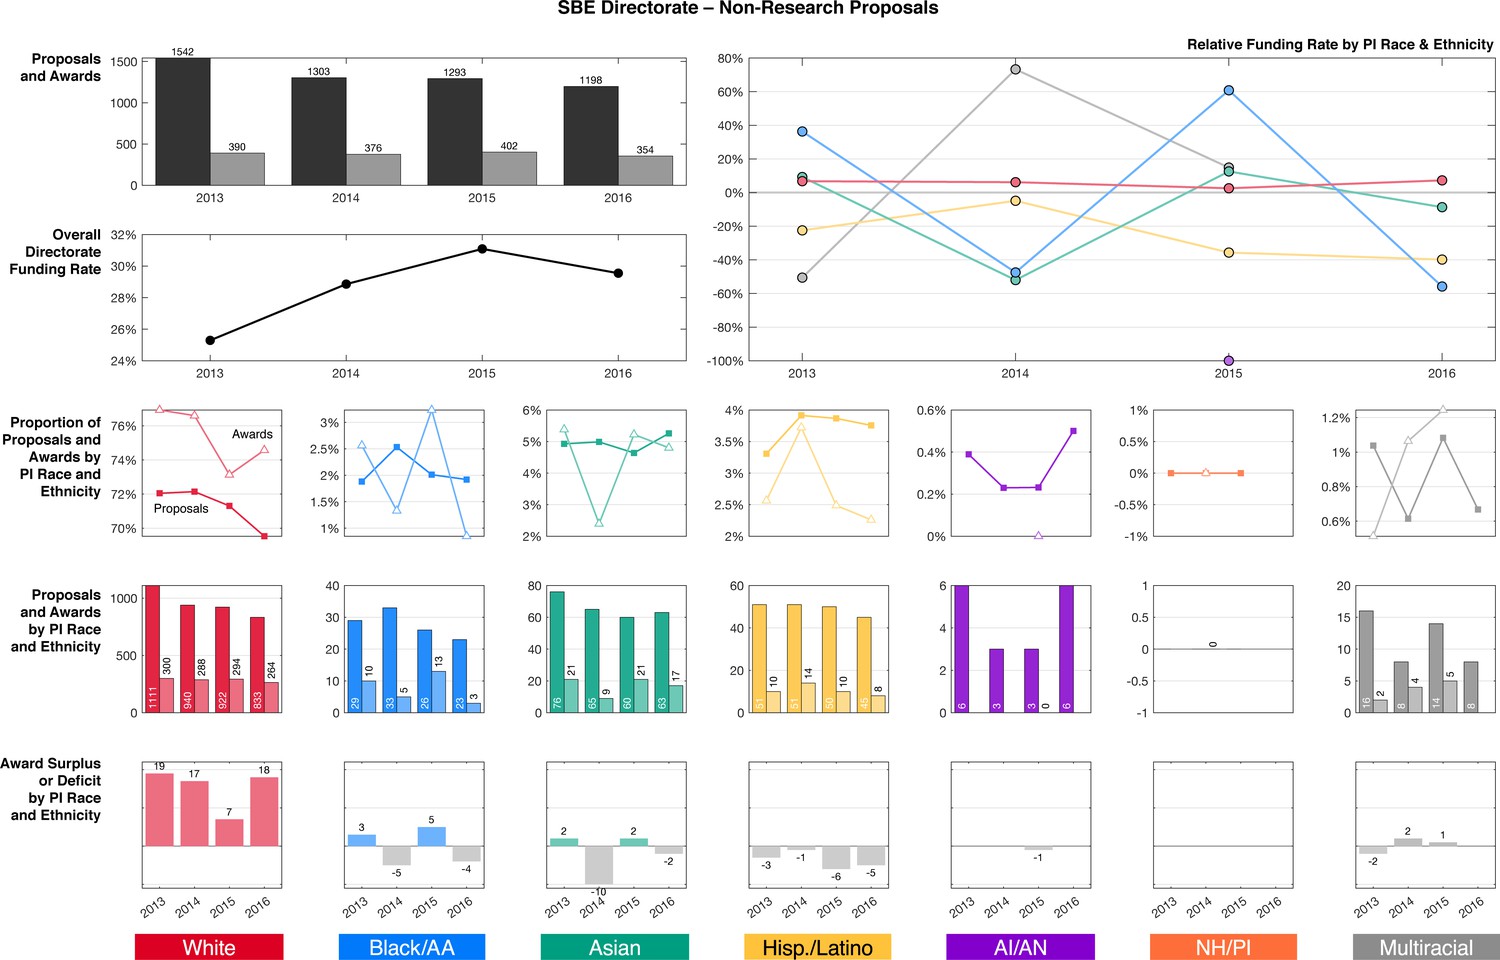
Funding outcomes by PI race and ethnicity for Non-Research proposals in the SBE Directorate, 2012–2016.
Source data: Data S4 in the accompanying data repository (https://doi.org/10.5061/dryad.2fqz612rt).
Figure 5
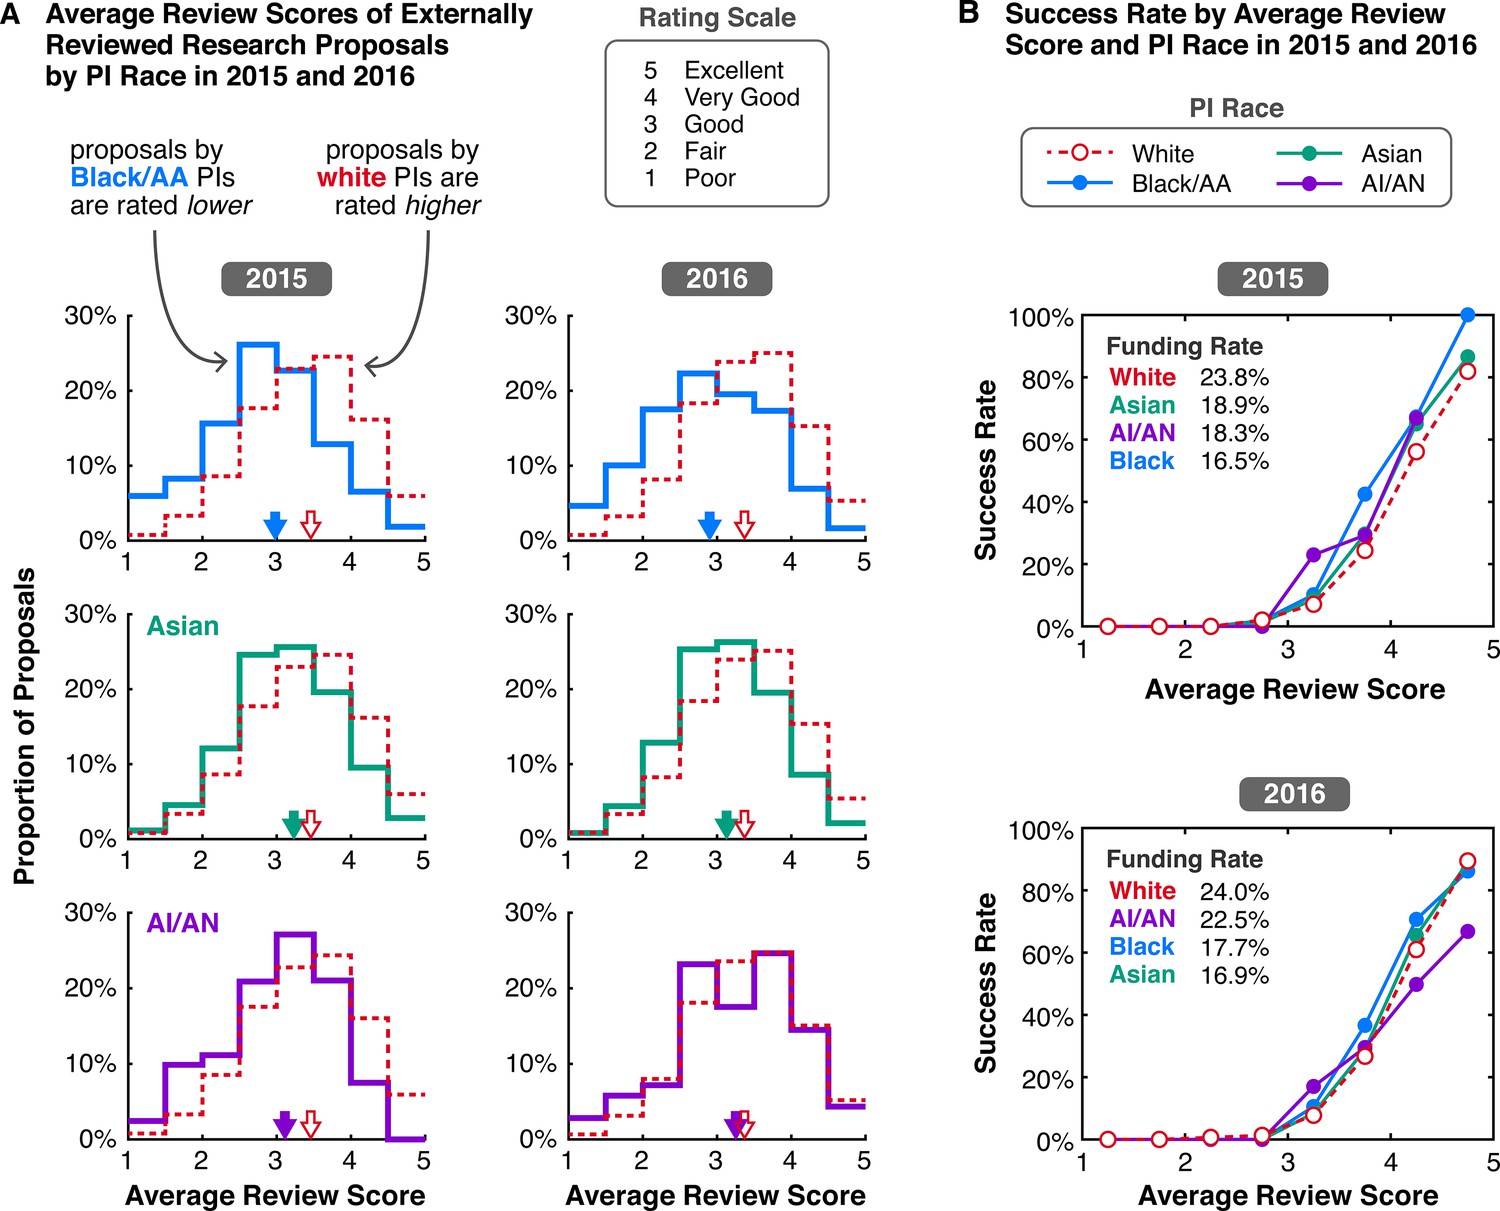
In 2015 and 2016, the distributions of average external review scores of externally reviewed Research proposals were systematically offset and skewed based on PI race.
(A) White (red dashed), Black/AA (blue), Asian (green), and AI/AN (purple) PIs, for 2015 (left column) and 2016 (right column). Proposals are rated on a scale from 1 (Poor) to 5 (Excellent). The grand average of all average review scores for proposals by white PIs (red-outlined arrows) is higher than the grand averages of review scores for proposals by Black/AA, Asian, and AI/AN PIs (solid-colored arrows). (B) Funding rates of externally reviewed Research proposals by average review score and PI race. For context, the funding rate of all Research proposals by group is listed from highest to lowest in the top left corner. Data on review scores and funding rates by average score are only available for 2015 and 2016. Source data: Data S5 in the accompanying data repository (https://doi.org/10.5061/dryad.2fqz612rt).
Figure 6 with 7 supplements

The decline in the proportion of proposals by PIs who identified their race has accelerated in recent years.
Source data: Data for 1999–2019 are collated in Data S1 in the accompanying data repository (https://doi.org/10.5061/dryad.2fqz612rt); data for the year 2020 are available from the 2020 NSF report on the Merit Review Process (National Science Board, 2021a).
Figure 6—figure supplement 1
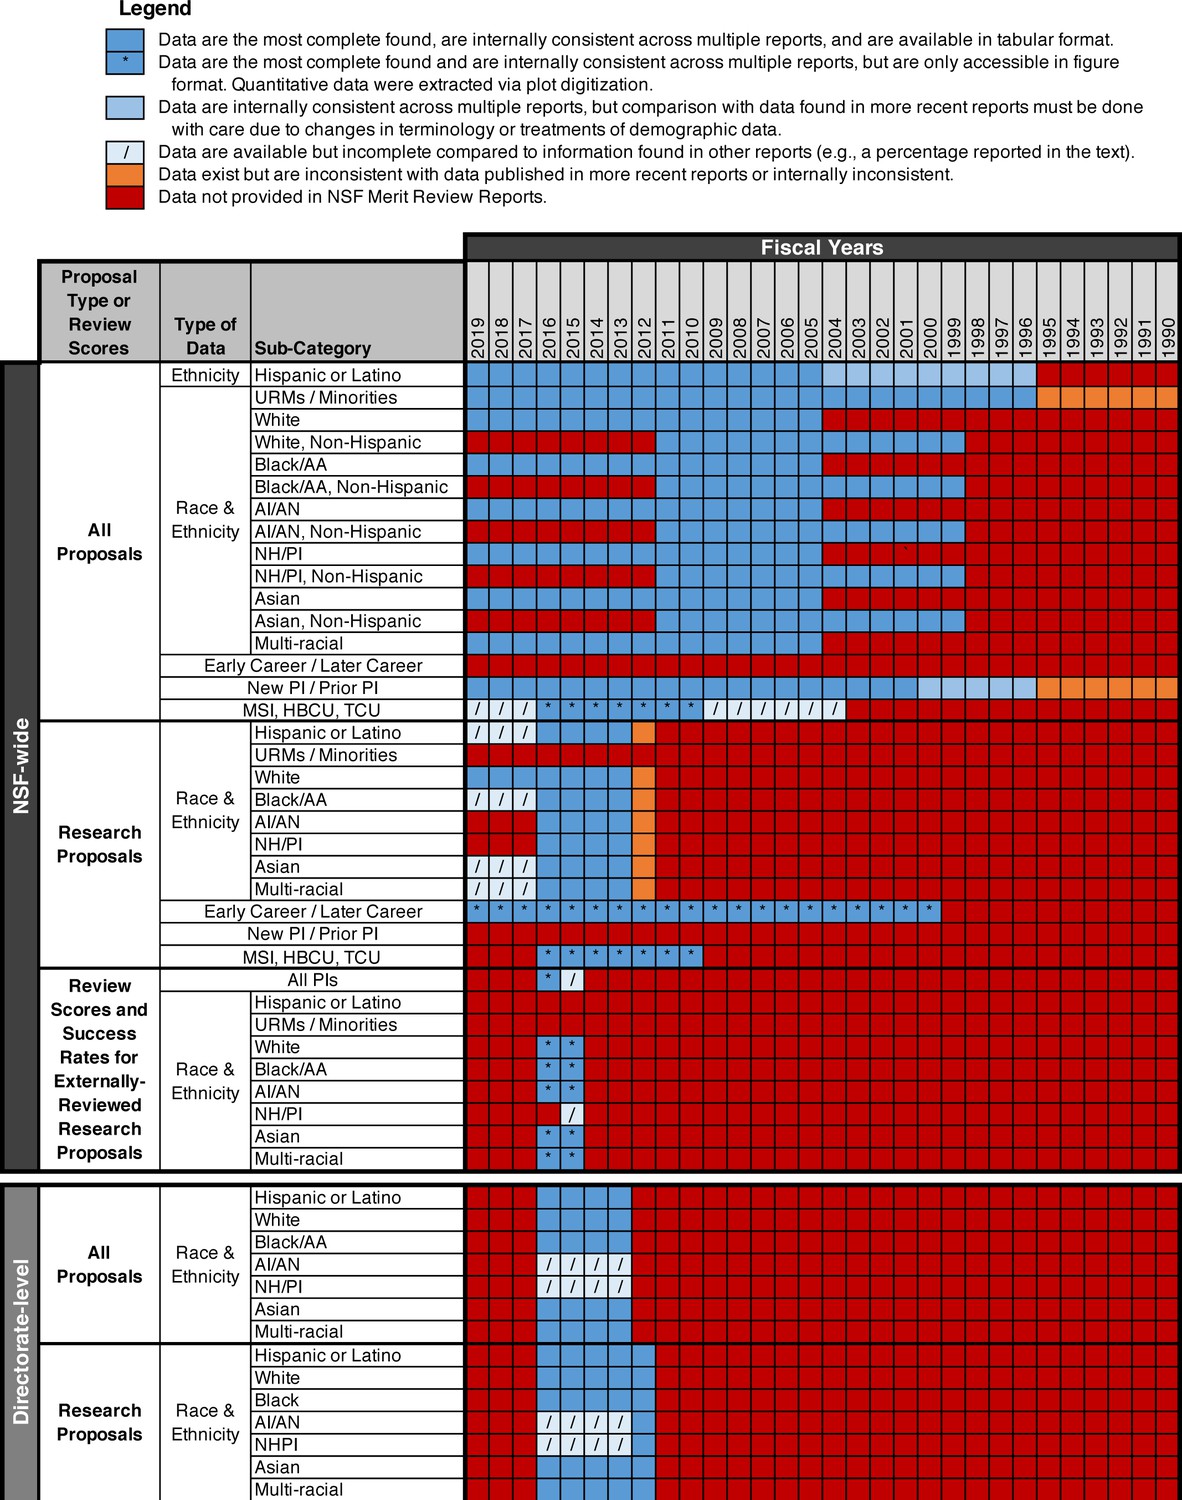
Availability of data on funding outcomes by PI race and ethnicity and other demographic characteristics in NSF merit review reports, 1990–2019.
Data are organized by organizational level (NSF-wide or directorate-level) and then by proposal and activity type (all proposals, Research proposals, and external review scores and success rates). Information reported within the datasets available from NSF include Ethnicity (exclusive of race), Race and Ethnicity, Early Career and Later Career PIs, New and Prior PIs, and PIs from minority serving institutions, historically black colleges and universities, and tribal colleges and universities (MSIs, HBCUs, TCUs). Data collated from merit review reports are available in the accompanying data repository (https://doi.org/10.5061/dryad.2fqz612rt).
Figure 6—figure supplement 2
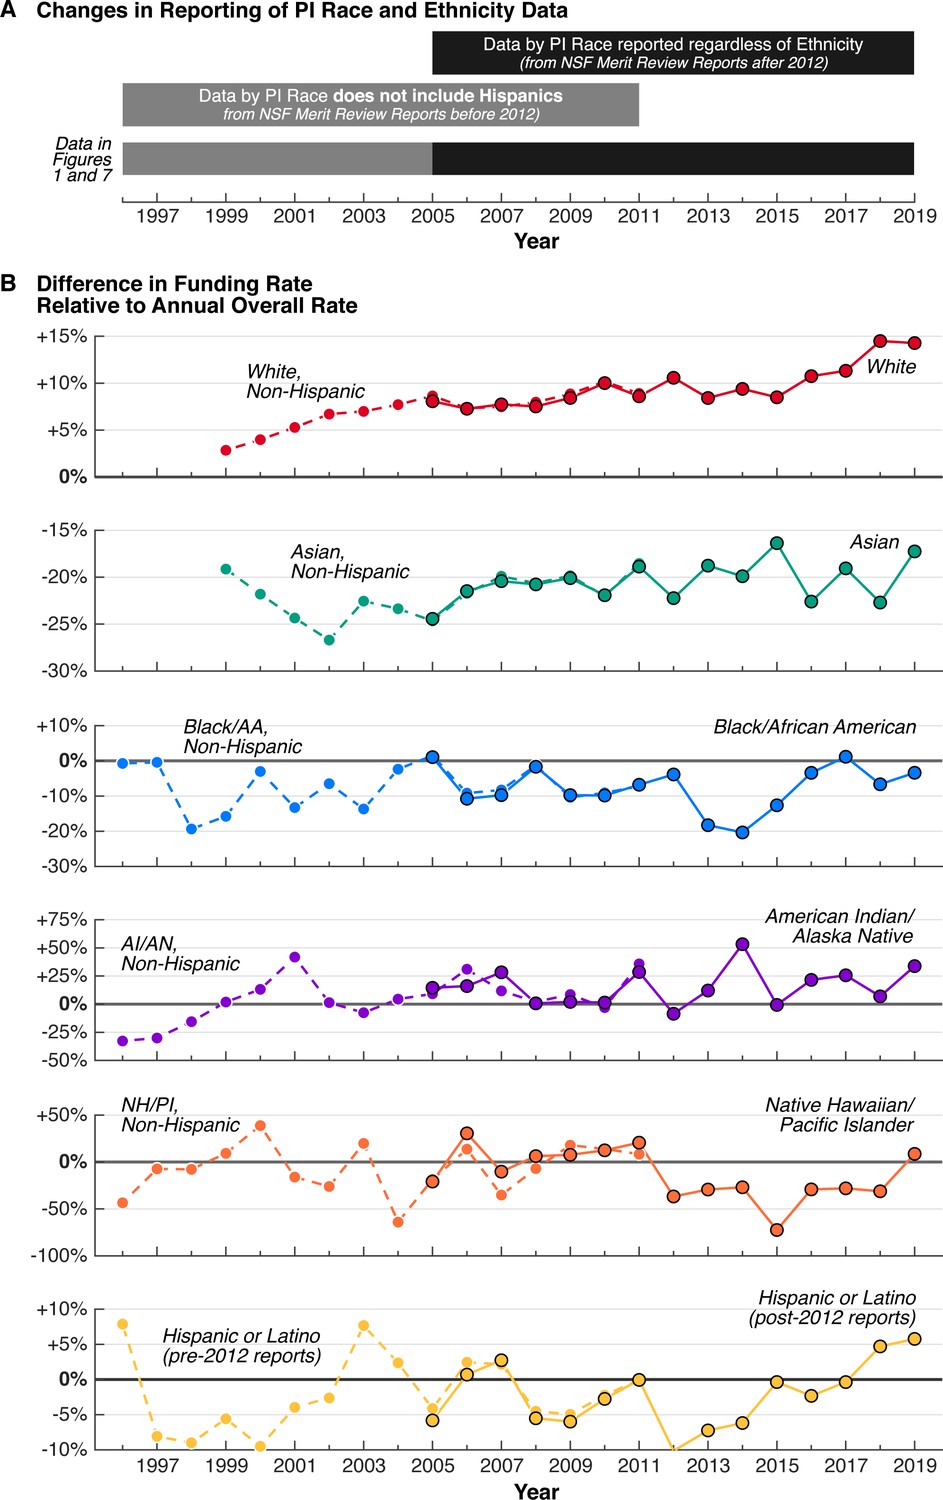
The impact of changes in the tabulation of PI race and ethnicity data on relative funding rates, 1996–2019.
(A) Graphical representation of the time spans pertaining to the two ways NSF reported race and ethnicity data in the NSF Merit Review Reports, before and after 2012. (B) Comparison of the two datasets in terms of relative funding rates by PI race and ethnicity. The solid line with markers outlined in black represents data from 2005–2019 (Merit Review Reports after and including 2012) where individuals self-identifying as a particular race are included regardless of their ethnicity (Non-Hispanic, Hispanic, or Unknown). The dashed line with solid colored markers represents data from 1996–2011 where individuals are only included in a particular race category if they are Non-Hispanic. Source data: Data S1 in the accompanying data repository (https://doi.org/10.5061/dryad.2fqz612rt).
Figure 6—figure supplement 3
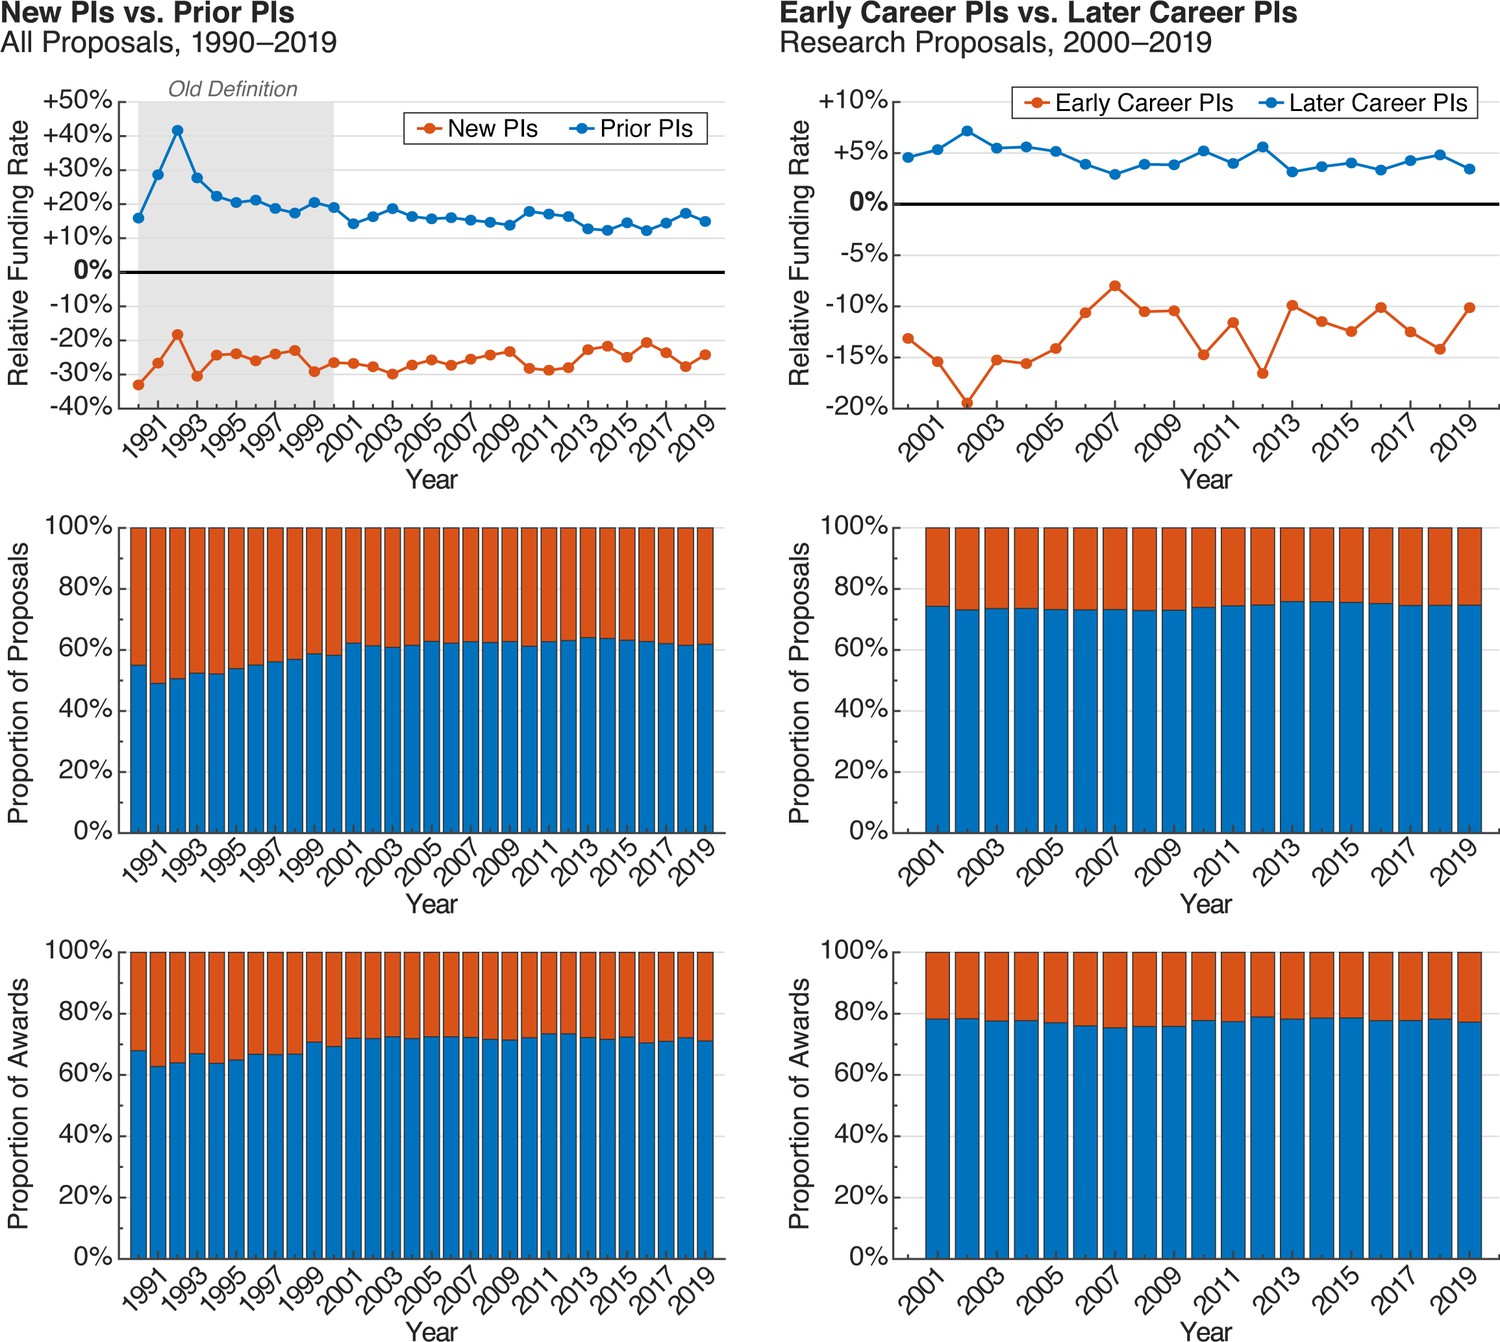
Proposals, awards, and relative funding rates for New PIs versus Prior PIs (1990–2019) and Early Career PIs versus Later Career PIs (2000–2019).
(Left column) NSF currently defines a New PI is an individual who has not served as the PI or Co-PI on any award from NSF (with the exception of doctoral dissertation awards, graduate or post-doctoral fellowships, research planning grants, or conferences, symposia and workshop grants). The old definition for a New PI, which is applicable to data shown for 1990–2000,, is any individual who had not previously been a PI on any NSF award. (Right column) NSF defines an Early Career PI as an individual within seven years of receiving their last degree at the time of the award. Source data: Data S9 in the accompanying data repository (https://doi.org/10.5061/dryad.2fqz612rt).
Figure 6—figure supplement 4
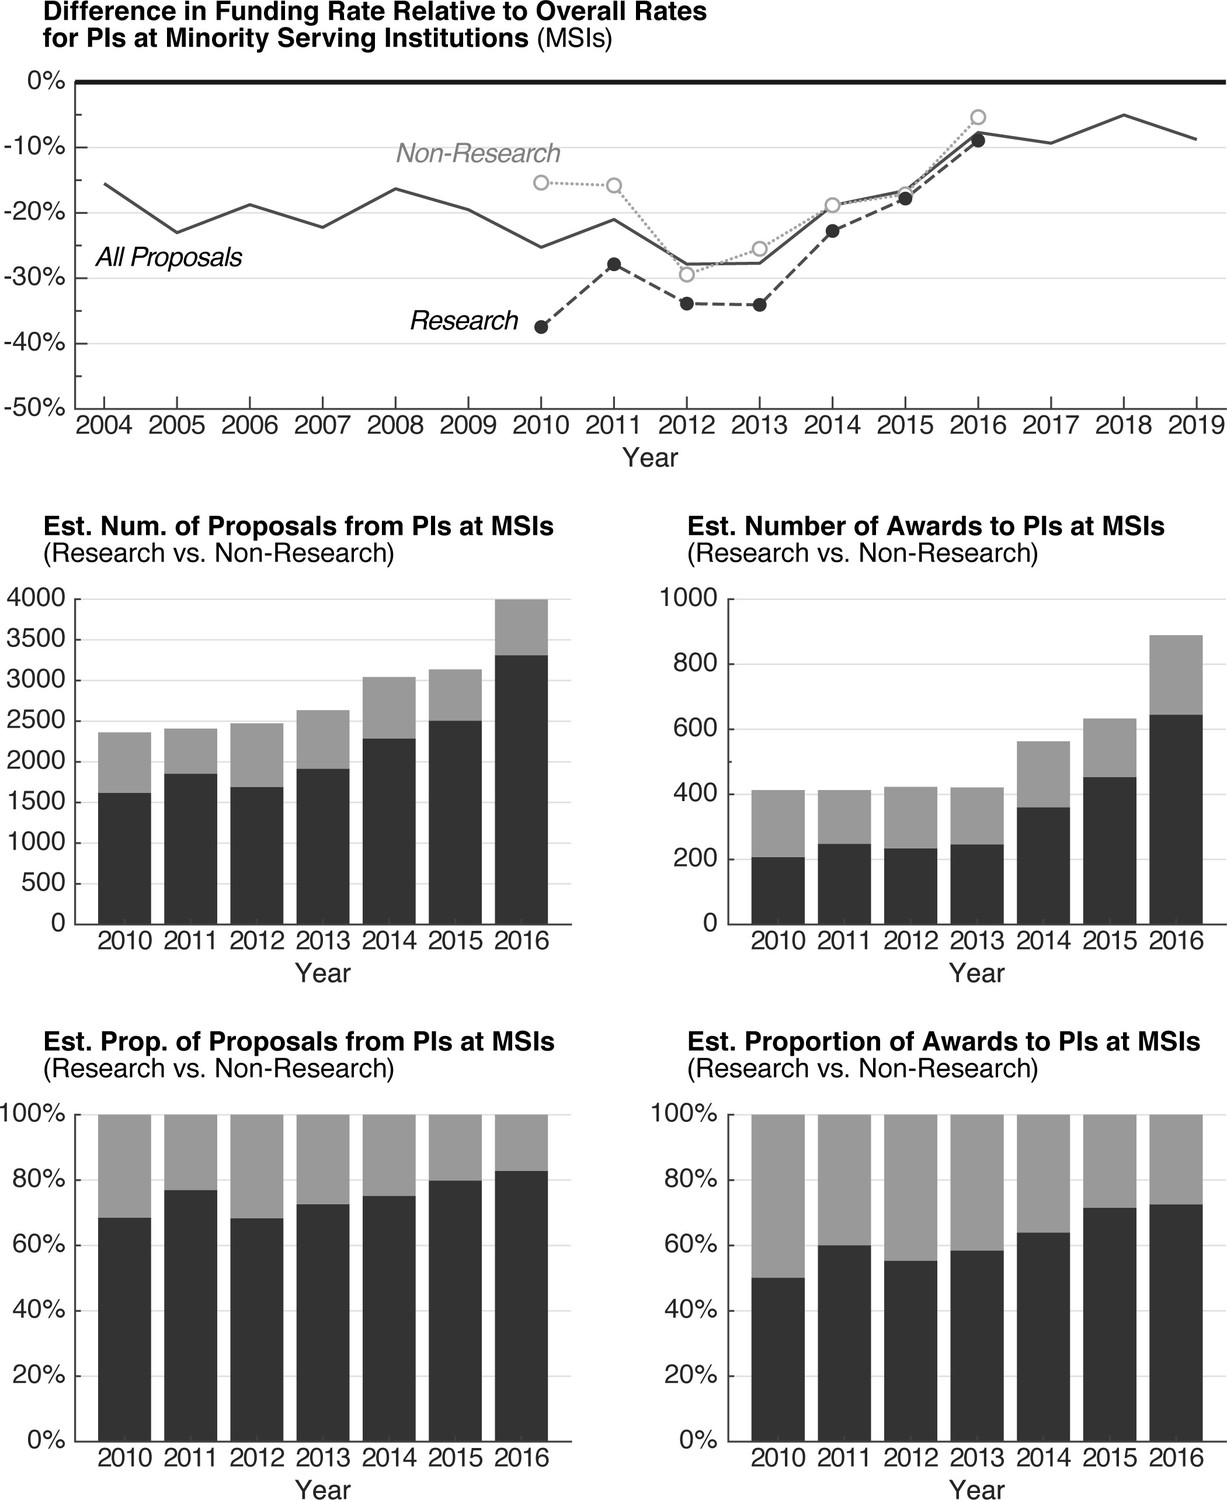
Proposals, awards, and relative funding rates for PIs at Minority Serving Institutions.
(Top) Relative funding rate for proposals by PIs at minority serving institutions (MSIs). Solid line with no markers is the relative funding rate for all proposals; dark dashed line for Research proposals; and light dotted line for Non-Research proposals. (Middle) Estimated number of Research (dark) and Non-Research (light) proposals from and awards to PIs at MSIs. (Bottom) Estimated proportion of Research vs. Non-Research proposals from and awards to PIs at MSIs. These data should be treated as estimates as they are calculated from values extracted via plot digitization of charts in NSF merit review reports, rather than calculations made from numerical data reported in tabular format. Source data: Data S10 in the accompanying data repository (https://doi.org/10.5061/dryad.2fqz612rt).
Figure 6—figure supplement 5
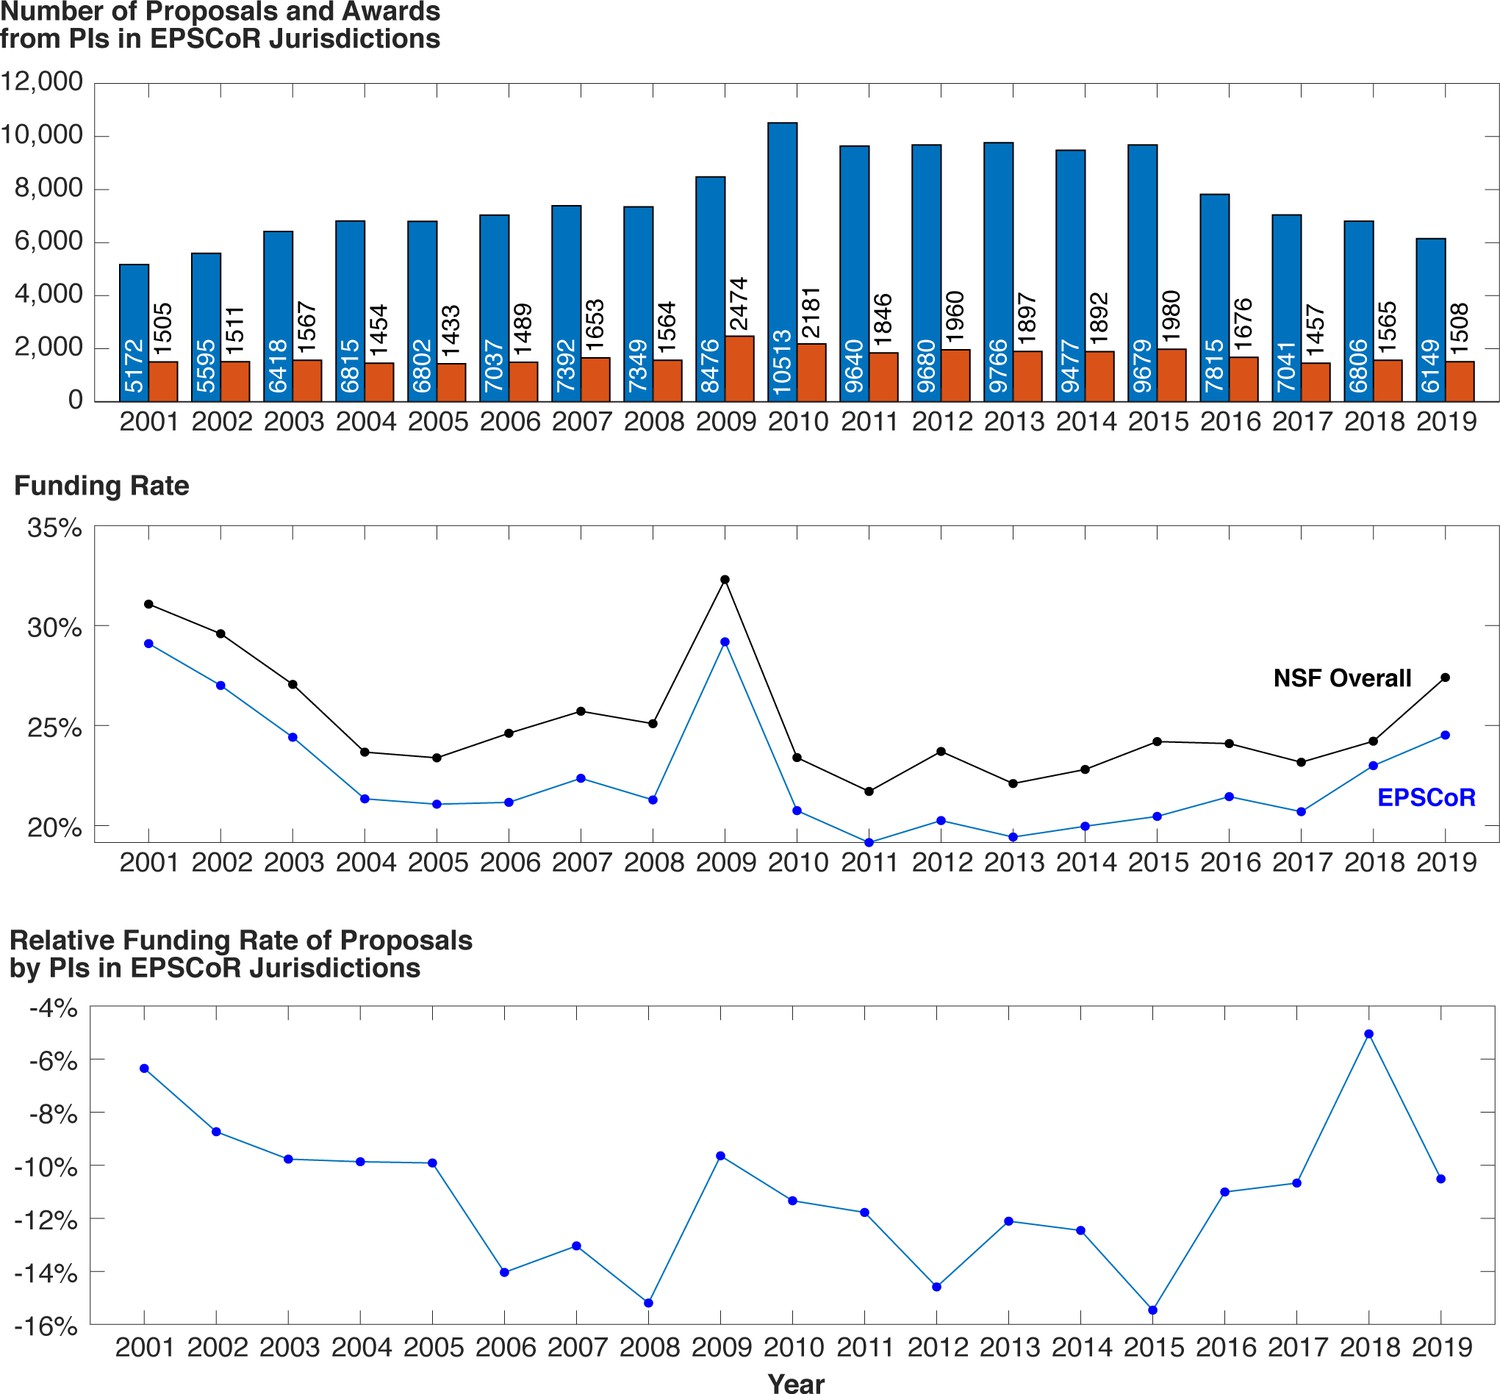
Proposals, awards, funding rates, and relative funding rates for PIs in Established Program to Stimulate Competitive Research Jurisdictions, 2001–2019.
Top: proposals (blue) and awards (orange) for PIs at EPSCoR jurisdictions. Middle: funding rate for all proposals at NSF (black) and for all proposals by PIs in EPSCoR jurisdictions (blue). Bottom: relative funding rate for all proposals by PIs in EPSCoR jurisdictions. Source data: Data S11 in the accompanying data repository (https://doi.org/10.5061/dryad.2fqz612rt).
Figure 6—figure supplement 6
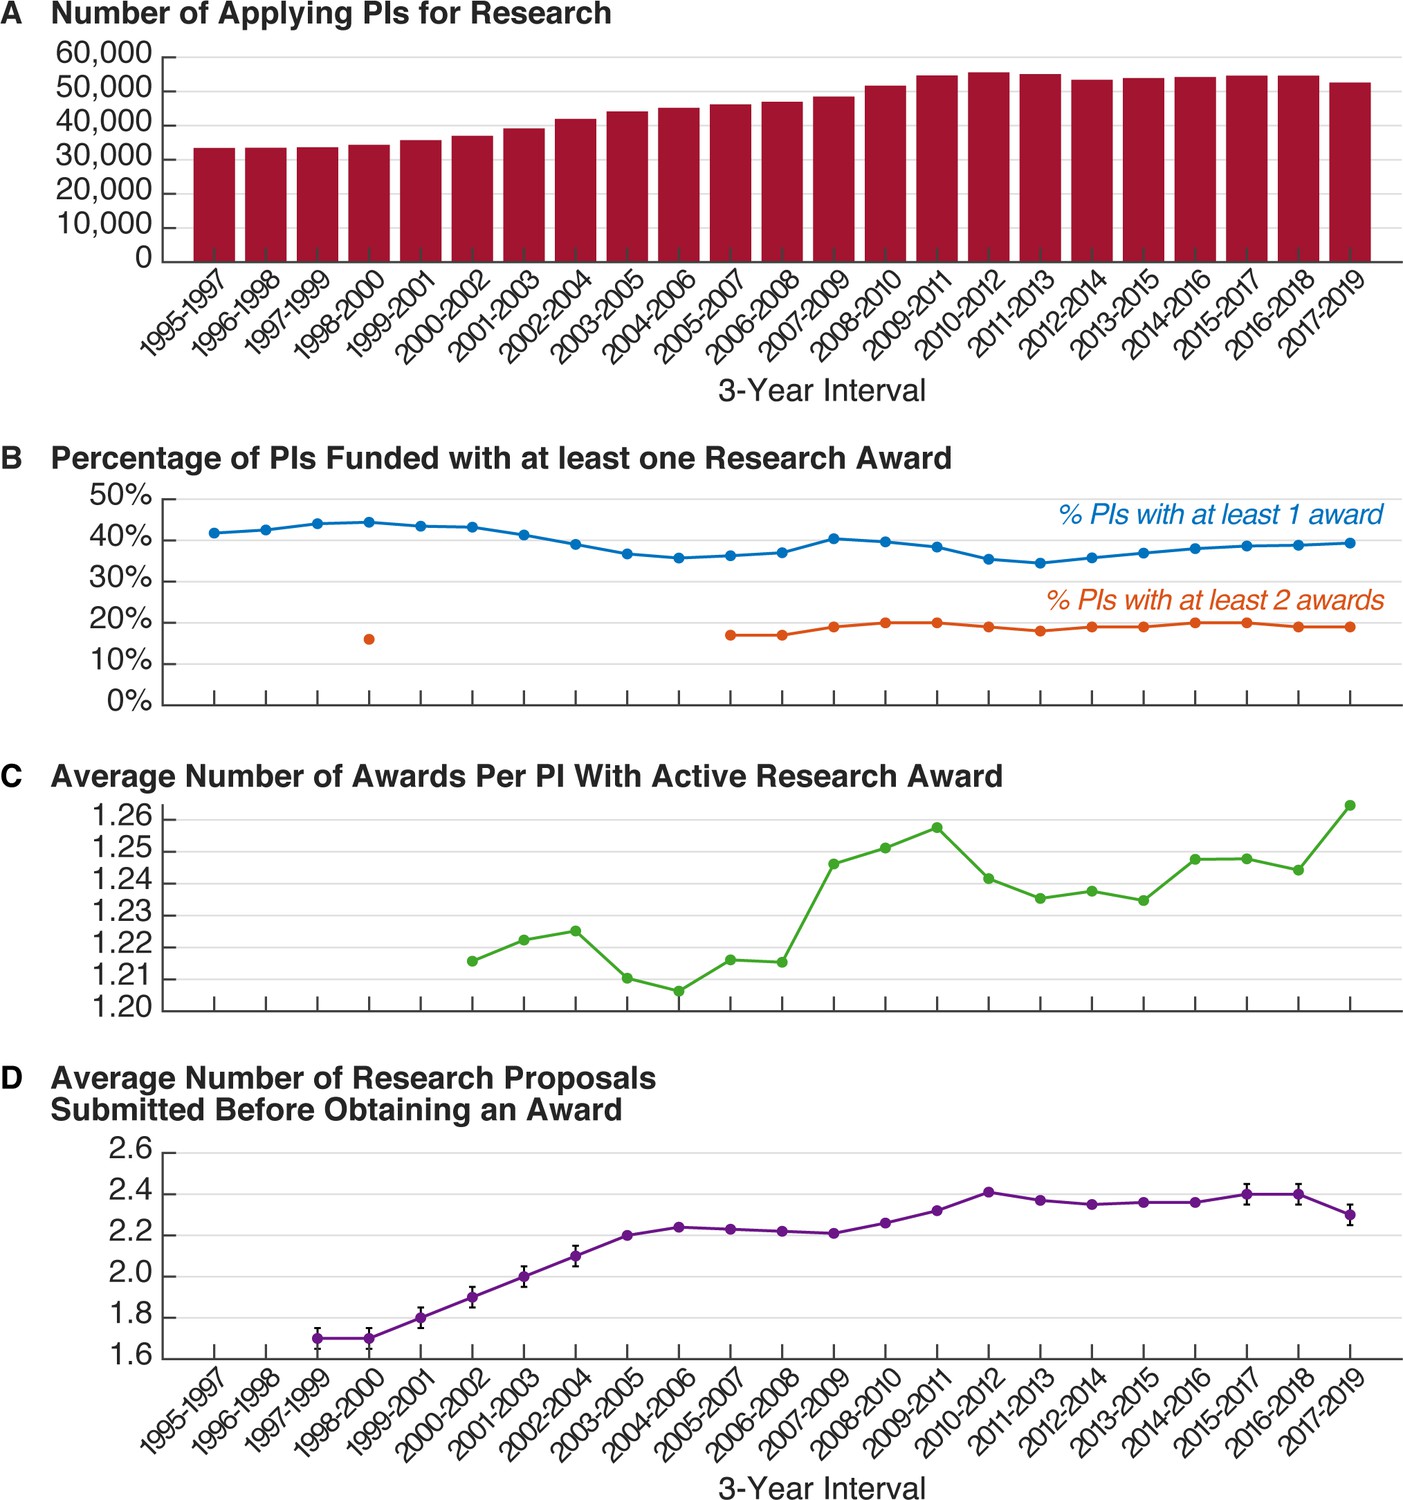
Available statistics on a per-PI basis for Research proposals and awards in three-year windows, 1995–2019.
(A) Total number of unique PIs applying for Research funding in 3 year windows, 1995–2019. (B) Percentage of PIs awarded funding for Research in each 3 year window. Blue line represents the percentage of PIs with at least one award; orange line represents the percentage of PIs with at least two awards. (C) For PIs with an active Research award, the green line represents trends in average number of awards per PI. (D) The average number of proposals submitted before a PI is successfully awarded funding for a Research proposal. Source data: Data S12 in the accompanying data repository (https://doi.org/10.5061/dryad.2fqz612rt).
Figure 6—figure supplement 7
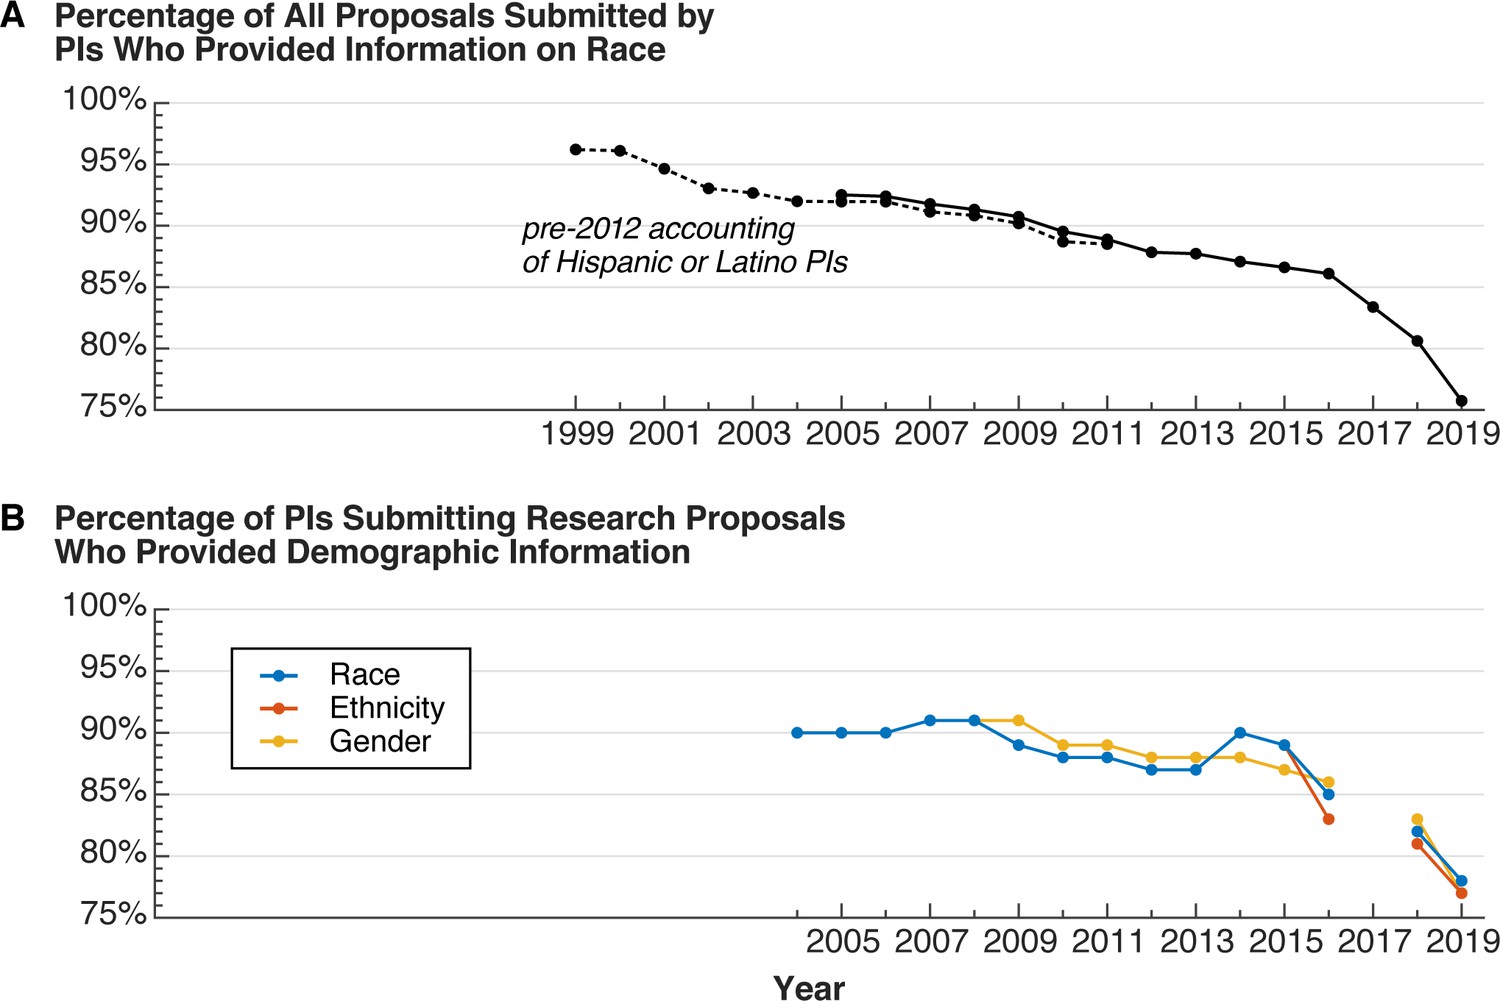
Additional trends in the non-reporting of demographic information by PIs, 1999–2019.
(A) Percentage of proposals submitted by PIs who provided information about their race, 1999–2019. (B) Percentage of PIs for Research proposals who provided demographic information about their race (blue), ethnicity (orange), and gender (yellow), 2004–2019. This panel differs from A in that the percentages are reported on a per PI-basis, rather than by proposals. No data is available for 2017. Source data: Data S13 in the accompanying data repository (https://doi.org/10.5061/dryad.2fqz612rt).
Figure 7 with 2 supplements
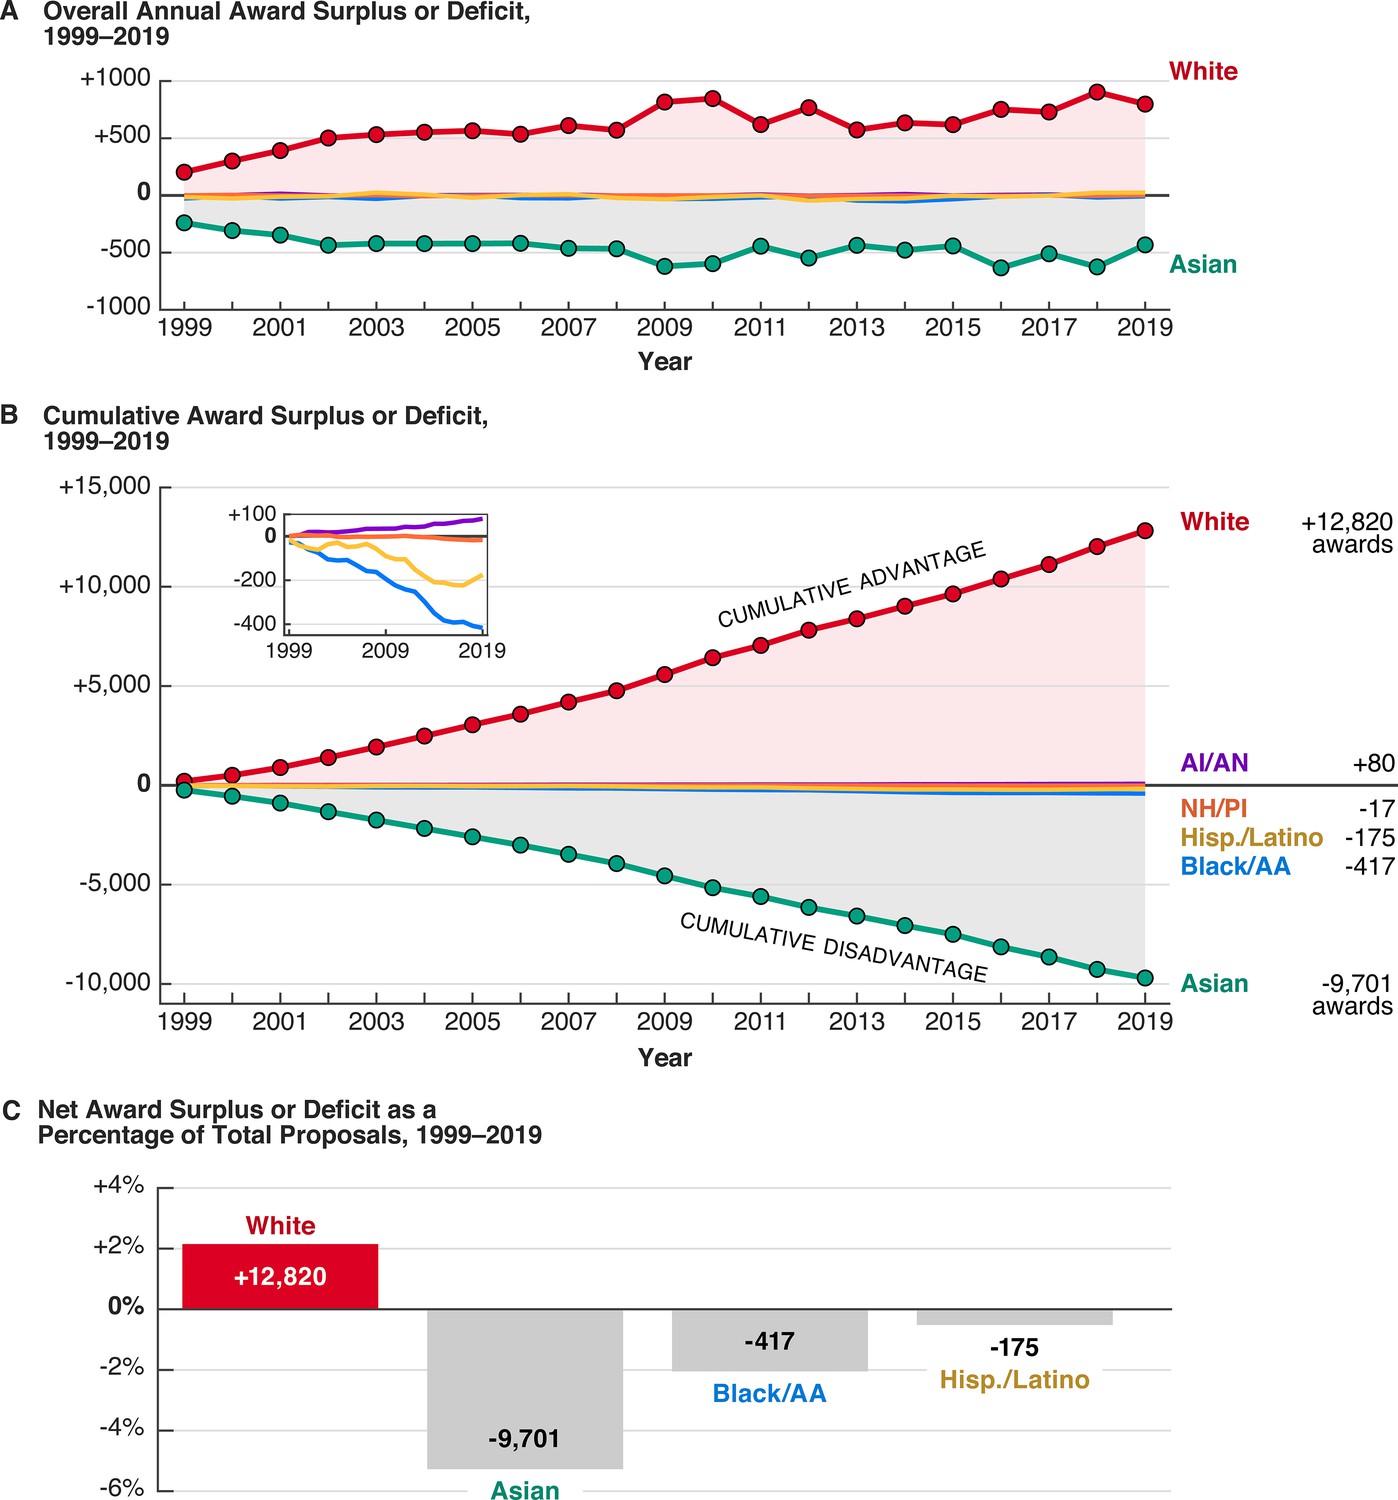
Over 20 years of racially disparate funding outcomes confer a cumulative advantage on white PIs and a cumulative disadvantage on most other groups.
(A) Both the annual award surplus to white PIs and the annual award deficit to Asian PIs has increased over time. All other groups have annual award surpluses or deficits between –60 and +30 (Figure 7—figure supplement 1). (B) The cumulative award surplus or deficit to various groups represents thousands of awards received or not given. The small inset shows cumulative numbers for AI/AN, NH/PI, Hispanic or Latino, and Black/AA PIs. (C) Relative to the total number of proposals submitted by each group from 1999 to 2019, the net award surplus or deficit for white, Asian, Black/AA, and Hispanic or Latino PIs.
Figure 7—figure supplement 1
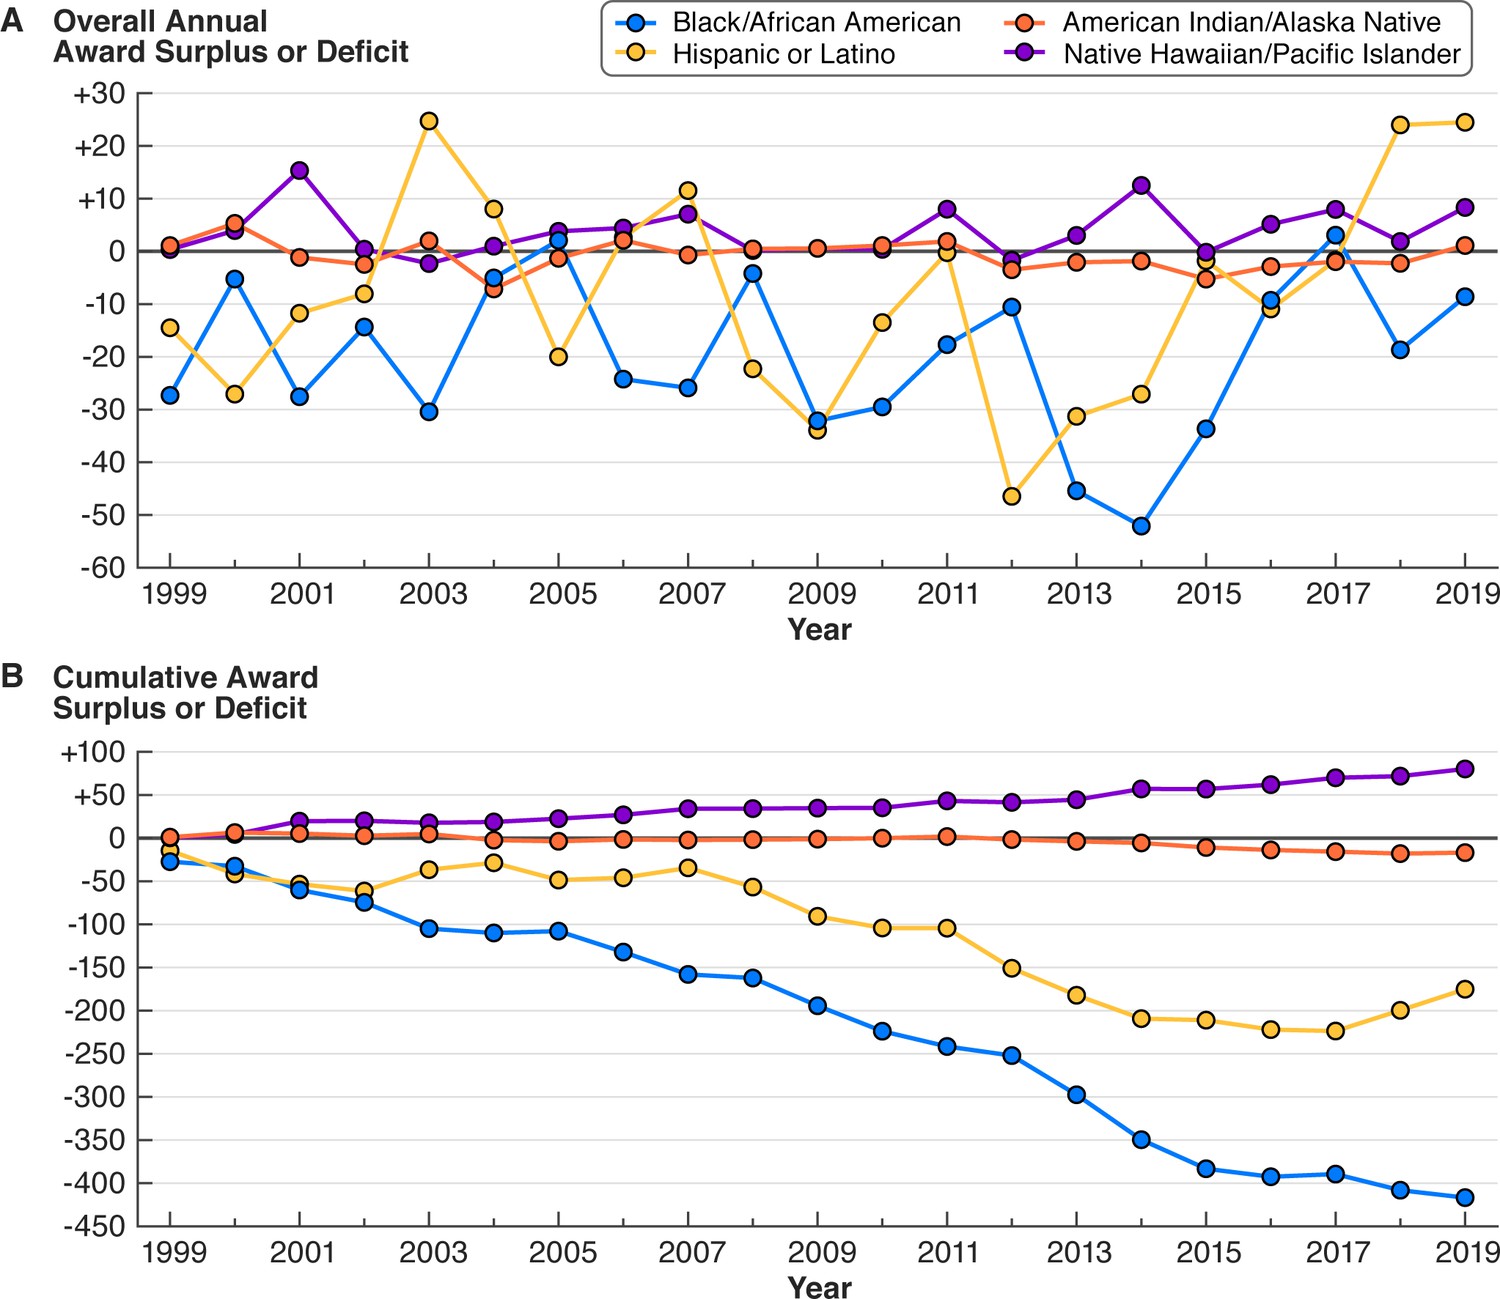
Overall annual and cumulative award surplus and deficit for Black/AA, AI/AN, NH/PI, and Hispanic or Latino PIs, 1999–2019.
(A) These trends appear in Figure 7 but are shown here with an adjusted y-axis. (B) This panel is a larger version of the small inset of cumulative trends for AI/AN, NH/PI, Hispanic or Latino, and Black/AA PIs in Figure 7. Source data: Data S1 in the accompanying data repository (https://doi.org/10.5061/dryad.2fqz612rt).
Figure 7—figure supplement 2
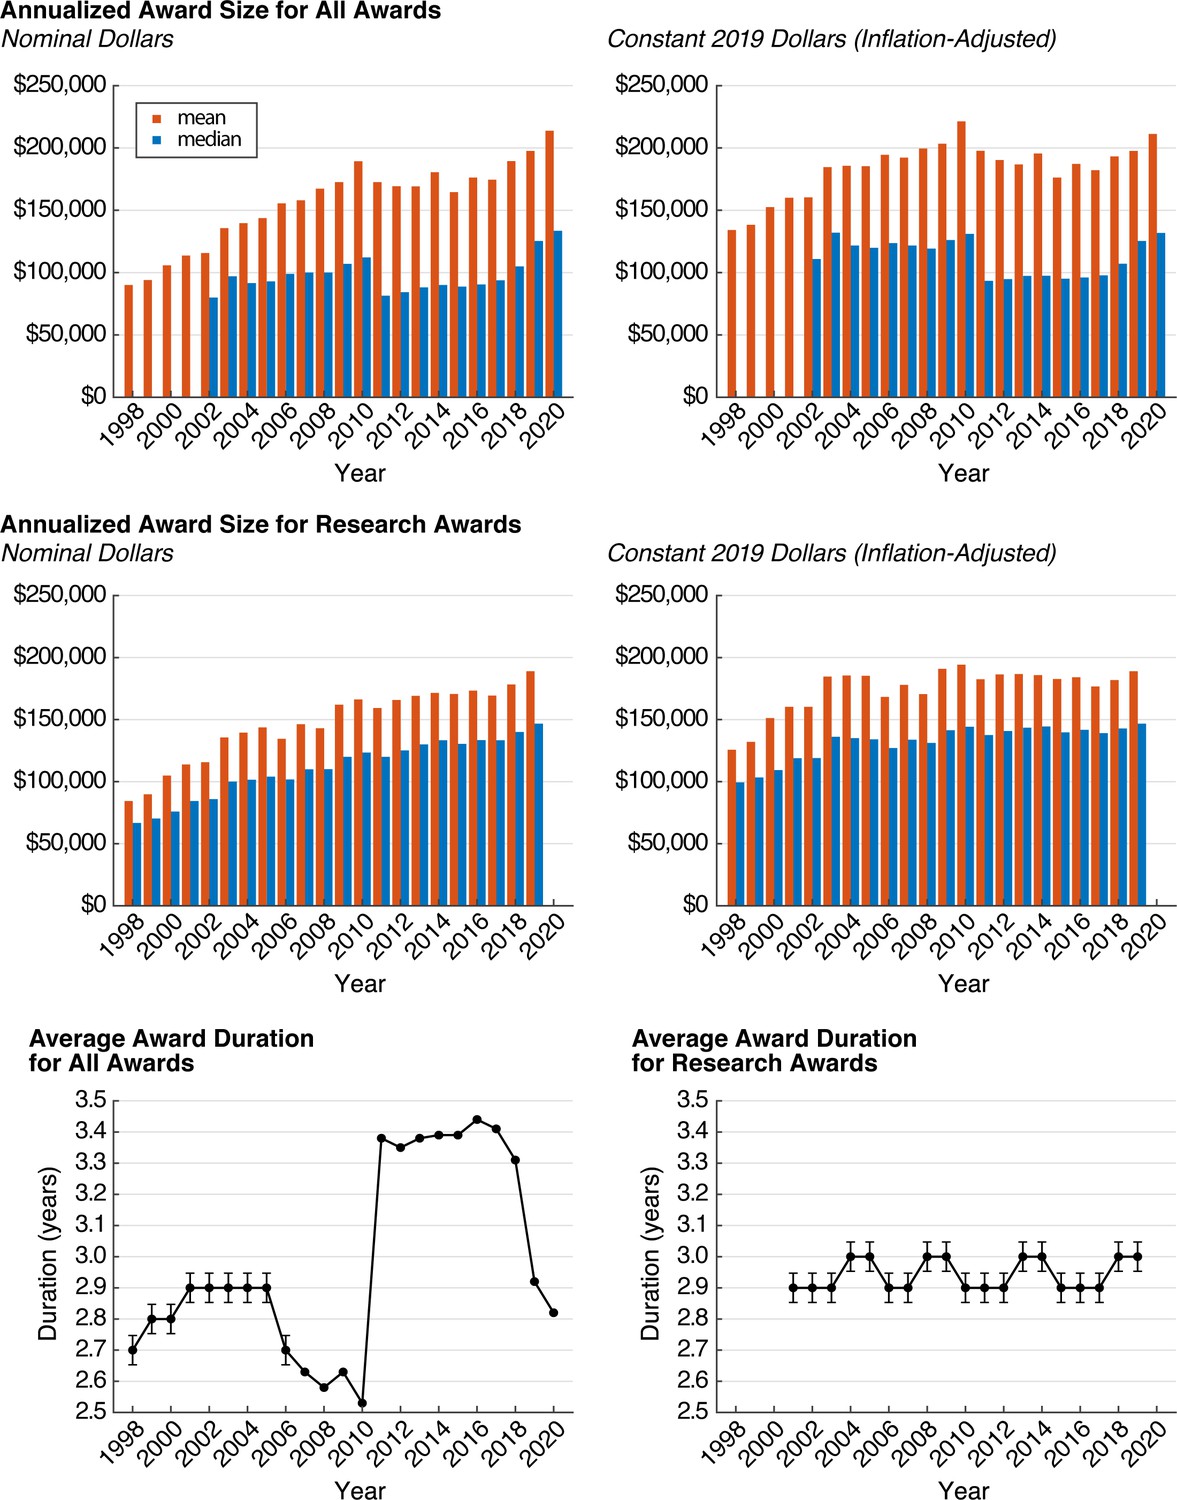
Median and average annualized award size and average award duration for all awards and Research awards, 1998–2020.
Top: the average (orange) and median (blue) annualized award size for all awards in nominal dollars (left) and constant, inflation-adjusted 2019 dollars (right). Middle: annualized award size for Research awards. Bottom: average award duration for all awards (left) and Research awards (right). Error bars are present for years for which the average award duration was reported only to the tenth decimal place, and thus accounts for uncertainty due to rounding. Source data: Data S7 in the accompanying data repository (https://doi.org/10.5061/dryad.2fqz612rt).
Additional files
Download links
A two-part list of links to download the article, or parts of the article, in various formats.
Downloads (link to download the article as PDF)
Open citations (links to open the citations from this article in various online reference manager services)
Cite this article (links to download the citations from this article in formats compatible with various reference manager tools)
Meta-Research: Systemic racial disparities in funding rates at the National Science Foundation
eLife 11:e83071.
https://doi.org/10.7554/eLife.83071


