Today we're pleased to publish our most comprehensive update on the diversity of eLife's editorial board, as part of our commitment to transparency and accountability in our ongoing efforts to address inequities in research and publishing.
This update comes nearly three years after our last report and is again based on information voluntarily shared by eLife editors. Now 77% of all eLife editors have responded via the online form (80% for Senior Editors and 77% for Reviewing Editors), a substantial improvement on the previous 40% response rate. As before, all questions except one were answered by at least 92% of respondents.
The responses – presented and discussed below – provide insights into the visible and invisible diversity within our editorial community. While caution is needed due to data incompleteness, trends indicate tangible progress and areas for improvement. The report is based on data that was correct as of January 2024 and April 2021 and employs rounding and suppression to anonymise data in adherence with HESA guidelines.
Questions and comments about this report are welcome. Please feel free to share your feedback as an annotation; in an email to “edi[at]elifesciences[dot]org”; or via our anonymous feedback form.
Report prepared by:
Stuart King, Research Culture Manager
Geography
Our records offer a comprehensive overview of the spread of our editorial board across the globe. Since our last report in 2021, we have taken steps to actively address the historical underrepresentation of researchers in the Global South at eLife. This has included our first-ever open calls for Reviewing Editors, focused in Latin America and Africa, as well as setting up a new Global South Committee.
We are pleased to report on the positive shifts that have resulted from these efforts. Compared to 2021, we now have almost seven times as many editors in Latin America and more than five times as many in Africa. Specifically, while Latin American and African editors combined made up less than 1% of our editorial board in our last report, currently 7% of eLife editors are based in Latin America and 3% are based in Africa (Figure 1). The number of eLife editors in Asia has also grown, at the moment constituting 14% of our editorial board compared to 11% in 2021.
Conversely, though the United States still represents the largest number of eLife editors, researchers in Northern America now make up a smaller proportion of our editorial board at 51%, compared to 56% in 2021. Overall, we also have fewer eLife editors in Europe (23%) and in Oceania (2%) compared to three years ago.
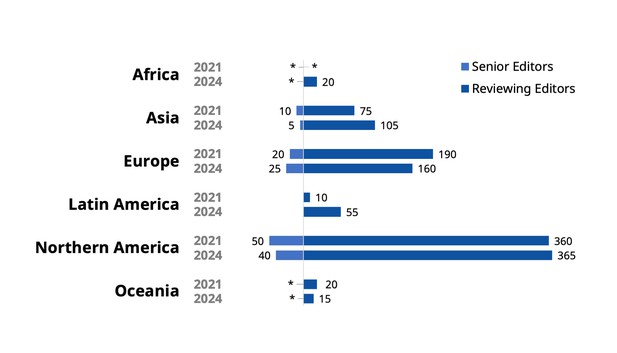
Figure 1: Geographic distribution of eLife editors by continent by year. Based on the country of primary affiliation for the current 710 Reviewing Editors and 75 Senior Editors, compared to the 650 Reviewing and 85 Senior Editors in 2021. “Northern America” includes the United States and Canada; Mexico and Central American countries are included under “Latin America”. For reporting purposes, eLife’s Editors-in-Chief and Deputy Editors are considered to be Senior Editors. All numbers are rounded to the nearest 5, with asterisks (*) indicating values that have been rounded to 0.
While we are pleased with our progress so far, our commitment to improving representation on our editorial board from historically underrepresented countries, particularly in the Global South and beyond, will remain a focal point for our future endeavours.
Career stage
Our data shows early-career researchers now represent 13% of eLife Reviewing Editors, up from 10% in 2021 (Figure 2). For reference, eLife defines early-career researchers as those with either no independent investigator experience or less than five years experience in an independent position in which they have secured funding for a research group. Mid-career researchers, encompassing those with six to fifteen years of independent experience, currently make up 41% of current Reviewing Editors, down from 46% in 2021. Meanwhile, 46% of our Reviewing Editors fall into the late-career category, with over fifteen years of experience, up from 44%.
For Senior Editors who shared their career stage via the self-reporting form, the distribution has remained stable since 2021, with 2% being early-career, 31% being mid-career, and 67% being late-career (Figure 2).
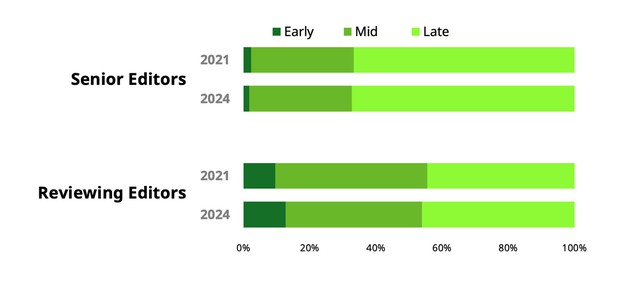
Figure 2: Career-stage distribution of eLife editors by year. Early-career researchers have up to five years’ experience as an independent investigator; mid-career researchers are independent investigators with between six- and fifteen-years of experience; and late-career researchers are independent investigators with more than fifteen years of experience. Based on self-reported responses from 40 Senior Editors and 205 Reviewing Editors in 2021; and 55 Senior Editors and 495 Reviewing Editors in 2024. Figures exclude editors who didn’t provide a year of independence or selected “Prefer not to say”. For reporting purposes, eLife’s Editors-in-Chief and Deputy Editors are considered to be Senior Editors. All numbers quoted are rounded to the nearest 5.
The increase in early-career researchers on our Board of Reviewing Editors over the past three years aligns with our continued efforts to create more opportunities for researchers of all career stages to join our editorial board. This commitment was evident in the design of our first two open calls for Reviewing Editors, which proved effective in identifying early-career researchers with the skills we look for in eLife editors. For instance, one third of the new editors recruited via our 2022 Latin American open call and at least one in five from our 2023 African open call were early-career researchers.
Disability and long-term health conditions
Disabled people remain underrepresented on our editorial boards. Despite constituting an estimated one-fifth of working-age populations, the proportion of eLife editors identifying as disabled is 1% (based on 600 responses). Additionally, 4% report encountering barriers or limitations in their day-to-day activities due to a disability, health condition, or impairment, aligning with the Equality Act 2010 definition of a person with a disability (based on 585 responses). These figures – largely unchanged since 2021 when they were 1% and 3%, respectively – likely reflect the persistent underrepresentation of disabled individuals in science, though they correlate with their estimated representation among full-time academics in both the United States and the United Kingdom at less than 5%.
Family educational background
While yet to be a primary focus in our editor recruitment, we have consistently gathered self-reported data on the family educational background of our editors since 2021. During this period, we've noticed a slight positive trend, suggesting that our broader efforts have also enhanced our editorial board’s diversity in relation to this measure of socioeconomic status that is pertinent to academic career paths.
More eLife editors were ‘first-generation students’, with the percentage now at 29%, up from 25% in 2021 (Figure 3). Additionally, there has been a decrease in the percentage of editors who at the age of 18 had at least one parent or guardian with a university degree or equivalent. This is now at 65%, down from 70% in 2021. To put this second figure into a wider context, the corresponding percentage for biology professors in the United States is 68%, but 22% for the general US population.
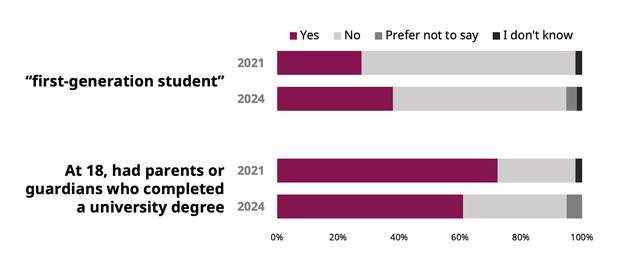
Figure 3: Family educational background of eLife editors by year. Responses to the questions: ‘Do you identify or would you have identified as a “first-generation student”?’ and ‘When you were 18, had any of your parents or guardians completed a university degree course or equivalent (e.g., BA, BSc or higher)?’. Based on self-reported responses from 285 and 280 eLife editors in 2021, respectively; and 595 eLife editors in 2024. All numbers rounded to the nearest 5.
Gender identity
The lack of gender equality in research causes many issues. While the gender balance in the scientific workforce varies worldwide, on average, women remain underrepresented compared to men, and a similar disparity is also evident for people of minority genders.
Biases in publishing and peer review contribute to the gender inequity in science. Studies show that greater diversity among editors and reviewers can, however, lead to fairer outcomes for authors of underrepresented genders. Evidence also suggests that merely achieving proportional representation of women on editorial boards might nevertheless not be enough to ensure equitable involvement or outcomes in peer review.
At eLife, we are steadfast in our commitment to creating an equitable publishing experience for all genders. While our most recent data shows around 27% of corresponding authors submitting articles to eLife are women, due to the gender disparities described above, our longstanding aspiration has been to go beyond this for our editorial board. We instead have the long-term goal of an equal number of men and women serving as eLife editors.
Since our last report, we have gained a more accurate understanding of the gender diversity within our editorial board. Now, more than 75% of eLife Senior and Reviewing Editors have shared their gender through our self-reporting form, up from approximately 40% of editors in 2021. The latest data reveal that 39% of eLife Reviewing Editors are women, 61% are men, and non-binary editors account for less than 1%; for Senior Editors, 41% are women and 59% are men (Figure 4).
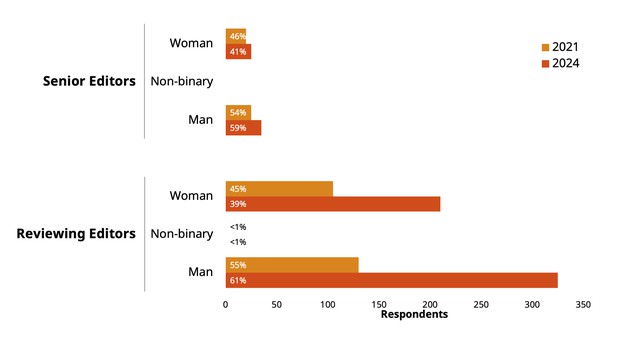
Figure 4: Gender identity of eLife editors by year. Based on self-reported responses from 50 Senior Editors and 235 Reviewing Editors in 2021; and 60 Senior Editors and 535 Reviewing Editors in 2024. Percentages are quoted separately for Senior Editors and Reviewing Editors. For reporting purposes, eLife’s Editors-in-Chief and Deputy Editors are considered to be Senior Editors. Figures exclude editors who selected “Prefer not to say”. All numbers quoted are rounded to the nearest 5; any number lower than 2.5 is rounded to 0.
Women are better represented among eLife editors compared to both eLife corresponding authors and estimates for an ‘average’ journal editorial board (14%) . However, the most recent data indicate a departure from gender parity since our last report, as in 2021, our data suggested that 44–46% of eLife editors were women.
While we feel it is crucial to recognise that the incomplete data in our previous report, stemming from a lower response rate, may have meant our previous figure was an overestimate for the proportion of women on our editorial board at that time, we also acknowledge that our recruitment efforts in the Global South over the past two years did not bring us closer to our gender representation goal.
Despite tailoring messages and outreach, and attempting an intersectionality-informed approach to the review process, both of our first two open calls for new editors led to more men being recruited than women. Specifically, in our Latin American open call, 62% of the new editors were men, 33% were women, and 5% were non-binary. A similar pattern emerged in our recent call in Africa, with men again being the majority of recruited editors.
With a more accurate understanding of our current status and established monitoring methods, addressing the gender imbalance will be a priority in our 2024 efforts. Planned actions include efforts focused on subject-specific editor recruitment and initiatives to increase the participation of women and gender-minority researchers in our early-career reviewers pool too.
In terms of trans representation on our editorial board, this has remained constant since 2021 at less than 1%; trans is an umbrella term for people whose gender identity differs from what is typically associated with the sex they were assigned at birth.
Breaking the gender identity data down by career stages reveals that our early- and mid-career editors are closer to gender parity than our later-career editors (Figure 5). We also note that the gender difference in the average length of our editors’ research careers has shrunk since to 2021, with the average man now serving as an eLife editor having 18 years of experience since becoming an independent investigator (down from 20 years), while the average woman has 16 years (up from 15 years).
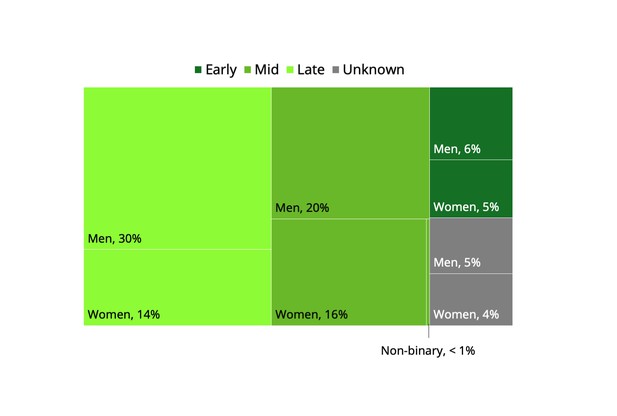
Figure 5: Career stage of eLife editors by gender identity in 2024. Based on self-reported responses from 595 editors. Definitions of career stages are the same as those in Figure 2. Figures exclude editors who selected “Prefer not to say”. All numbers quoted are rounded to the nearest 5.
Race and ethnicity
In 2020, we reflected on our past shortcomings in achieving racial and ethnic diversity within our editorial board. Since then, however, we're pleased to report notable progress in this area.
Currently, more than one in five eLife editors (22%) belong to a minority or underrepresented group based on their race or ethnicity, up from 15% as reported in our last update (Figure 6). This new figure represents 19% of Senior Editors and 23% of Reviewing Editors, showcasing an improvement across different levels of eLife as previously the figure was 15% for both roles. Moreover, when looking at this in the context of gender, the breakdown is now 23% of women editors and 22% of men editors, up from 18% and 14% in 2021, respectively.
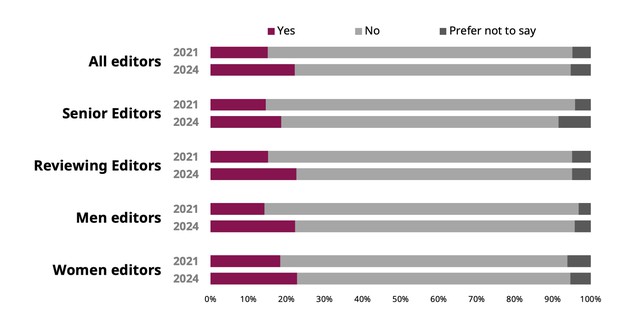
Figure 6: Percentage of eLife editors who identify as a member of a minority or underrepresented group based on their race or ethnicity by year, broken down for different groups. 2021 data is based on responses from 290 editors in total (‘All editors’), including 50 Senior Editors, 245 Reviewing Editors, 155 men and 130 women. 2024 data is based on 590 responses in total, including 60 Senior Editors, 530 Reviewing Editors, 355 men and 225 women. All numbers quoted are rounded to the nearest 5.
This positive change can be attributed in part to our efforts in testing a more equitable recruitment approach through open calls, particularly those designed to address our underrepresentation in the Global South. Notably, both calls achieved above-average success rates in recruiting editors from minority or underrepresented racial or ethnic groups. For example, in the recent open call focused on Africa, over half of the newly recruited editors self-identified as members of such groups, while for the 2022 Latin American open call, the percentage was 38%.
Race and ethnicity are social constructs related to human ancestry, and thus how they are conceived often depends on the individual’s unique social context. Despite ongoing developments, there is no universally accepted framework or recognised best practice for reporting on race or ethnicity among international groups. Language and terminology vary across individuals, countries, and evolve over time. As such to inclusively collect this data, since 2021, we have allowed editors to describe their race and ethnicity in their own words through an open-ended question.
Over time, the number of editors providing this information has grown from 160 to 330. Among the resulting 105 unique answers, these responses varied from single words to more extended descriptions of personal experiences related to identity.
While we recognise that this data collection format has advantages and disadvantages, it does nevertheless intentionally allow us to reevaluate the data against different schemas or frameworks as they emerge. For this report, we have assessed the data using the race schema developed by the Joint Commitment for Action on Inclusion and Diversity in Publishing, of which eLife has been a member since 2020 (Figure 7).
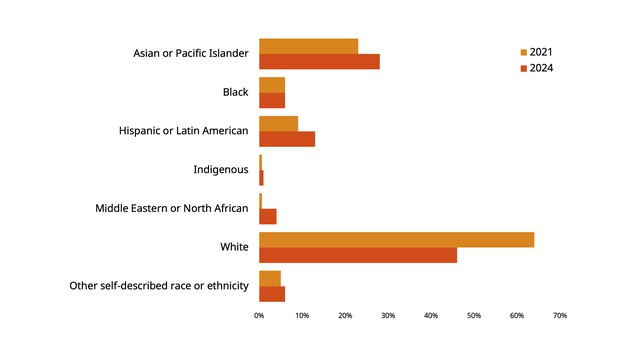
Figure 7: Racial and ethnic diversity among eLife editors by year. Based on self-reported responses from 160 editors in 2021 and 340 editors in 2024. “Asian or Pacific Islander” also includes people who specifically identify as East Asian, South Asian or South East Asian. “Black” also includes people who identify as African American. “Hispanic or Latin American” also includes people who identify as either Latina, Latino or Latinx. “Indigenous” includes people who identify as Native American. “Middle Eastern or North African” includes people who identify as Arab or Arabic. “White” also includes people who identify as Caucasian or of European descent. Respondents could give multiple responses when describing their race or ethnicity; thus, the total exceeds 100%. All numbers quoted are rounded to the nearest 5.
Encouragingly, comparing 2024 data against the 2021 data also shows the trend towards greater diversity among our editors. However, the open-ended question has consistently had a lower response rate compared to other form questions, potentially impacting the data's reliability. This is still an apparent bias in who has answered this question, with 85% of editors identifying as a member of a racial or ethnic minority or underrepresented group self-reporting their race or ethnicity, compared to 50% of those editors who did not identify as such. Consequently, as before, the data may overestimate editors from underrepresented and minority groups and underestimate those from majority groups. This is something we will continue to monitor and report on in the future.
Sexual orientation
Understanding this aspect of identity remains challenging due to limited research, but estimates indicate that individuals in the scientific workforce who identify as part of a sexual minority face ongoing challenges not experienced by their heterosexual peers.
The proportion of eLife editors identifying as members of a minority group based on their sexual orientation has remained constant at 4% since 2021 (based on 600 responses). This distribution includes 3% of Senior Editors and 4% of Reviewing Editors (based on 60 and 540 responses respectively). To provide context, a global population survey in 2023 suggests that, while percentages vary between countries, on average, around 8% of people identify with diverse non-heterosexual identities – such as homosexual, gay, lesbian, bisexual, pansexual, or asexual – with other repeated surveys also indicating a general upward trend in these numbers.
Next steps
The self-reporting form is now smoothly integrated into the onboarding process for new editors. However, for a more comprehensive understanding of our entire editorial community, we will aim to boost response rates from existing eLife editors too.
Acknowledging that meaningful change takes time, our ongoing goals will remain centred on better reflecting the diversity of research communities within eLife’s editorial boards, but with a renewed focus on incorporating intersectionality into these activities. We will also look to use the data collected to assess the extent to which our editorial boards are providing an equitable experience for all and to monitor our progress in making peer review fairer. Transparent reporting on our successes and shortcomings in all of these efforts will also continue.
#
We welcome comments, questions and feedback. Please annotate publicly on the article or contact us at hello [at] elifesciences [dot] org.
Interested in finding out more about opportunities, events and issues in research culture? Sign up to the eLife community newsletter or follow @eLifeCommunity on Twitter.


