Blogpost by Lilly Winfree, Julie McMurry, Melissa Haendel, The Monarch Initiative
The Monarch Initiative is an international consortium, comprised of an eclectic mix of biologists, ontologists, programmers, geneticists, and clinicians; we take disparate genetic and phenotypic data and integrate it for disease discovery and diagnosis. Towards this end, we have developed a web portal (https://monarchinitiative.org) and numerous tools and new APIs that we want to share with scientists across disciplines.
At Monarch, the data we are unifying is diverse and describes fundamentally different kinds of observations. Our integrated data corpus currently contains data from more than 35 sources and more than 100 genuses, and is composed of different data types such as genetic expression and variation, disease associations, different kinds of phenotypes, and is represented together with the type of evidence that supports it (e.g. a PMID, a traceable author statement, or a genetic sequence similarity score). But we don’t only integrate the data, we also provide more complex algorithmic associations, such as phenotypic enrichment or statistical modeling, all with a goal of illuminating new connections between this data.
Why are we concerned with programmatically and computationally integrating this data? As an example use case, take a physician with a patient diagnosed with Fanconi Anemia (FA). The physician is interested in a new potential treatment, and is searching the internet for literature related to FA using the patient’s symptoms of “skeletal anomalies of the hips, spine” as keywords. However, this same feature of FA is described as “kinked tail” in mouse models of FA, resulting in reduced literature search results for the physician, and therefore less knowledge transfer. In our ideal world, the physician would search over our integrated data on our Web Portal and find relevant data that would include information from humans and other models, and that integrated data could better inform the physician.
However, integrating this data is easier said than done. Each piece of data can be thought of as a puzzle piece; it contains various colors and contours, but it is difficult to see the big picture without assembling all the puzzle pieces. The purpose of data integration is insight, not raw connections. When integrating data, we first aggregate all the data, but this alone is insufficient to solve the puzzle. To fully integrate this data, we cannot simply dump all the puzzle pieces together; we must assemble them in the correct order. However, this assembly can be very difficult without the right model.
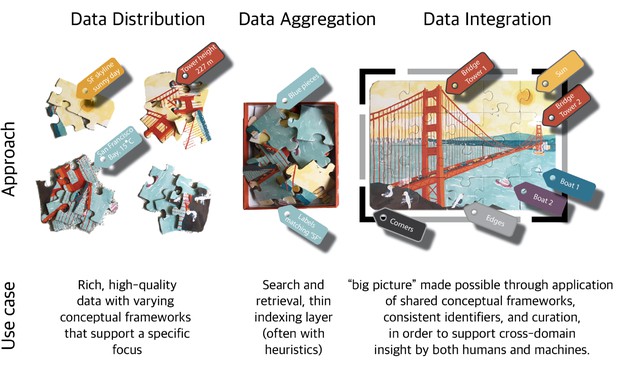
The data integration process can be thought of as the assembly of a very complex puzzle. Julie McMurry.
To unite genotype and phenotype data, we have developed an extract, transform, load (ETL) pipeline called DIPper (Data Ingest Pipeline). We extract data in multiple formats from numerous sources. For example, in the case of the mouse database, MGI, and the fly database, Flybase, we extract data in the form of dumps of relational databases. In other cases, such as the zebrafish database, ZFIN, we ingest a flat file (.csv), and in the case of the genomic variation database, Clinvar, we ingest XML format. But harmonizing different file formats is trivial compared to harmonizing the way in which the underlying data itself is modeled; modeling varies widely between (and even within) sources. Because the component pieces are not designed to be used together, the task is not unlike building a single structure from a combination of different types of building blocks. These pieces do not fit together without the “semantic glue” of shared data modelling and ontologies; this is precisely what Monarch provides.
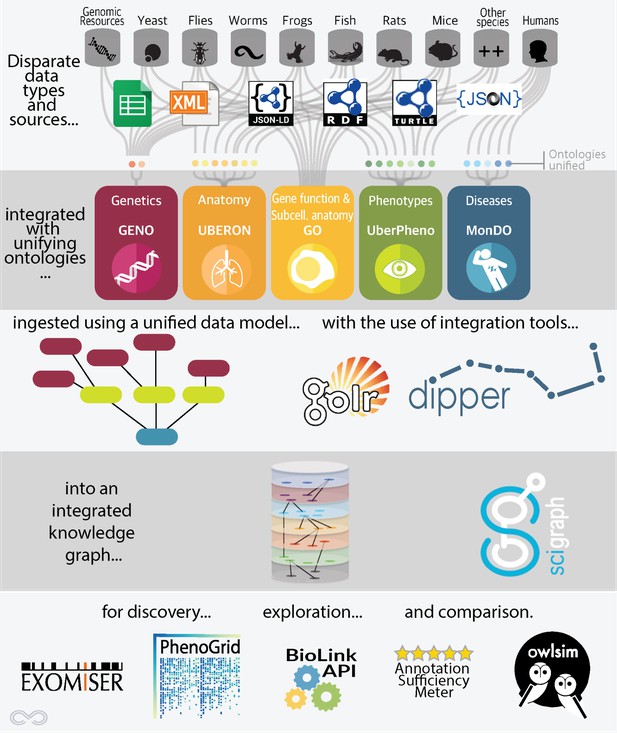
Overview of the Monarch architecture. Lilly Winfree and Julie McMurry.
Ontologies are classification systems that define objects, or terms, and the relationships between those objects. For instance, we use the Uberon ontology to compare data containing anatomical terms across species since similar data can be described very differently within different communities. The necessity of using Uberon is exemplified in the earlier example case of Fanconi Anemia data where the same feature of FA is described in different anatomical terms in different species. Using ontologies allows a computer to “know” that these different terms are describing comparable phenotypes across multiple species. If you were looking to find all genes associated with abnormalities in limbs or fins (across species), we have a page for that here (pictured below); there are over 3,000 such genes and collectively, the associations were observed in nine different species, including goat! This limb/fin data was also sourced from numerous databases including:
- Orphanet: a web portal for rare diseases
- OMIM: Online Mendelian Inheritance in Man
- ClinVar: genomic variation data
- MGI: Mouse Genome Informatics
- MMRRC: the Mutant Mouse Resource & Research Centers
- IMPC: the International Mouse Phenotyping Consortium
- Coriell: biorepository data
- ZFIN: The Zebrafish Information Network
- GWAS Catalog: The NHGRI-EBI Catalog of published genome-wide association studies
- OMIA: Online Mendelian Inheritance in Animals
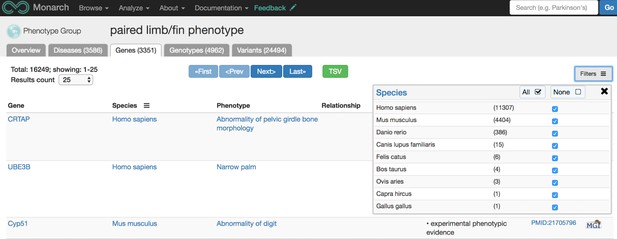
Screenshot from https://monarchinitiative.org/UBERON:0004708PHENOTYPE#genes showing all genes associated with phenotypic abnormalities occurring in limbs or fins, across species. Source: monarchinitiative.org.
Other ontologies we use and develop include the Human Phenotype Ontology (HPO), the Gene Ontology (GO), the phenotype ontology UberPheno, the genotype ontology GENO, and the Monarch Disease Ontology (MONDO). By using ontologies, we are able to ensure that we are placing the puzzle pieces efficiently and in the right structure, establishing a unified portrait of the data landscape.
Once the data is integrated into our ontology-enhanced graph database, SciGraph, we can match phenotypes, genes, and diseases with each other using statistical similarity calculations. The user endpoint for this integrated data is our webportal: https://monarchinitiative.org. This site allows users to analyze sets of phenotypes, compare phenotypes between multiple diseases, genes, or models, and search for data associated with a specific disease. For instance, below is a portion of the overview page for Fanconi Anemia.
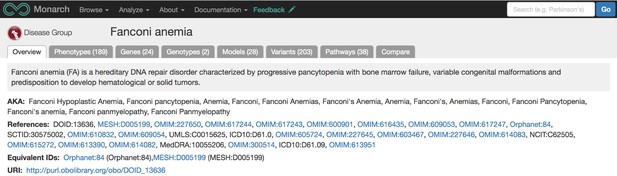
Our overview page for Fanconi Anemia shows phenotypes, genes, genotypes, models, variants, and pathway data associated with the disease from various sources and species. Source: monarchinitiative.org.
The disease overview page displays integrated data associated with that disease, including phenotypes, genes, genotypes, models, variants, and pathways. Users can also compare phenotypes between a disease of interest and other diseases and models using our Phenogrid tool (example pictured below).
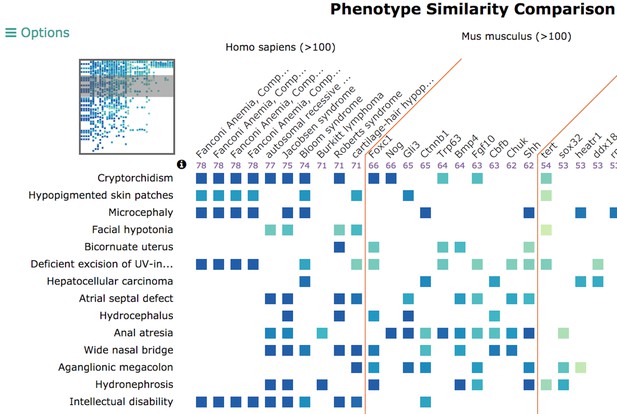
Our phenogrid tool visualizes phenotype comparisons across species, models, and other diseases. Source: monarchinitiative.org.
We also have an API, which allows bioinformaticians and web developers to access the integrated Monarch data programmatically: https://api.monarchinitiative.org/api/. Our API supports complex queries, for example, finding mouse models of Parkinson’s disease, or all human genes associated with cleft palate phenotype, or a list of all vertebrate genes with either phenotype or disease associations. Helpful use cases and the code behind the API can be found here: https://github.com/biolink/biolink-api. Users can find and access our integrated data in multiple ways. For example, if you are interested in breast cancer data, you can search for ‘breast cancer’ on the web portal and see our breast cancer data overview page, you can view this data in JSON format, or you can use the API to find all genes associated with breast cancer in our system.
What is all this integrated data good for? Monarch has developed a clinical diagnostic tool, Exomiser, which is used to rank variants as being potentially disease causing. Exomiser is utilized extensively by the rare disease community, by the NIH Undiagnosed Disease Network, and by various commercial entities such as Cartegenia, and is the first example of a clinical diagnostic tool used to diagnose patients that leverages model organism data directly.
How can you join us on our data integration quest? Please use our tools and provide us with feedback! We are working on updating our Web Portal user interface this year, so we would like to know what features are useful (or not useful) for you and where we could improve. We would also like to hear from you if you have data that you’d like to share with us. Or, have you noticed data that we should have but don’t? Please let us know by emailing (info@monarchinitiative.org), tweeting at us (@MonarchInit), or sign up for our newsletter. We are also working on improving our data ingest documentation so that outside users can ingest their data into our system on their own; keep your eyes peeled for this implementation!
To support openness and data sharing, the Monarch data ingest source code, ontologies, and web application code are all openly available on Github. We invite the scientific community to join us on our quest to improve disease diagnosis and discovery by sharing and integrating phenotype, genotype, and disease data from all species.
The Monarch Initiative member groups are: OHSU, Lawrence Berkeley National Laboratory, the Jackson laboratory, Renaissance Computing Institute, Queen Mary University of London, Charité - Universitätsmedizin Berlin, and the Garvan Institute. Joining this fall is our newest member, from the European Bioinformatics Institute. Find out more at https://monarchinitiative.org/page/team.
For the latest in innovation, eLife Labs and new open-source tools, sign up for our technology and innovation newsletter. You can also follow @eLifeInnovation on Twitter.


