By Brett Beaulieu-Jones (Twitter), Harvard Medical School, and Casey Greene (Twitter), University of Pennsylvania
Imagine that your lab had a team of robots that would follow your instructions. For each step, you’d tell them how to do it and then they would do all the steps from start to finish, whenever you changed any part of your experiment. Whenever you wanted to reproduce your work, you could share the instructions. If you’re a computational biologist, this type of system is currently available through improved software engineering practices. In this blogpost, we describe how we’ve applied software engineering practises to our research to make it reproducible and improve our own efficiency, and we invite you to try this out in your own work.
Learning reproducibility from software engineers
Researchers’ credibility is based on the ability of others to reproduce their work. A benefit of open access is that articles that are shared under an open license can be redistributed to anybody. These manuscripts often describe the steps deemed critical to reproduce the results of the paper. Experiments are likely to contain hundreds of minor steps (process data using version 17 of the chip description file, ...), and only the steps considered critical are described in the manuscript. Using containerization and scripted steps produced by continuous analysis, these minor steps are captured alongside the major steps. This allows the original authors, their labmates, and future readers to reproduce what was done. The final output from one analysis can be used as the starting point for subsequent experiments, making it much easier to build on earlier work.
Companies that release software need to build, test, and deploy software for each release. If every step isn’t followed, the software may not work. To avoid human error, they built automated systems to carry out these processes. Such “continuous integration” systems can be configured to automatically perform a set of tasks whenever source code is changed.
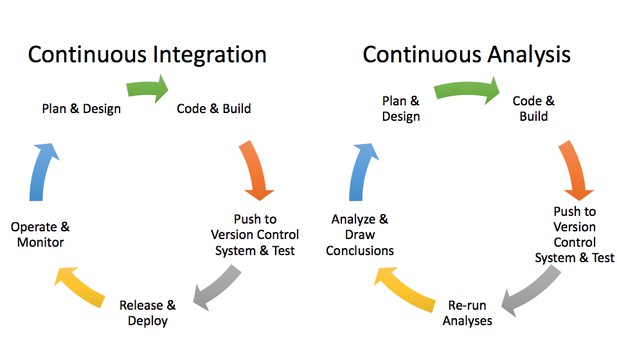
Applying continuous integration principles to research using continuous analysis. Brett Beaulieu-Jones.
We can apply these software engineering methods to computational biology via an approach termed “continuous analysis.” We built continuous analysis into our research workflow when we were working on a project together using neural networks to analyze phenotypic data. We wanted to be able to examine how changes in the source code and data resulted in changes in the output, and we wanted every step to be tracked and attributable.
Continuous analysis uses continuous integration software to perform computational experiments and automatically records their outputs (figures, results files, etc.) in a specific branch of the software repository. Analyses put into the continuous analysis framework are scripted, allowing them to be re-run. To make the analyses reproducible anywhere, automated systems are designed to capture the analysis itself (source code) alongside the input data and the computing environment.
This video shows Swipe being used to highlight changes in a figure after re-running the analysis.
The continuous analysis approach provides the means to make the steps along the way to a published project as transparent as the final result. The incremental steps, captured via commits in a source control system, are paired with the results. While the open access movement generally focuses on the final output, we think there are also substantial benefits to an open research process.
While it’s easiest to translate these principles directly to computational biology, we believe there are principles and tools that can be applied to many biological research fields, and are of broad interest to scientists in general. Anyone who produces scripts for data analysis that are used repeatedly (either in their own work, or by others) could capture outputs and changes to their work reproducibly using these tools, with the added benefits of efficiency, strong documentation, and clear attribution.
How we make our research reproducible using continuous analysis
We use continuous analysis tools in our open source lab management and manuscript construction. In software development, teams ensure they are working efficiently with regular meetings to understand their current focus and discuss any issues, much like frequent and interactive lab meetings. To replicate this, our lab built an automated scrum manager that creates and maintains issues for our lab’s scrum or "stand up" (https://github.com/greenelab/scrumlord) meetings.
Another system, manubot, (https://github.com/greenelab/manubot) enabled us to write an collaborative review that was open to all comers while tracking the contributions of each author (https://github.com/greenelab/deep-review) - we’ll discuss this more in a later post.
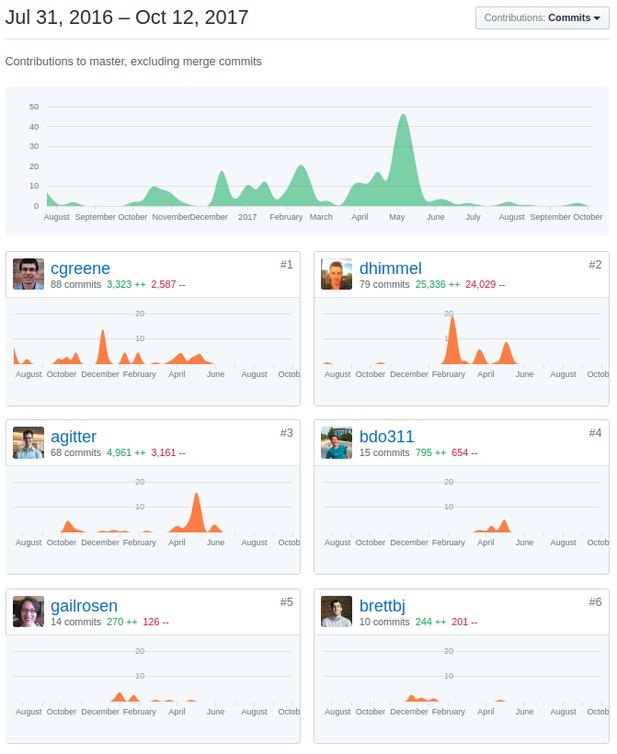
Manubot’s integration with github tracks the exact commits made in the project, allowing for exact attributions for each portion of the manuscript.
Other groups have also built examples of continuous analysis workflows for their software: Rob Patro’s group provides an example workflow with Salmon.
In order to help our continuous analysis process be easily and effectively replicated by others, we chose to use containerization. Imagine magically being able to save and distribute your lab bench at an exact point in time to anyone in the world. Containerization captures the computing environment we work in by packaging everything needed to run a piece of software (dependencies, files, environmental variables and settings) such that someone else can run the software on a separate machine.
A continuous integration system automates the analyses using the container. Combining containerization and continuous integration means the analysis, data and computing environment are all synchronized and shareable. As a result, we are able to release all the steps and results in a computational analysis for anyone, anywhere, to reproduce and easily build on. This avoids the extra work it takes to troubleshoot with a collaborator or reader when they wish to explore our research and use our methodologies, saving the community’s time.
What continuous analysis looks like in biology
We use this continuous analysis approach to output three artifacts from each analysis.
1. A container of the computing environment that was used. This is shared as an easily downloadable file, that can be downloaded and run with two commands. For example:
docker pull brettbj/daps
docker run -it brettbj/daps
2. Regenerated figures synchronized with code and data that produced them.
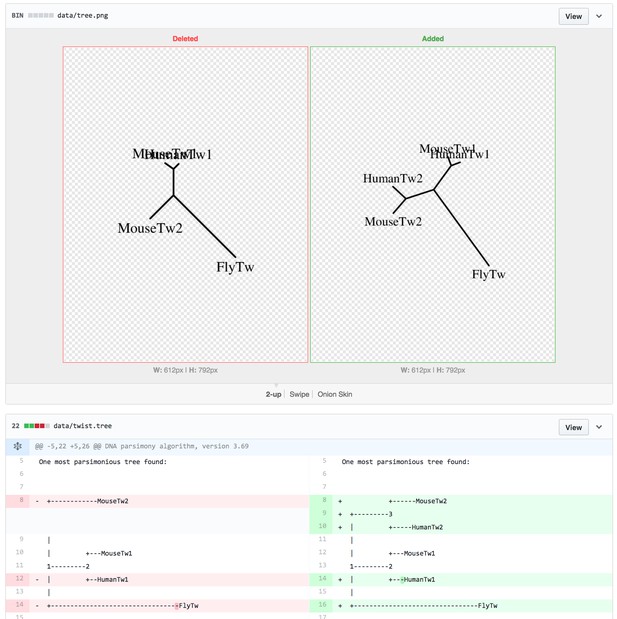
Changes in figures are synchronized with the code that generated them. Source: https://github.com/greenelab/continuous_analysis_phylo/commit/518fc9c446e7e1feb0f08e753a945e0b10adcdec.
3. Recorded logs show the steps that were run, the output that was produced and who performed this work.

Continuous integration services create logs of exactly was performed.
So far, we have used this approach to investigate the application of semi-supervised deep learning methods to Electronic Health Record data. Deep learning methods can be complex with many hyperparameters that need to be specified. Continuous Analysis allowed for easy comparison of results between different parameter settings. Throughout the review process we were able to point at these changes and clearly demonstrate how reviewer comments were addressed.
How you can improve the reproducibility and efficiency of your research
If you’d like to get started with continuous analysis, or continuous integration tools, we recommend you do the following:
- Use a version control system to conduct your research — we recommend GitHub (you can explore some of our repositories: https://github.com/greenelab).
- Design your analyses so that they can be run automatically as a script, such as a bash script that executes each step and saves results to files.
- Add continuous integration to run any software tests as well as the script from step two. You can explore our GitHub repository, which has examples for numerous continuous integration providers — for continuous integration, we like Travis CI, the open source drone software, and shippable.
This post builds on an article by the authors published in Nature Biotechnology, March 2017.
For the latest in innovation, eLife Labs and new open-source tools, sign up for our technology and innovation newsletter. You can also follow @eLifeInnovation on Twitter.
Do you have an idea or innovation to share on eLife Labs? Please send a short outline to innovation@elifesciences.org.


