Revealing the neural fingerprints of a missing hand
- University of Oxford, United Kingdom
- Radboud University Nijmegen, The Netherlands
- University College, United Kingdom
- Radboud University Medical Centre, The Netherlands
Figures
Figure 1 with 3 supplements
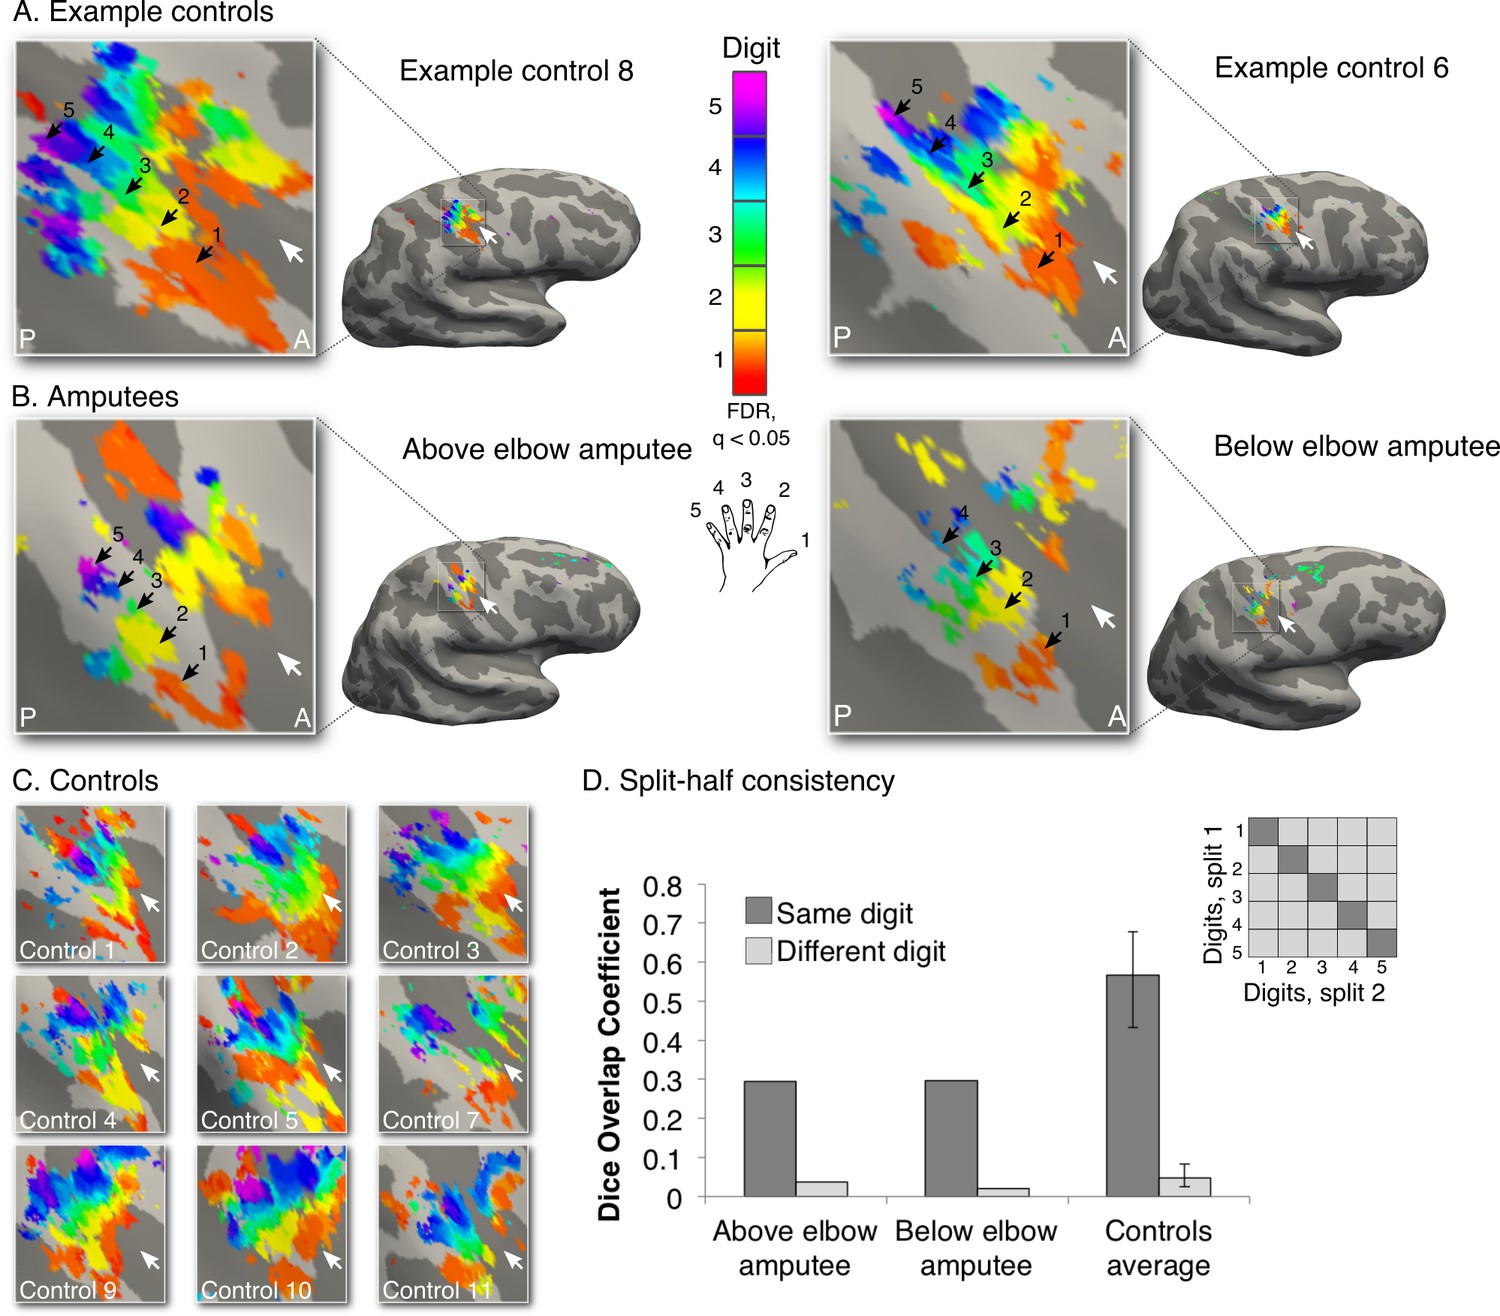
Missing hand maps revealed in amputees during phantom digits movement.
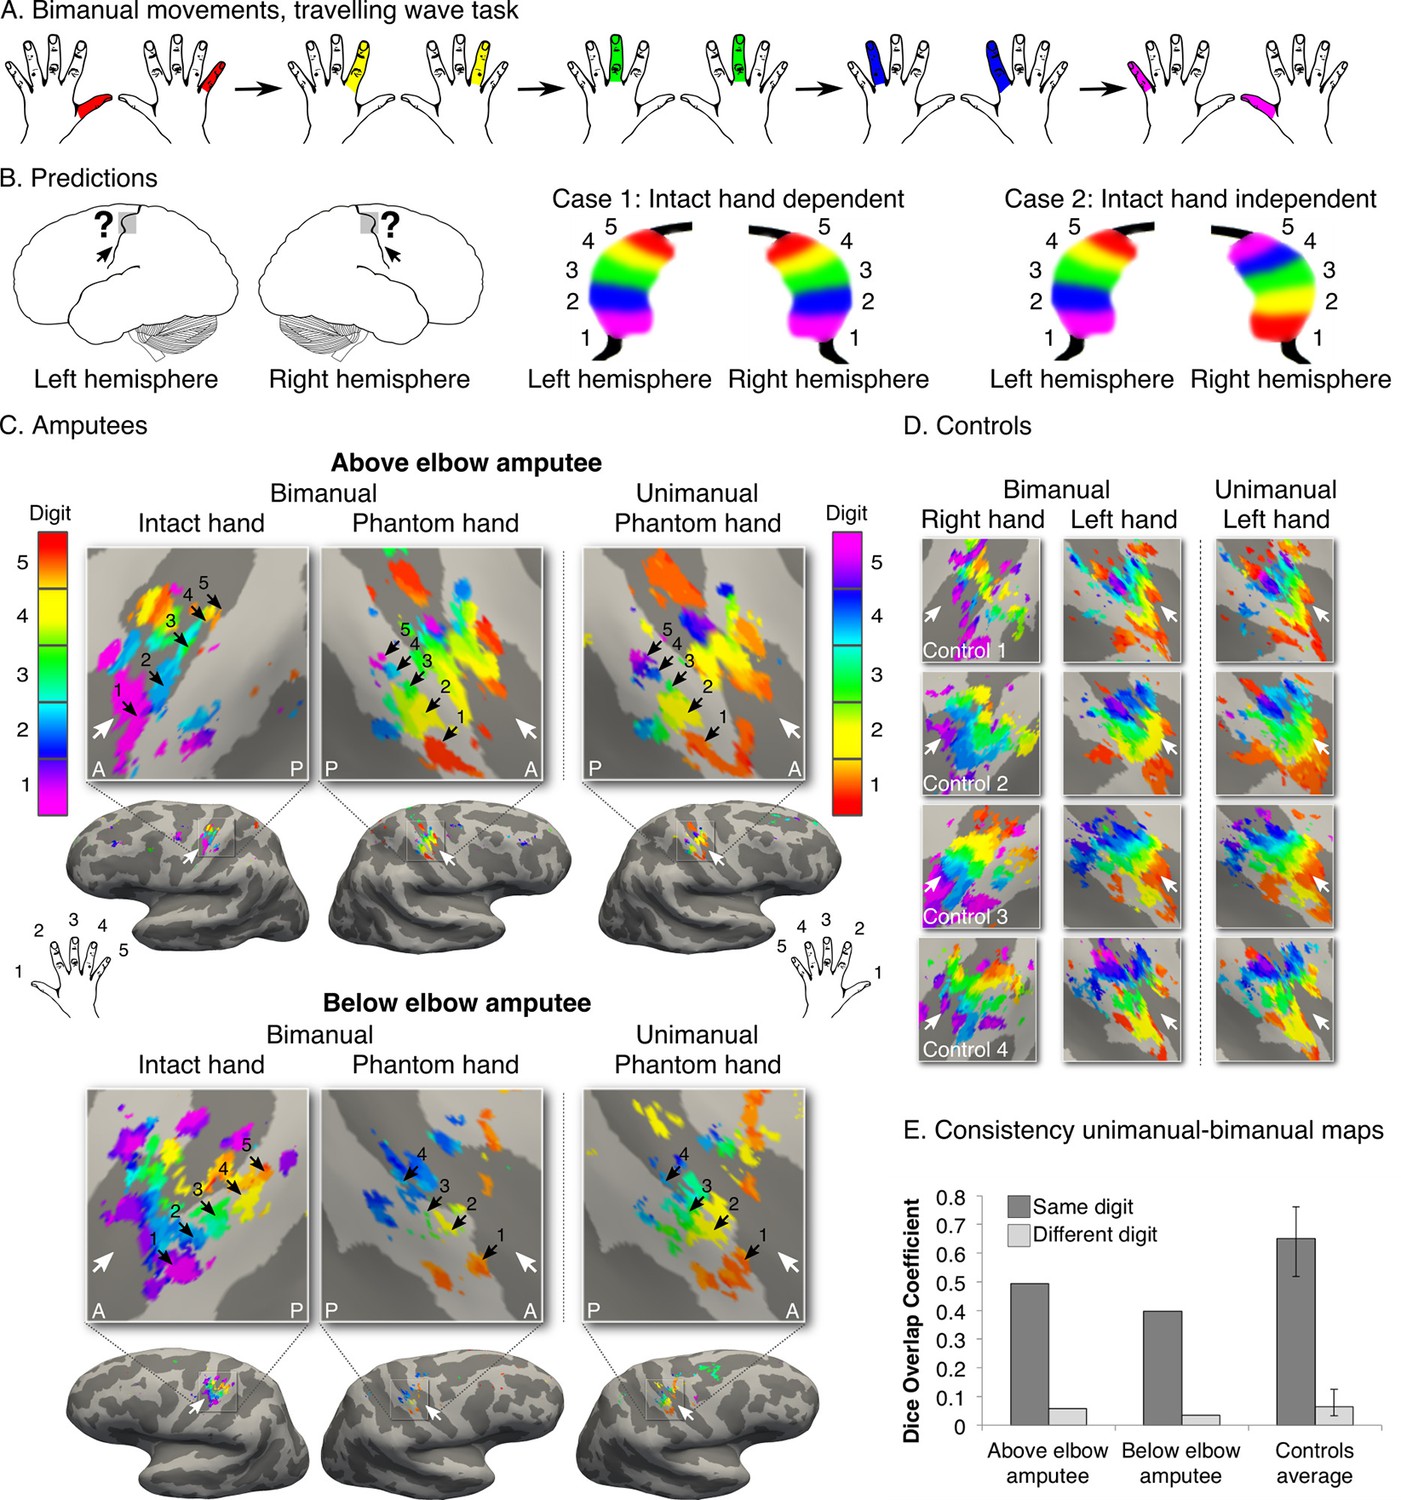
Black arrows indicate preference for digits 1–5: thumb (red); index (yellow); middle (green); ring (blue) and little finger (purple) in two-handed controls (A, C) and amputees (B). Participants performed single digit flexion and extension movements with their non-dominant (controls) or phantom hand (amputees) in a travelling wave paradigm. Qualitatively similar digit topographies were found in each amputee and the controls. White arrows indicate the central sulcus. A = anterior; P = posterior. Multiple comparisons were adjusted using false discovery rate (FDR). (D) Maps’ intra-individual split-half consistency, assessed using the Dice overlap coefficient. On average, 'same'-digit selective clusters (dark bars) showed greater consistency than 'different'-digit clusters (light bars) in amputees and controls. Amputees showed lower split-half consistency for 'same'-digit clusters (averaged across digits) compared to controls (95% confidence intervals (CI) = 0.43–0.68, as assessed using a bootstrap approach). However, amputees’ 'same'-digit clusters were more consistent than 'different'-digit clusters in controls (i.e. fell outside the CI of 'different'-digit clusters split-half consistency in controls), indicating that although reduced, the digit maps of the amputees were consistent.
-
Figure 1—source data 1
Amputee demographic and clinical details.
To measure phantom sensations, as well as other demographic and clinical details of potential relevance to the studied missing hand representation, amputees completed a range of questionnaires (e.g. amputation details, prosthesis usage etc.). Amputees rated intensities of phantom/stump pain and non-painful phantom sensations (vividness), using a 0 – 100 scale, as follows: (i) intensity of worst pain/vivid sensation experienced during the last week (or in a typical week involving such sensations); (ii) intensity of phantom pain on average over the last week (or in a typical week if last week was atypical); and (iii) current intensity/vividness of phantom pain and sensations, during the scanning day. Phantom limb pain magnitude was calculated by dividing worst pain intensity by pain frequency (1- all the time; 2- daily; 3- weekly). An analogous measure was obtained for vividness of non-painful phantom sensations. This approach represented the chronic aspect of the phantom pain/sensation as it combines frequency and intensity (Makin et al., 2013a). We also asked the amputees whether they experienced telescoping, a common phenomenon where the perceived length of the phantom limb is changed (Flor and Nikolajsen, 2006). Amp. = amputation; Amp. level = amputation level measured in percentages: (residual arm length/intact arm length) x 100. Intact arm length is measured from shoulder to fingertips, where 41% is equivalent to the level of the elbow and 75% is equivalent to the level of the wrist; PLS = phantom limb sensations; mag. = magnitude; scan = score of sensation phantom limb vividness/pain intensity on scanning day (scale 0 – 100); PLP = phantom limb pain; ave. = score of average phantom limb pain in a typical week (scale 0 – 100); prosthetics usage = prosthetic limb usage (frequency): 0- never, 1- rarely, 2- occasionally, 3- daily, 4- more than 4 hours a day, 5- more than 8 hours a day; Y. = yes; N. = no.
- https://doi.org/10.7554/eLife.15292.004
-
Figure 1—source data 2
Phantom digits movement vividness, difficulty and quality.
Amputees were asked to rate how vivid the phantom movement felt (PDS = phantom digit sensation; scale 0 – 100; ranging from unable to feel movement to movement is felt as vividly as the sensation of movement elicited by the intact hand digits). In addition, amputees were asked to rate how difficult it was to perform each phantom digit movement (diff. = difficulty; scale 0 – 100; ranging from easy to impossible). Finally, participants were asked to rate the quality and extent of movement afforded by each phantom digit. Amputees’ answers were standardised as follows: 1- full range of movements (i.e. equivalent to movements with the homologous digit on the intact hand). 2– near to full range of movement (i.e. similar to movement of the intact hand, though reduced). 3– noticeably less range of movement compared to the intact hand (i.e. partial finger flexion and extension movement).
- https://doi.org/10.7554/eLife.15292.005
Figure 1—figure supplement 1
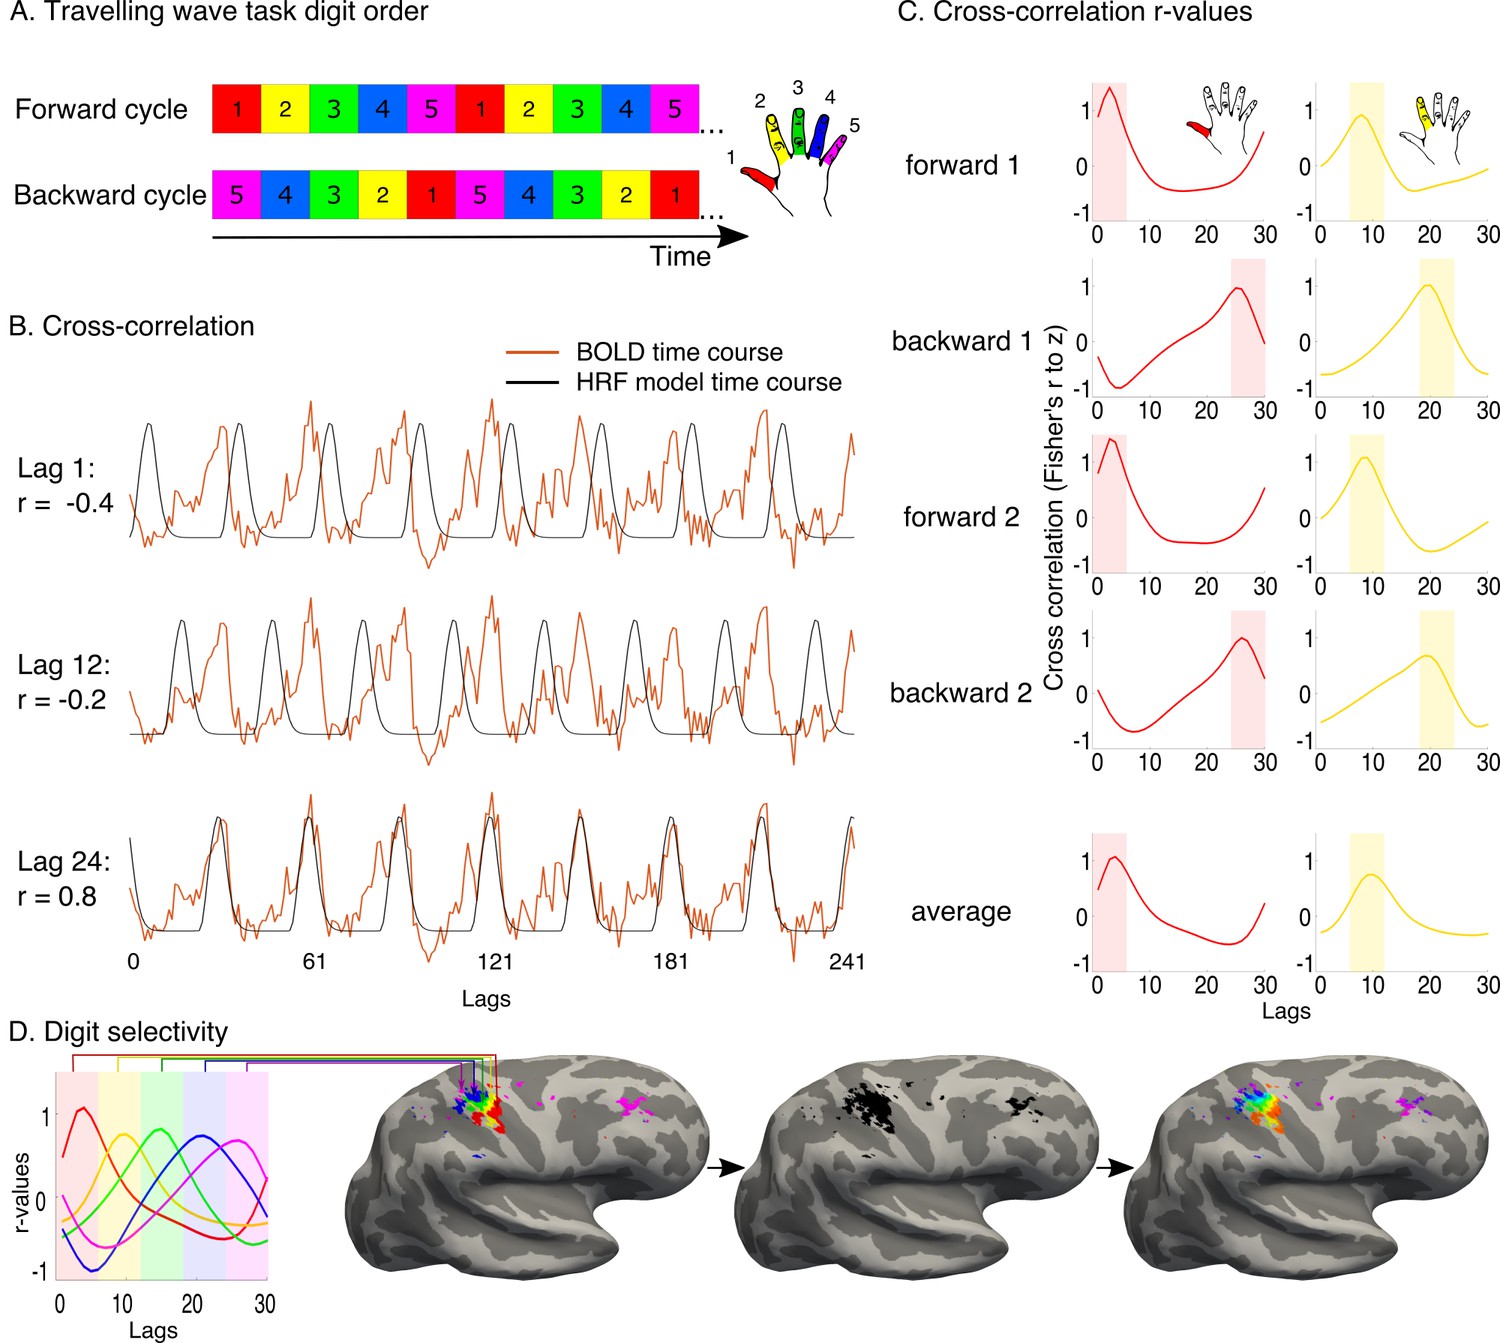
Travelling wave task and analysis.
A travelling wave paradigm, involving digit movements in a set sequence, was used to capture digit preference and the smooth progression of adjacent digit representations in primary somatosensory cortex. (A) The travelling wave task involved 8 repeated cycles of continuous individual digit movements. Each 45 s cycle consisted of five 9 s blocks dedicated to each digit (as exemplified by the coloured squares), with each run cycling through either D1-D2-D3-D4-D5 (forward, top) or D5-D4-D3-D2-D1 (backward, bottom). Each of the forward and backward runs was repeated twice. The numbers 1–5 and colours correspond to the five digits, as visualised in the right side of the panel. (B) Preprocessed BOLD time courses from individual voxels (the example time course of one voxel is shown in red) were cross-correlated against a reference model. The model corresponded to a single-digit movement (9 s ‘on’, 36 s ‘off’- the period of movement of all other digits), and was systematically shifted in time to model activity throughout a full cycle (30 shifts, corresponding to the 30 lags of the 45 s cycle). The figure shows three different model lags (1, 12 and 24), resulting in varying cross-correlation outcomes. Lag 24 was the optimal model lag for this preprocessed BOLD time course. (C) The standardised r-values (Fisher’s r-to-z, y-axis) resulting from the cross-correlation were plotted as a function of lag (x-axis) for each individual voxel in each run. In the left panel, cross-correlation values from the example voxel shown in B are plotted for each of the four runs. The optimal fit for the voxel is demonstrated by the peak cross-correlation (digit 1, in the left panel; digit 2 in the right panel, taken from separate voxels). Lags associated with the same digits were averaged, first within and then across runs. A winner-take-all approach was used to determine digit preference, based on the highest average r-value, resulting in five separate digit maps. False discovery rate (FDR) was applied for each of these single digit maps to adjust the threshold based on the criterion q (FDR) < 0.05. (D) Each of the five digits was assigned a colour code, as demonstrated on the left. The five digit maps were projected to the cortical surface, to display digit preference maps. Note that no masking was applied when presenting the resulting maps. Within the resulting five-digit map a gradient of progression across digits was visualised, based on the voxel-wise r-values for each of the 30 lags. The resulting map was located in the central sulcus and postcentral gyrus, corresponding to the primary somatosensory cortex, around the anatomical hand knob.
Figure 1—figure supplement 2
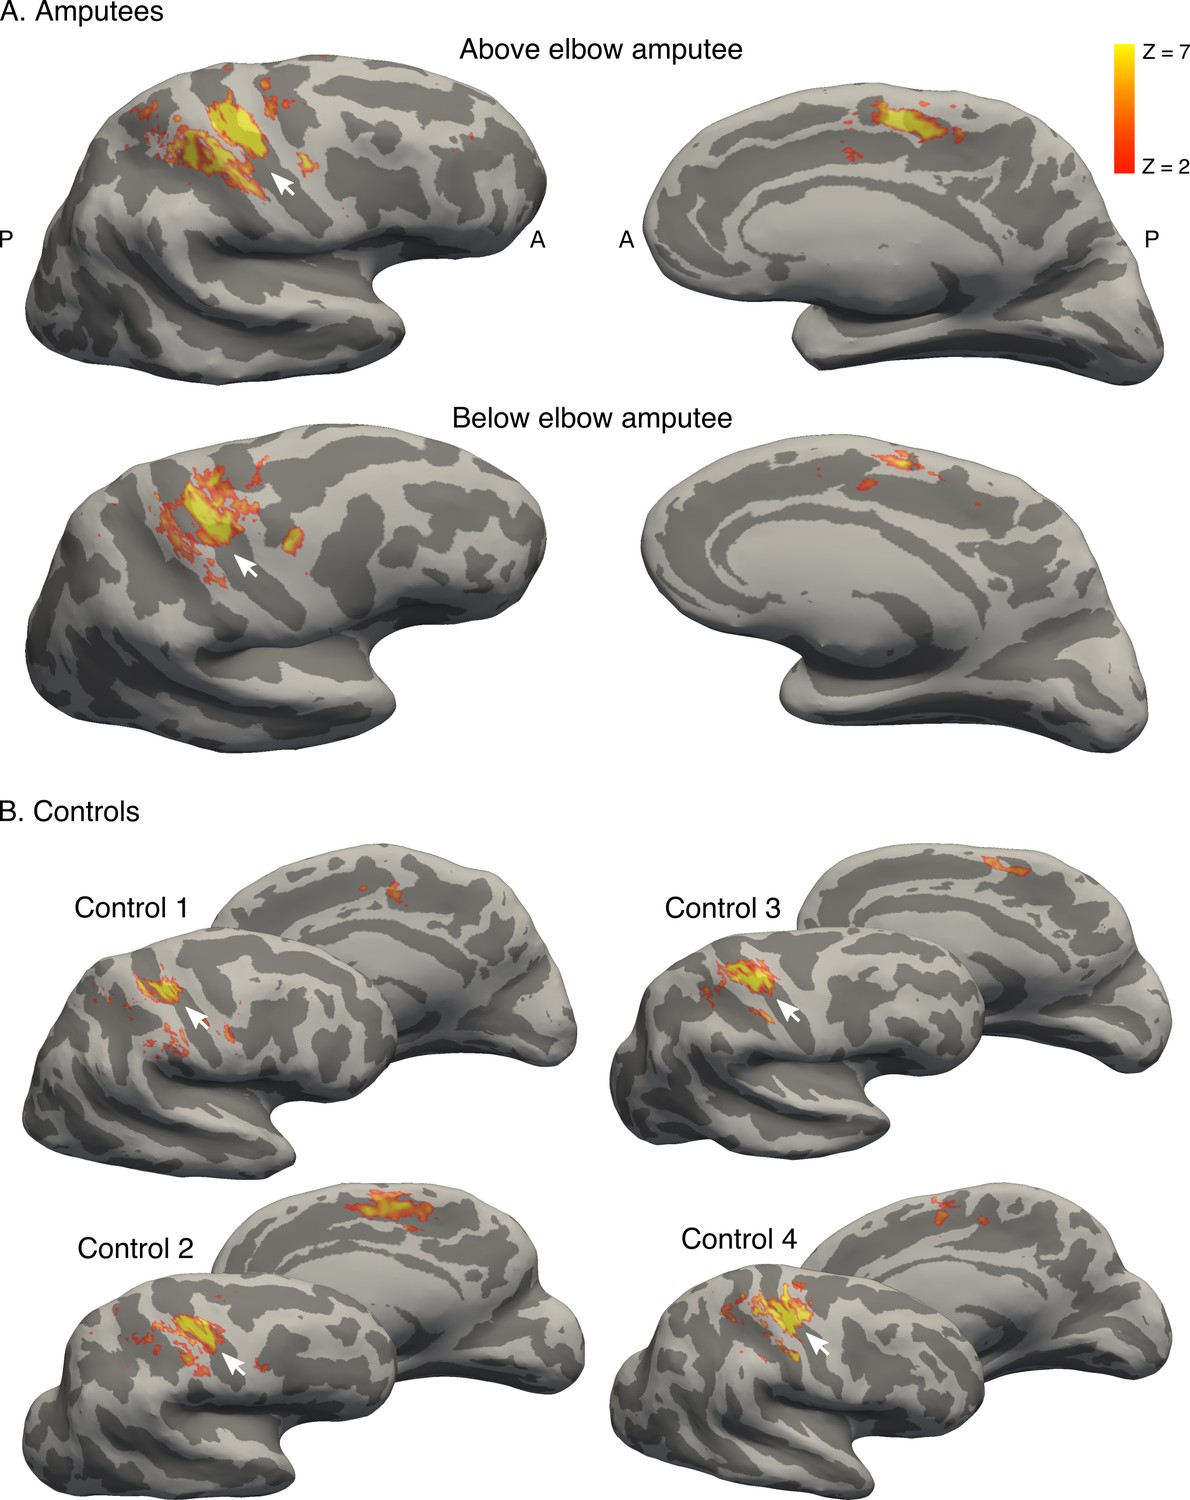
Brain areas activated by phantom hand movement.
Contrast between phantom (amputees; A) or left (controls; B) hand movements and baseline (rest) in the block design, projected on cortical surfaces of the contralateral hemisphere. Analysis was performed using a standard 2-level general linear model. Amputees and controls showed activation in primary somatosensory and motor cortex (S1 and M1, respectively; left panel), as well as in the supplementary motor area (SMA, right panel). Note that more inferior areas (e.g. secondary somatosensory cortex) were not covered by the partial field of view utilised for the ultra high-field acquisition. White arrows indicate the central sulcus. A = anterior; P = posterior. Displayed activations were thresholded at Z > 2. These results show that phantom hand movements activate a network of brain areas normally associated with hand movement.
Figure 1—figure supplement 3
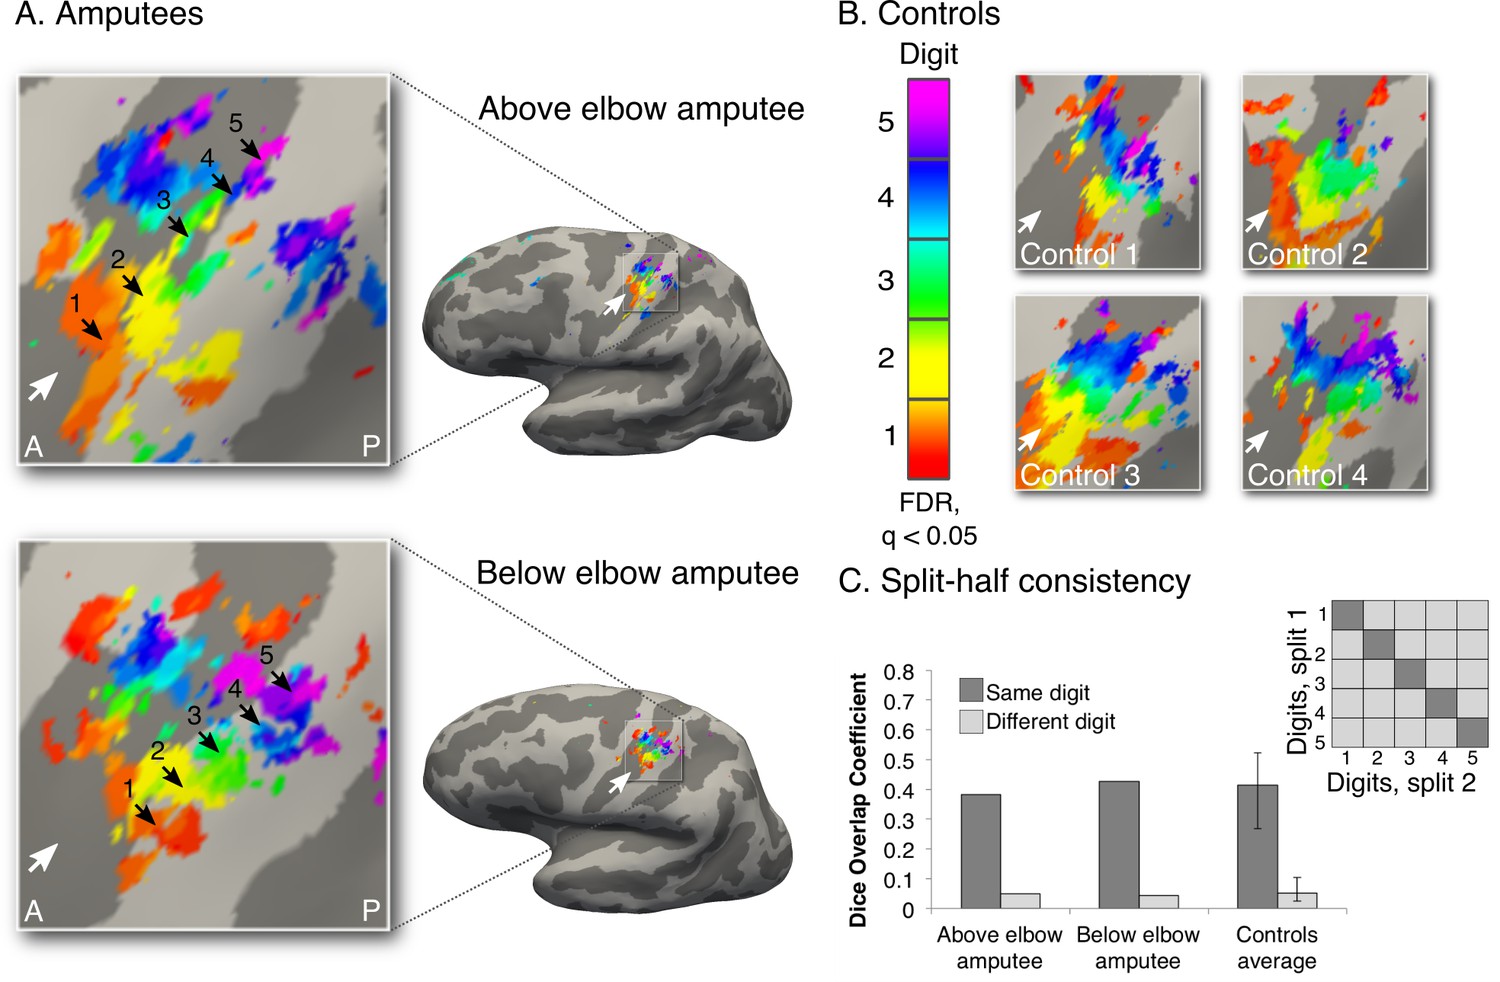
Intact hand maps in amputees.
In order to visualise standard topography in the amputees’ somatosensory cortex, topographic mapping was also carried out for the intact hand. For this purpose, task demands were adjusted to optimally activate the somatosensory cortex. Participants were provided with tactile feedback via a MRI-compatible button-box (manufactured in house), placed on the participant’s torso for the duration of the scan. Participants pressed the button box with the relevant digit using a travelling wave paradigm (Figure 1—figure supplement 1). Since this task did not involve any difficulty for the amputees, as it only consisted of moving digits of the intact hand, all participants were paced to perform button press movements with individual digits at a set (1 Hz) frequency, as indicated by the flashing of the corresponding circle at the specified rate. A forward and backward sequence was employed in separate runs. Each of the forward and backward runs was repeated twice, for a total duration of 25 min and 40 s. All other procedures and analysis were as described in the main analysis for the missing hand digit maps (Figure 1). The black arrows indicate preferences for digits 1–5: thumb (red); index (yellow); middle (green); ring (blue) and little finger (purple) for the intact hand in amputees (A) and two handed controls (B). White arrows indicate the central sulcus. A = anterior; P = posterior. Multiple comparisons were adjusted using false discovery rate (FDR). (C) Intra-individual split-half consistency was assessed using the Dice overlap coefficient for the digit maps. 'Same'-digit selective clusters (dark) showed significantly greater consistency than 'different'-digit clusters (light) in amputees and controls. Error bars indicate 95% confidence intervals. Note that the organisation, extent and consistency of the digit maps qualitatively resembled the left (missing) hand maps (obtained using self-paced digit flexion and extension) found in both controls and amputees (Figure 1).
Figure 2 with 1 supplement
Missing hand maps are replicated during dissociated bimanual hand movements.
(A) In the bimanual task, individuals performed paired digit movements with both hands, resulting in reversed digit cycles between the hands. The colour code indicates the cycle lag as shown in (A). Symmetrical colour gradients across the two hemispheres would reveal the missing hand map as dependent on intact hand movements (B: case 1). Colour gradient reversal across hemispheres indicates dissociated hand representations (B: case 2), as was seen in both amputees and controls (C, D respectively, left two panels). Maps contralateral to the missing hand (left hand in controls) resembled the unimanual task maps (Figure 1), both qualitatively (C, D, right panel) and quantitatively, using the Dice overlap coefficient (E). The digit maps were adjusted for multiple comparisons using false discovery rate (FDR). Other annotations are as in Figure 1.
Figure 2—figure supplement 1
Over-representation of the intact hand in the missing hand territory.
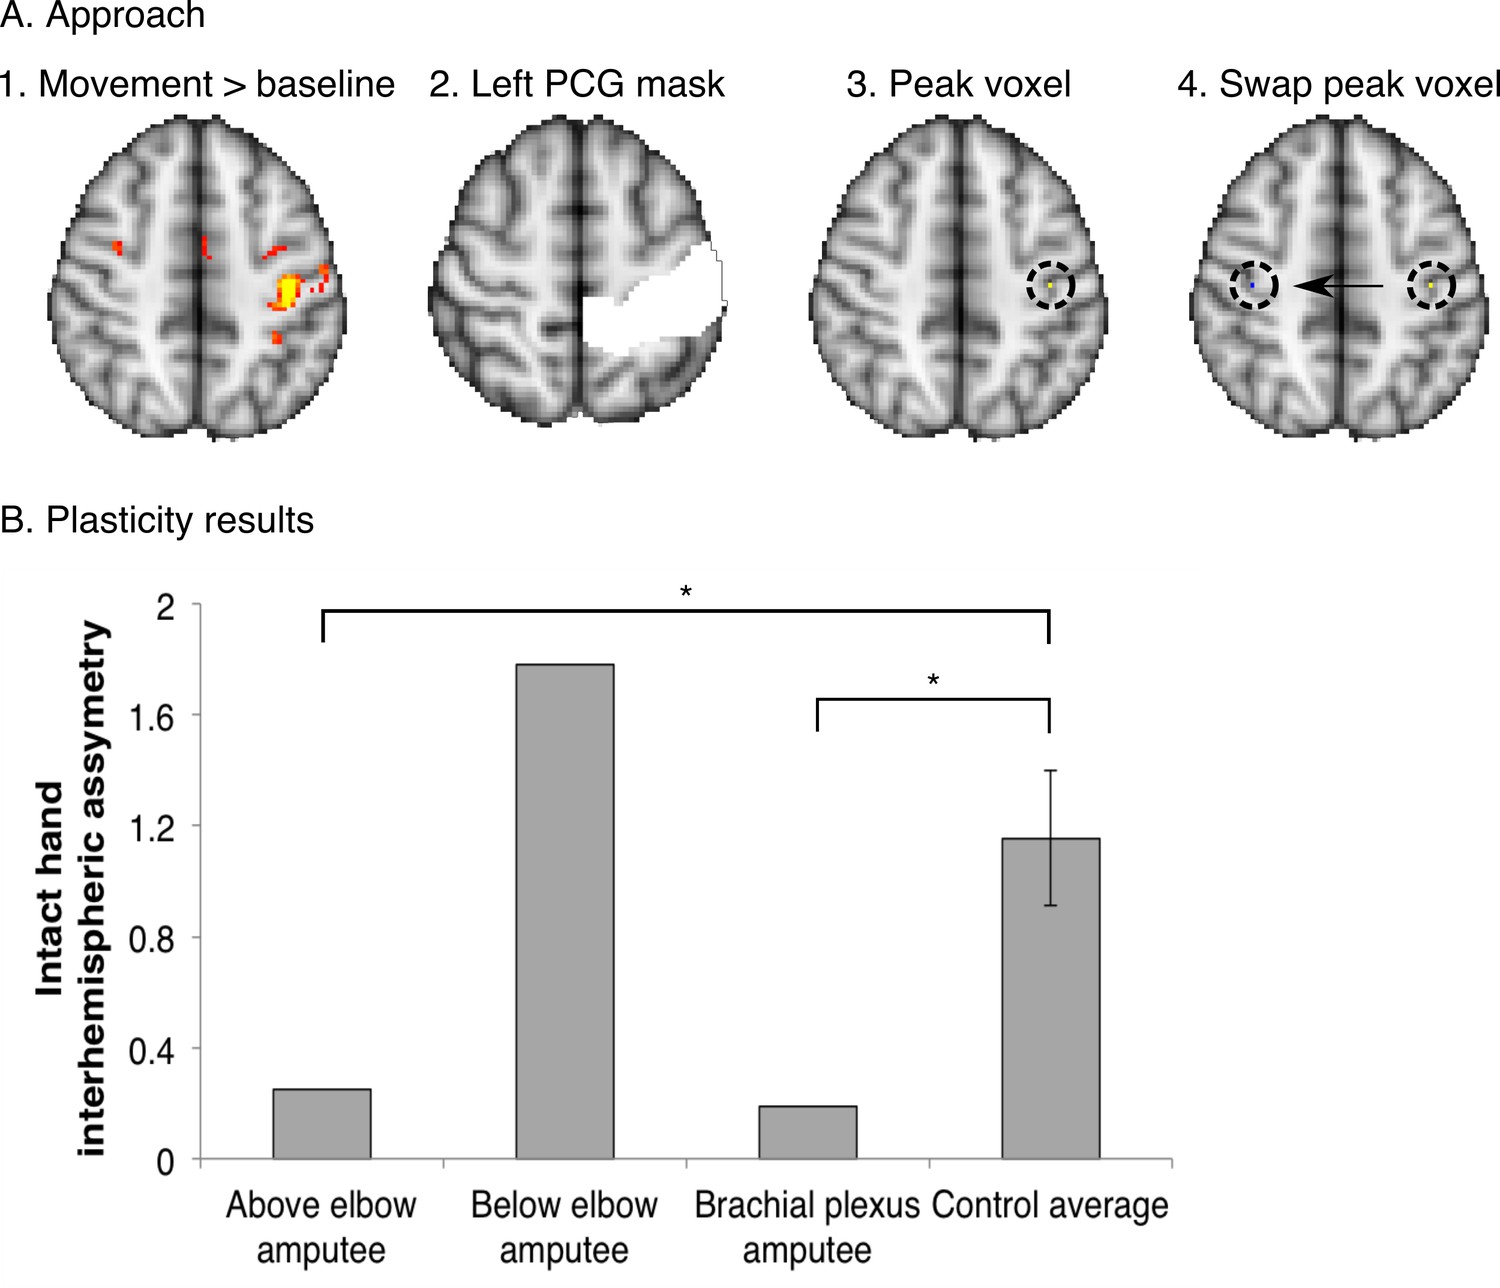
To investigate whether the observed missing hand maps (Figure 1, Figure 4) were preserved despite reorganisation of displaced inputs (as reported previously [Makin et al., 2013b]), we quantified intact hand representation in the territory of the missing hand in the amputees participating in the current study. For this purpose, we employed an independent dataset, acquired using standard field neuroimaging (acquisition parameters were identical to those described for the standard field imaging in the materials and methods section, with the exception of the number of acquisition volumes). (A) Participants were cued to perform movements with their intact hand (simultaneous flexion and extension of all five digits), or dominant hand in controls (n = 15), as part of a block-design protocol, used to identify body-part representations (see [Makin et al., 2013b] for details of a similar protocol). This movement condition was contrasted against a baseline (rest) period and standardised (z) beta values during intact/dominant hand movements were extracted from the peak voxel within a postcentral gyrus (PCG) mask in the contralateral hemisphere. To identify the estimated position of the missing hand territory, this peak voxel was mirror flipped on the axial plane, and the standardised beta value for intact hand activity was extracted from this ROI in the ipsilateral hemisphere. (B) To assess asymmetry in intact hand activity across the two hemispheres, the following inter-hemispheric asymmetry index was calculated for each of the three amputees and 15 controls individually: (contralateral hemisphere – ipsilateral hemisphere) / (contralateral hemisphere + ipsilateral hemisphere). Higher values of this index indicate that the activity pattern for the intact hand was greater in the contralateral, compared to the ipsilateral, sensorimotor hand area, as found was in the control participants. Lower values in this index represent less asymmetry, resulting from (relatively) higher activity in the ipsilateral hand area during intact hand movements. Error bars indicate 95% confidence intervals. The above elbow and brachial plexus amputees showed significantly lower asymmetry than controls (one-tailed Crawford and Howell t-test [Corballis, 2009]; t(14) = −1.84, p = 0.04; and t(14) = −1.96, p = 0.04 respectively). The below elbow amputee showed a high asymmetry value, similar to controls (one-tailed Crawford and Howell t-test (Corballis, 2009); t(14) = 1.26, p = 0.11). This indicates that two of the tested amputees show over-representation of their intact hand in the missing hand territory, as previously reported (Makin et al., 2013b). These results suggest that the missing hand maps can be preserved while reorganisation of displaced inputs from the intact hand has taken place.
Figure 3 with 1 supplement
Amputees show characteristic inter-digit overlap patterns during phantom digit movements.
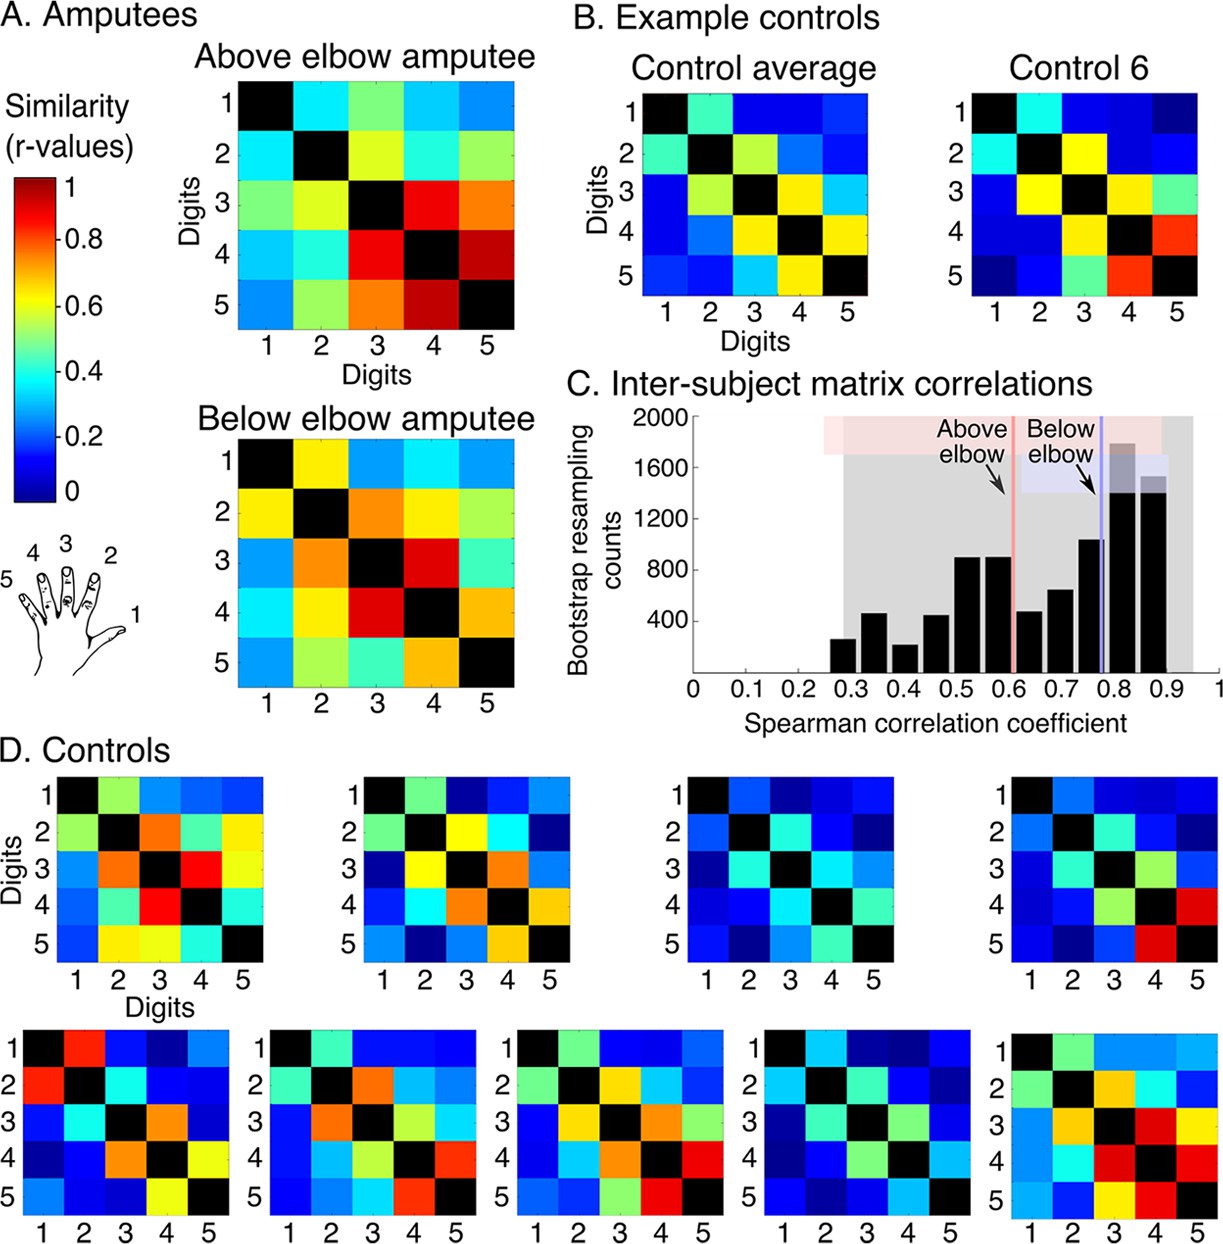
Inter-digit representational similarity of multivoxel patterns underlying the maps shown in Figure 1, derived from a block-design paradigm in amputees (A) and controls (B, D). Similarity (or overlap) is decreased between non-neighbouring digits and tends to increase between digits 3–5, as shown in the controls’ averaged matrix. (C) Positive distribution of inter-subject correlations, between controls’ inter-digit overlap patterns. The grey area indicates the 95% confidence interval (CI) for controls. Pink and blue lines indicate average amputee-to-controls correlations for above and below elbow amputees respectively. Pink and blue shaded areas indicate the corresponding 95% CIs. Both amputee-to-controls correlation averages fell within the normal controls-to-controls correlation range, suggesting that the amputees exhibited a characteristic pattern of inter-digit overlap.
Figure 3—figure supplement 1
Intact hand inter-digit overlap in amputees.
In order to visualise standard topography in the amputees’ somatosensory cortex, inter-digit representational similarity was assessed for multivoxel patterns underlying the right (intact) hand maps shown in Figure 1—figure supplement 3 in amputees (intact hand, A) and controls (dominant hand, B). To estimate inter-digit representational similarity for the intact hand, the same blocked design as described in the materials and methods section missing hand inter-digit overlap was used. Tactile feedback (from the button box) was incorporated into the task to optimally activate the somatosensory cortex. Participants were instructed to perform single digit button presses (using an MRI-compatible button-box manufactured in house) with their right intact (amputees) or right dominant (controls) hand at a 1 Hz frequency. To cue the participant which digit should be moved, the circle corresponding to this digit flashed at the specified 1 Hz rate. Digits 1–5: thumb; index; middle; ring and little finger.
Figure 4

Topography is preserved despite the absence of peripheral input.
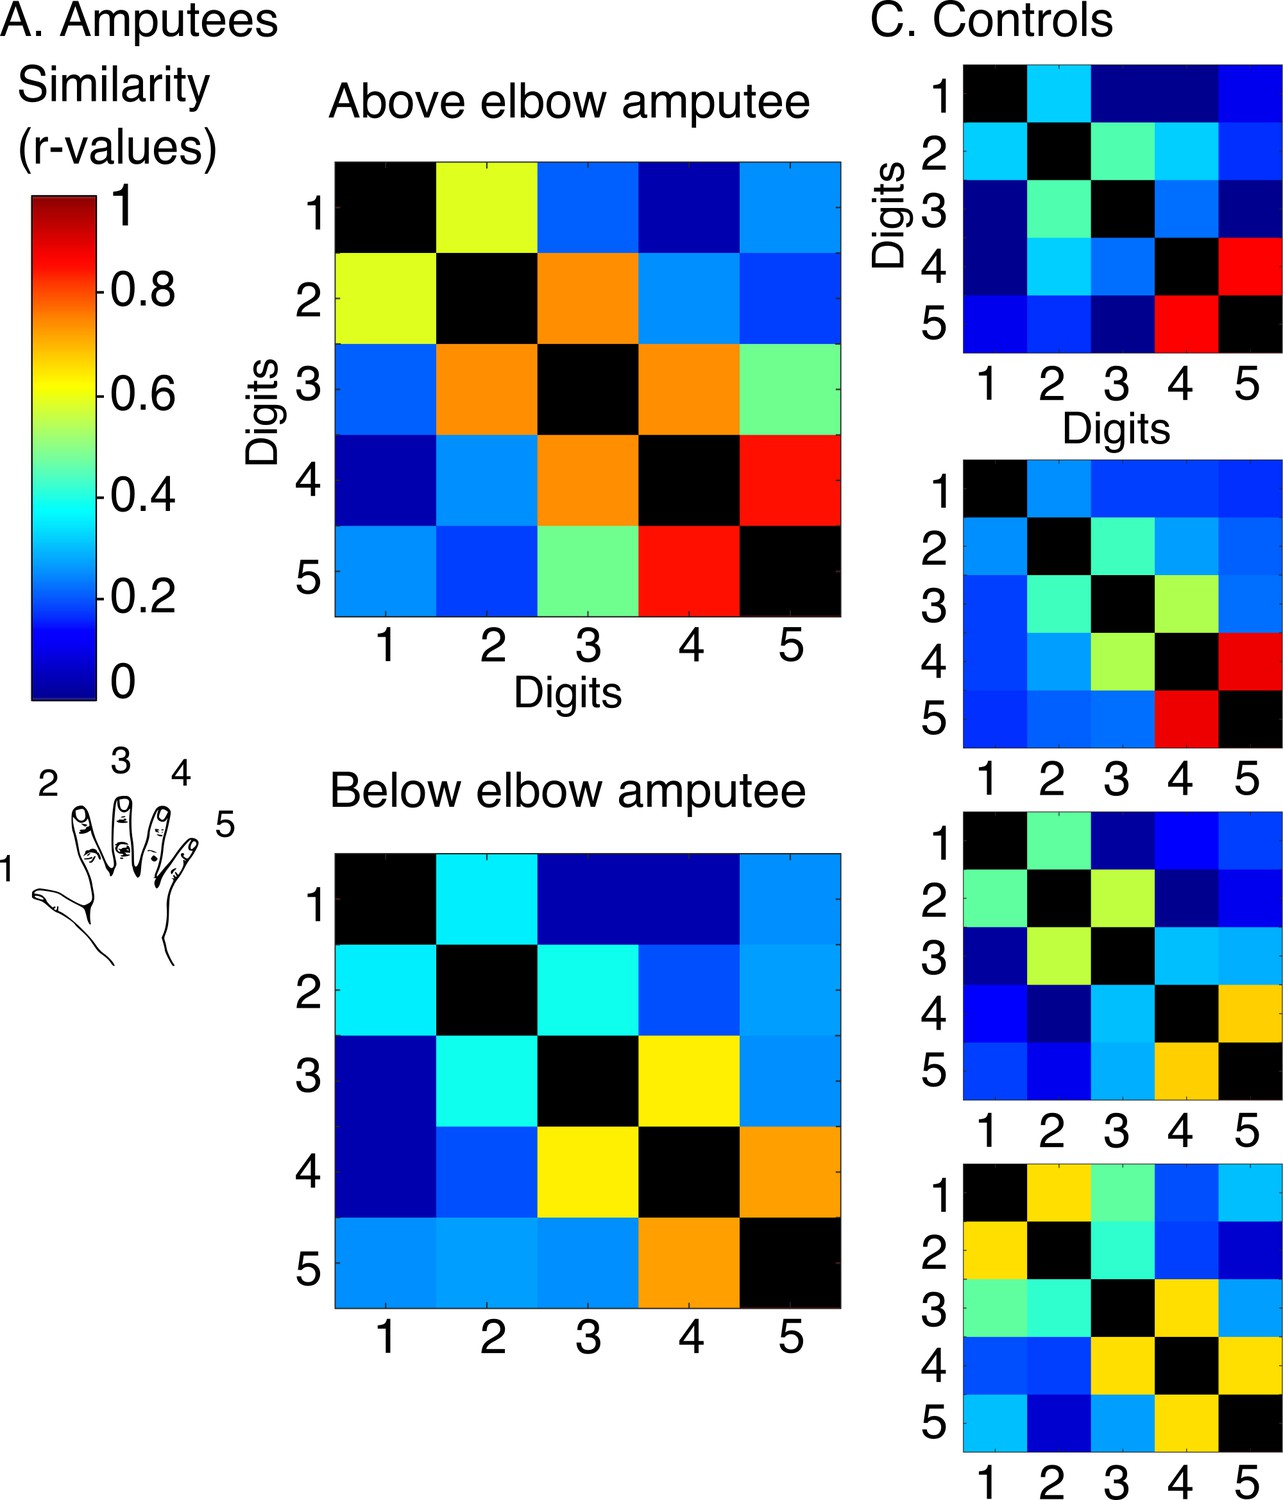
To rule out the potential contribution of peripheral inputs from the injured nerve to preservation of the phantom hand map, we tested an upper-limb amputee suffering from brachial plexus avulsion injury with vivid kinaesthetic phantom digit sensations. This injury involves the tearing of the nerve from its attachment at the spinal cord, abolishing afferent inputs and efferent outputs to the residual limb. 3 tesla MRI was used here due to safety restrictions, meaning that standard field digit preference maps were acquired. The bimanual travelling wave task (A, Figure 2) elicited maps in the controls with reversed colour gradients (B - left 2 panels). In comparison to the ultra high-field left hand maps (right panel), the standard field left hand maps were cruder (e.g. less digit specificity, B - middle panel). (C) The brachial plexus amputee showed two maps with reversed colour gradients, comparable to those found in controls. The map in the missing hand hemisphere showed preference for digits in primary somatosensory cortex. (D) Inter-digit representational similarity was assessed for multivoxel patterns underlying the missing hand map. The correlation value of the brachial plexus amputee’s inter-digit overlap pattern with the controls exemplified in Figure 3 fell within the normal controls-to-controls correlation range. Together, these results suggest that preserved representation of the missing hand existed independently of peripheral inputs. Other annotations are as in Figure 1.
Additional files
-
Supplementary file 1
Runs acquired for each participant.
- https://doi.org/10.7554/eLife.15292.014
Download links
A two-part list of links to download the article, or parts of the article, in various formats.
Downloads (link to download the article as PDF)
Open citations (links to open the citations from this article in various online reference manager services)
Cite this article (links to download the citations from this article in formats compatible with various reference manager tools)
Revealing the neural fingerprints of a missing hand
eLife 5:e15292.
https://doi.org/10.7554/eLife.15292


