The Natural History of Model Organisms: The fascinating and secret wild life of the budding yeast S. cerevisiae
- University of Nice Sophia Antipolis, France
Figures
Figure 1
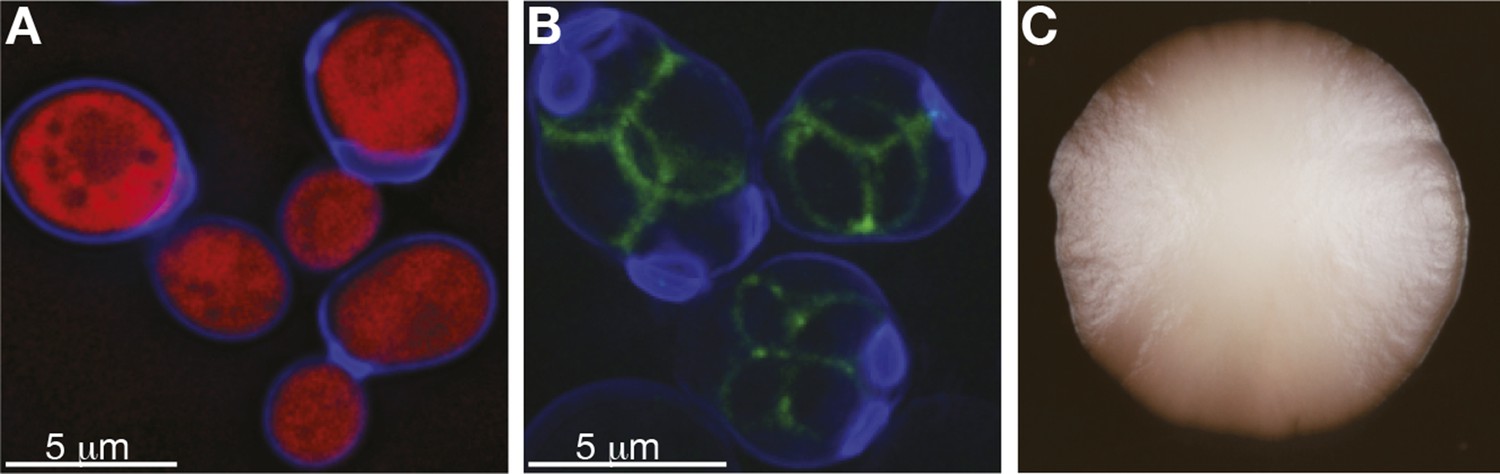
S. cerevisiae yeast: single cells and as a population.
(A) Budding cells of the reference (S288c) strain of S. cerevisiae, expressing red fluorescent protein (RFP), which marks the centre of the cell. The cells are also stained with calcofluor-white, which stains the outer walls of the cells blue. (B) Sporulating cells of the North American oak S. cerevisiae isolate YPS606, stained with calcofluor-white, in which the protein SPS2 is labelled with GFP (Gerke et al., 2006), which marks the ascospore wall in green. (C) A clonal colony with a population size of approximately 7 × 10⁶ cells derived from a single S. cerevisiae cell grown on a solid agar medium. Such colony structures have never been observed in the wild. Image credits: Benjamin Barré and Gianni Liti.
Figure 2
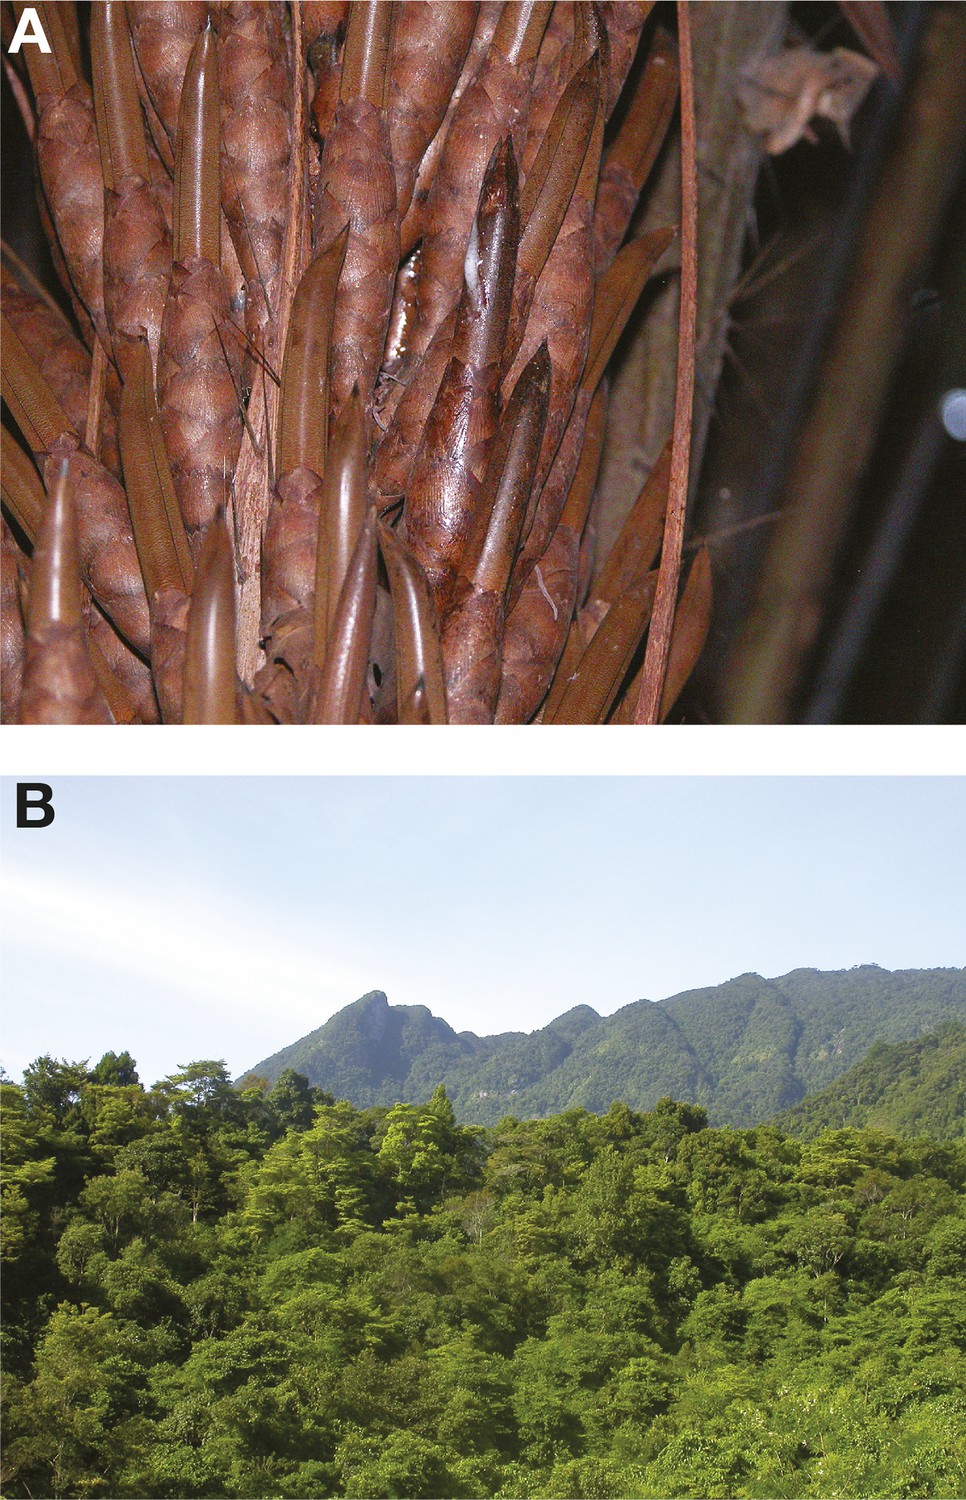
Emerging wild ecological niches of S. cerevisiae.
(A) A close-up of a fermenting bertam palm bud; the Malaysian S. cerevisiae lineage has been isolated from these palms (Wiens et al., 2008). Malaysian S. cerevisiae strains are reproductively isolated due to a complex series of rearrangements. (B) A primeval rainforest in the tropical highland of Hainan where the highly diverged Chinese lineages (CHN-I, CHN-III and CHN-V) have been isolated (Wang et al., 2012). Image credits: (A) Marc-André Lachance; (B) Feng-Yan Bai.
Figure 3

S. cerevisiae genome relationships and population structure.
(A) A phylogenetic tree of S. cerevisiae isolates, adapted from (Wang et al., 2012). The main worldwide and Chinese lineages (denoted, CHN I-V) are highlighted. Lineages CHN-I, CHN-III, CHN-V were mostly isolated from Fagaceae trees in the rainforest of the tropical Hainan Island in the South China Sea. Lineages CHN-II and CHN-IV were isolated from temperate areas in north China (Shaanxi province and Beijing province, respectively). (B) Sequence similarity plots of the Y55 and SK1 laboratory strains showing the relationships to the five, worldwide genetically distinct lineages (listed on the right) along chromosome II. Similarity is defined as N/(D+1), where N is the number of positions in a chromosomal window and D is the number of those positions where the nucleotides differ. The genomes of both Y55 and SK1 are mostly derived from the West African lineage (red line). However, large blocks of the chromosome show drops in similarity to the West African lineage and higher similarity to other lineages. Y55 has three segments (0–50 kb, around 400 kb, from 650 kb to the right telomere) with high similarity to the Wine/European genome (yellow line). Likewise, SK1 has a large segment (650–750 kb) with higher similarity to the Sake lineage (light green line). This type of analysis has revealed the mosaic genome structure of many S. cerevisiae isolates (Liti et al., 2009). Image credit: Anders Bergström and Gianni Liti.
Download links
A two-part list of links to download the article, or parts of the article, in various formats.
Downloads (link to download the article as PDF)
Open citations (links to open the citations from this article in various online reference manager services)
Cite this article (links to download the citations from this article in formats compatible with various reference manager tools)
The Natural History of Model Organisms: The fascinating and secret wild life of the budding yeast S. cerevisiae
eLife 4:e05835.
https://doi.org/10.7554/eLife.05835


