Multidimensionality of tree communities structure host-parasitoid networks and their phylogenetic composition
- CAS Key Laboratory of Zoological Systematics and Evolution, Institute of Zoology, Chinese Academy of Sciences, China
- CAS Key Laboratory of Mountain Ecological Restoration and Bioresource Utilization & Biodiversity Conservation Key Laboratory of Sichuan Province, Chengdu Institute of Biology, Chinese Academy of Sciences, China
- College of Biological Sciences, University of Chinese Academy of Sciences, China
- College of Pharmacy, Guizhou University of Traditional Chinese Medicine, China
- International College, University of Chinese Academy of Sciences, China
- Entomologie, Staatliches Museum für Naturkunde Stuttgart, Germany
- Ecological Networks, Technical University Darmstadt, Germany
- State Key Laboratory of Vegetation and Environmental Change, Institute of Botany, Chinese Academy of Sciences, China
- Department of Nature Conservation and Landscape Ecology, Albert-Ludwigs-University Freiburg, Germany
- Forest Nature Conservation, University of Göttingen, Germany
- Institute of Biology/Geobotany and Botanical Garden, Martin Luther University Halle-Wittenberg, Germany
- National Key Laboratory of Animal Biodiversity Conservation and Integrated Pest Management, Institute of Zoology, Chinese Academy of Sciences, China
- State Key Laboratory of Integrated Pest Management, Institute of Zoology, Chinese Academy of Sciences, China
Figures
Figure 1 with 2 supplements
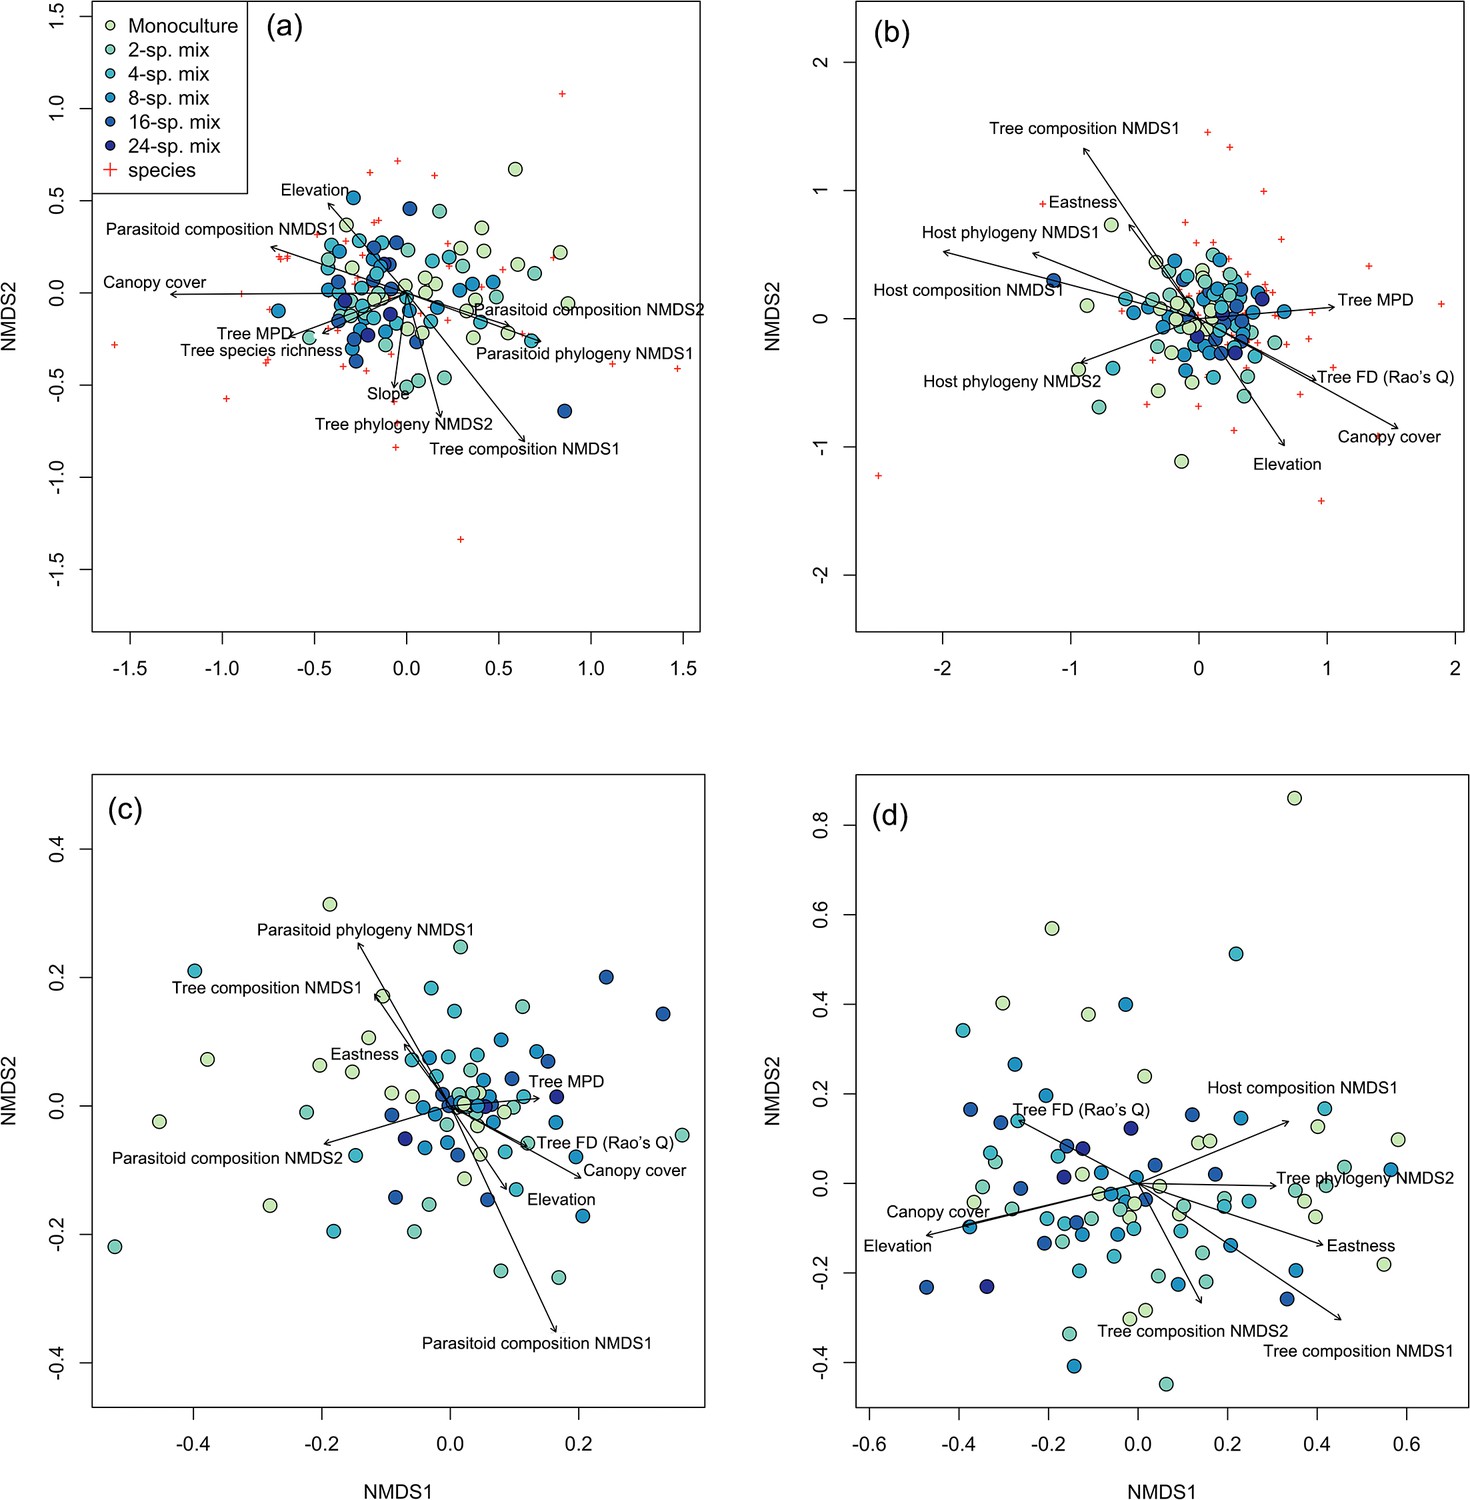
Associations among tree, host, and parasitoid species and phylogenetic composition.
Ordination plot of the nonmetric multidimensional scaling (NMDS) analysis of (a) host species composition, (b) parasitoid species composition, (c) host phylogenetic composition, and (d) parasitoid phylogenetic composition across the study plots (filled circles) in the BEF-China experiment. Stress = 0.23, 0.23, 0.24, and 0.20, respectively. Arrows indicate significant (at p<0.05) correlations of environmental variables with NMDS axis scores. Lengths of arrows are proportional to the strength of the correlations. Red crosses refer to the host or parasitoid species in each community. See Supplementary file 1b–e in the Supplementary Materials for abbreviations and statistical values.
Figure 1—figure supplement 1
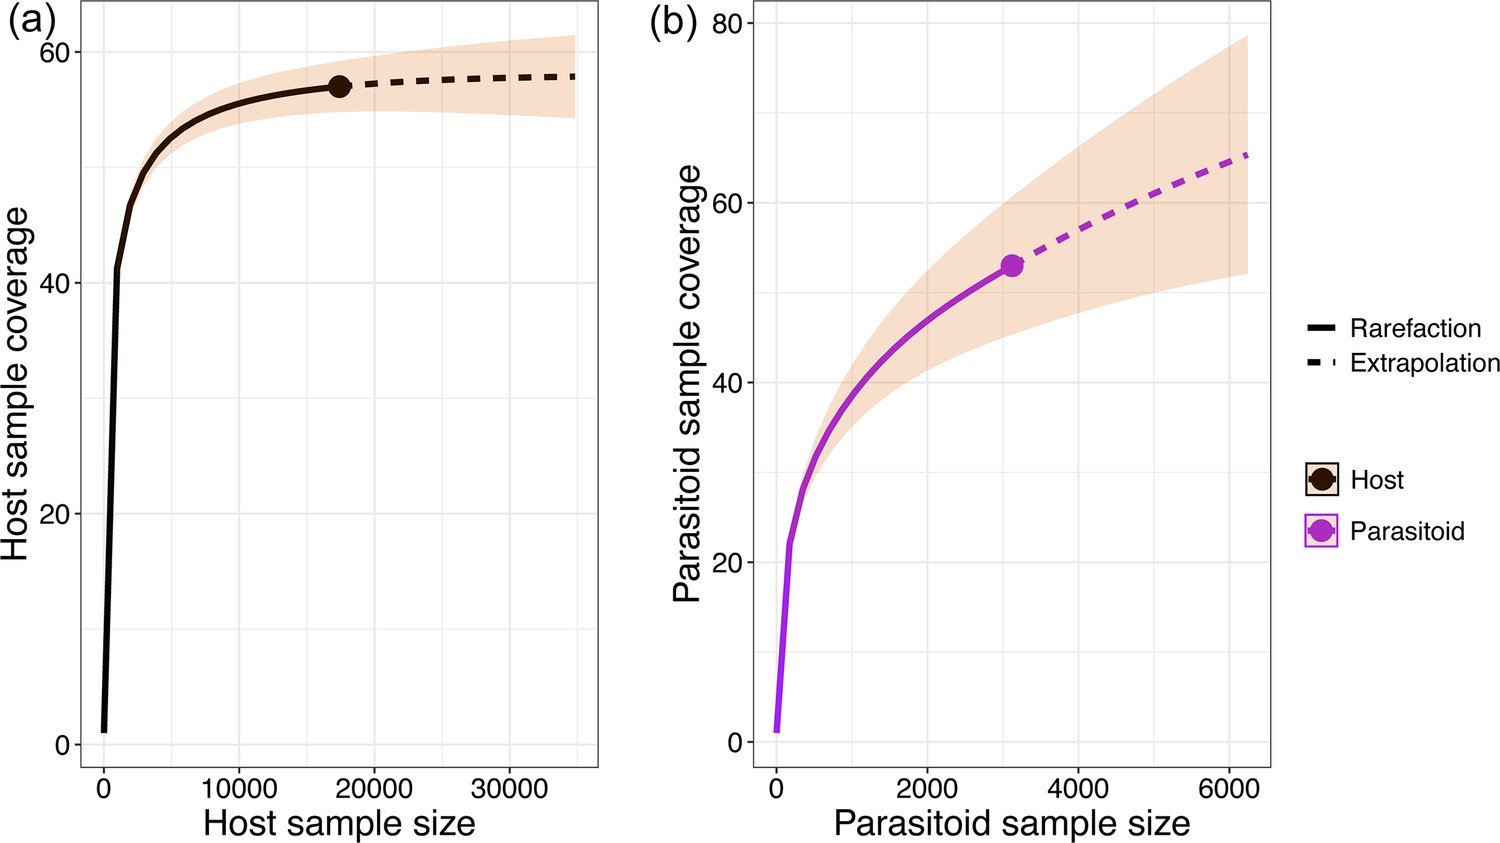
Sampling completeness assessment.
The sample coverage across different sample sizes for (a) hosts and (b) parasitoids.
Figure 1—figure supplement 2
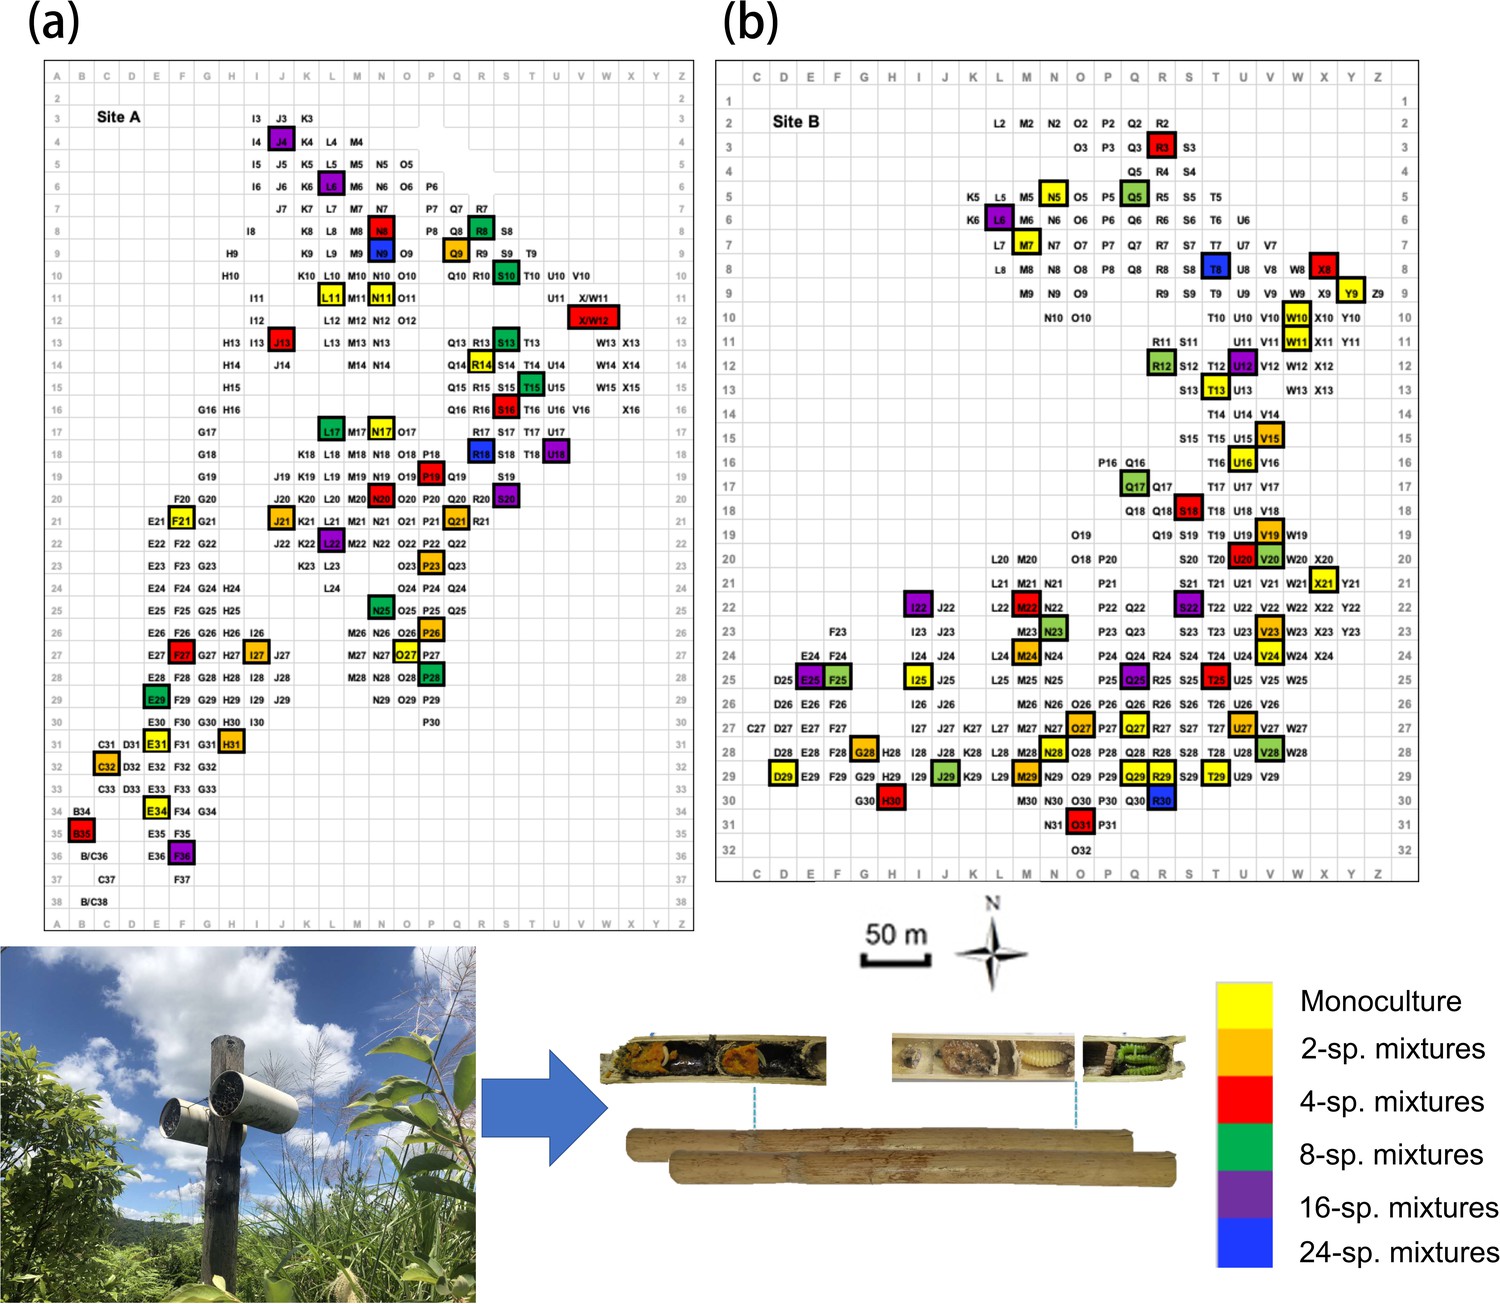
Overview of the study plot distribution along the two experimental tree diversity sites of BEF-China (a: Site A, b: Site B).
Levels of tree species richness indicated by color. Each study plot had a size of 25.8 m × 25.8 m.
Figure 2 with 1 supplement
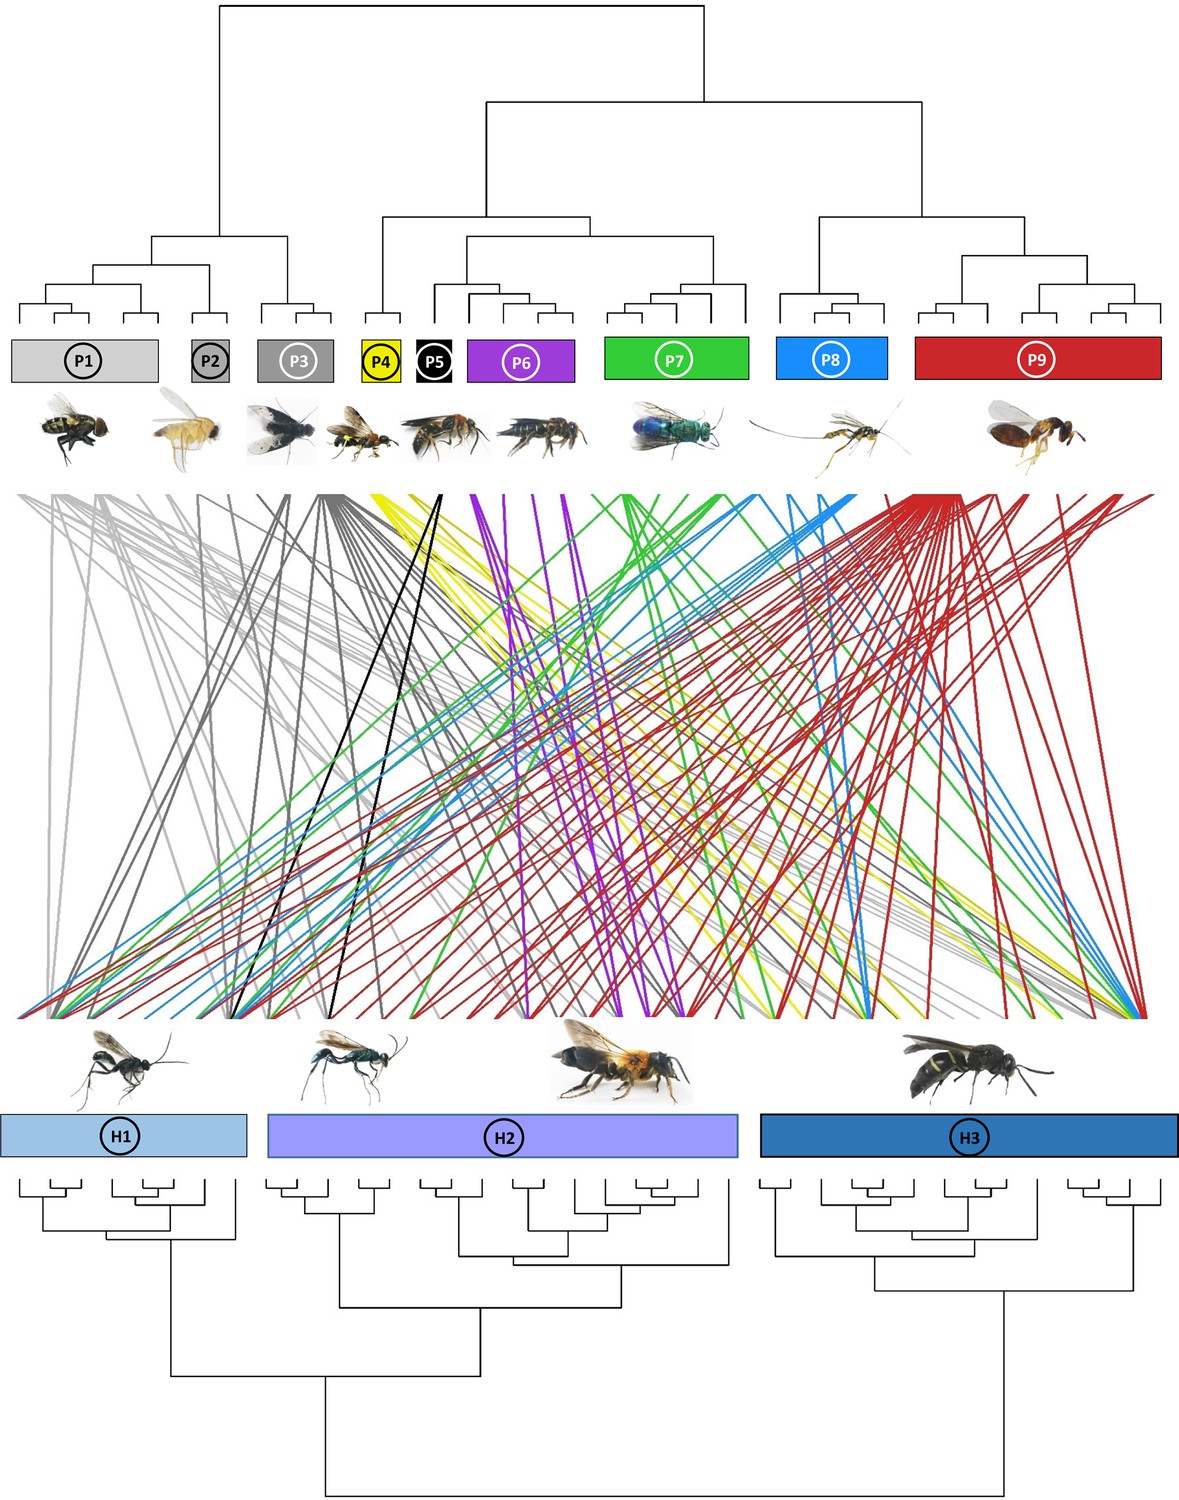
Dendrogram of phylogenetic congruence for the host species (below) and associated parasitoid species (above) recorded in the study.
Each rectangle represents a different superfamily (for host species) or family (for parasitoid species). H1: Pompilidae, H2: Apoidea, H3: Vespidae; P1: Sarcophagidae, P2: Phoridae, P3: Bombyliidae, P4: Trigonalyidae, P5: Mutillidae, P6: Megachilidae, P7: Chrysididae, P8: Ichneumonidae, P9: Chalcidoidea. The trophic network of hosts and parasitoids was nonrandomly structured (parafit test: p=0.032). Host and parasitoid species names are given in Figure 2—figure supplement 1.
Figure 2—figure supplement 1
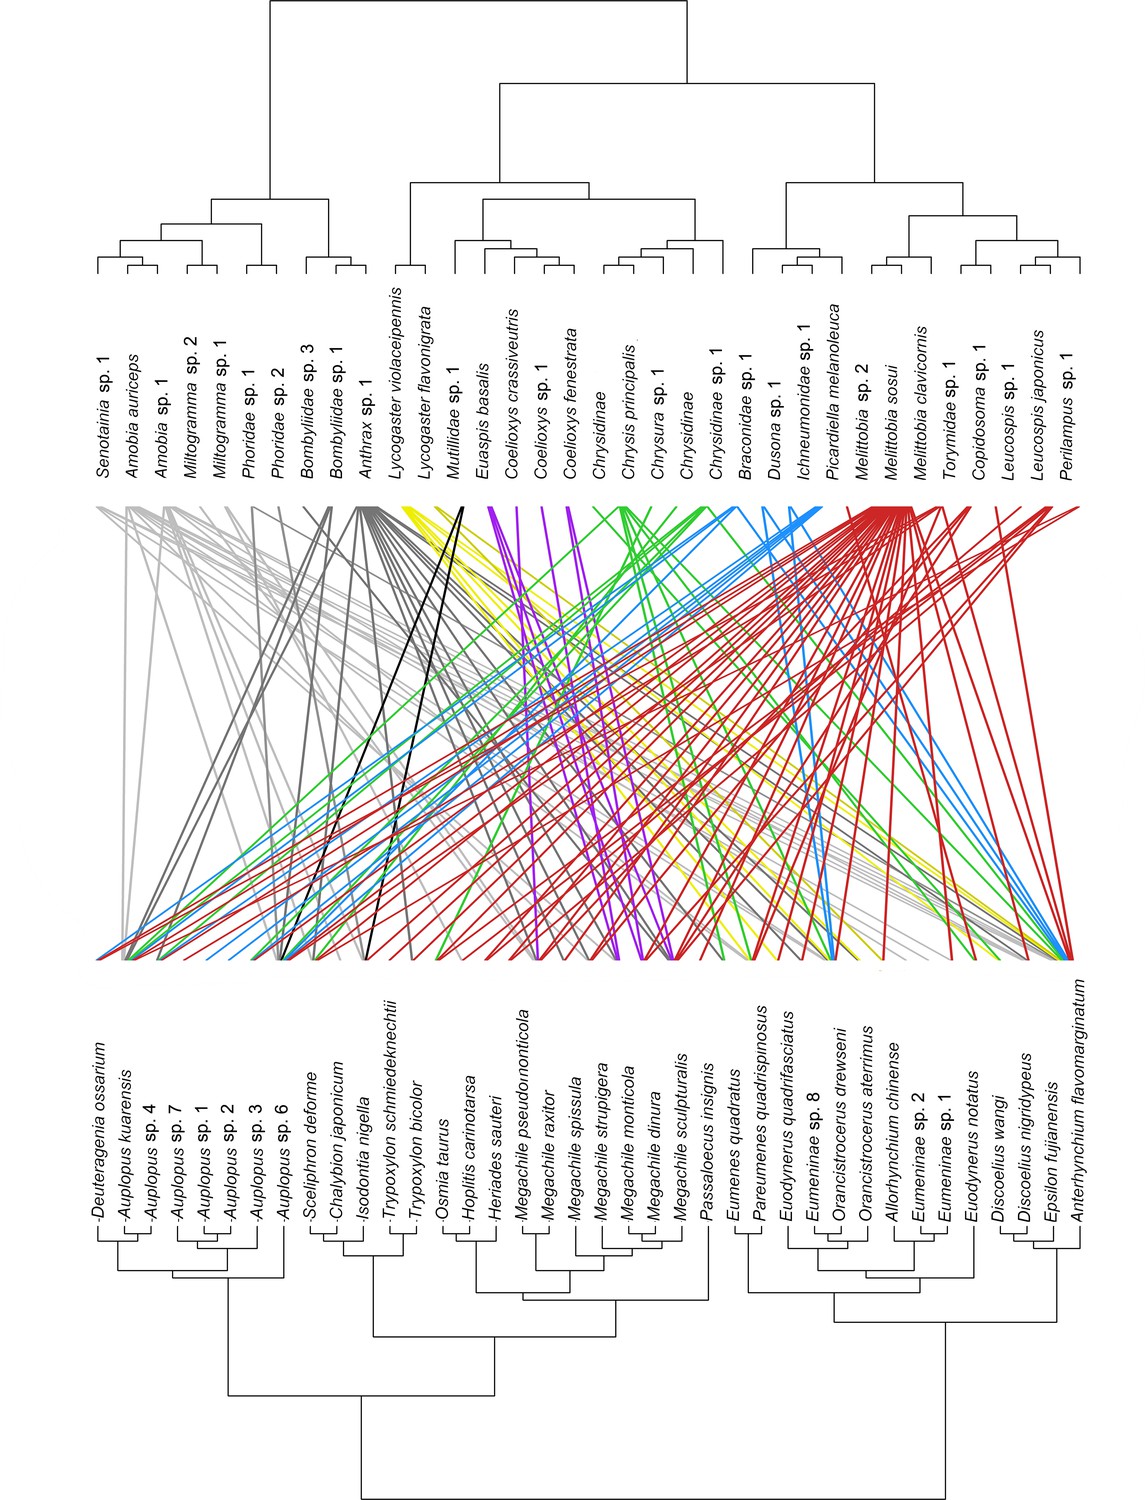
Dendrogram of phylogenetic congruence for the host species (below) and associated parasitoid species (above) recorded in the study, showing the species name for hosts and parasitoids.
Figure 3 with 1 supplement
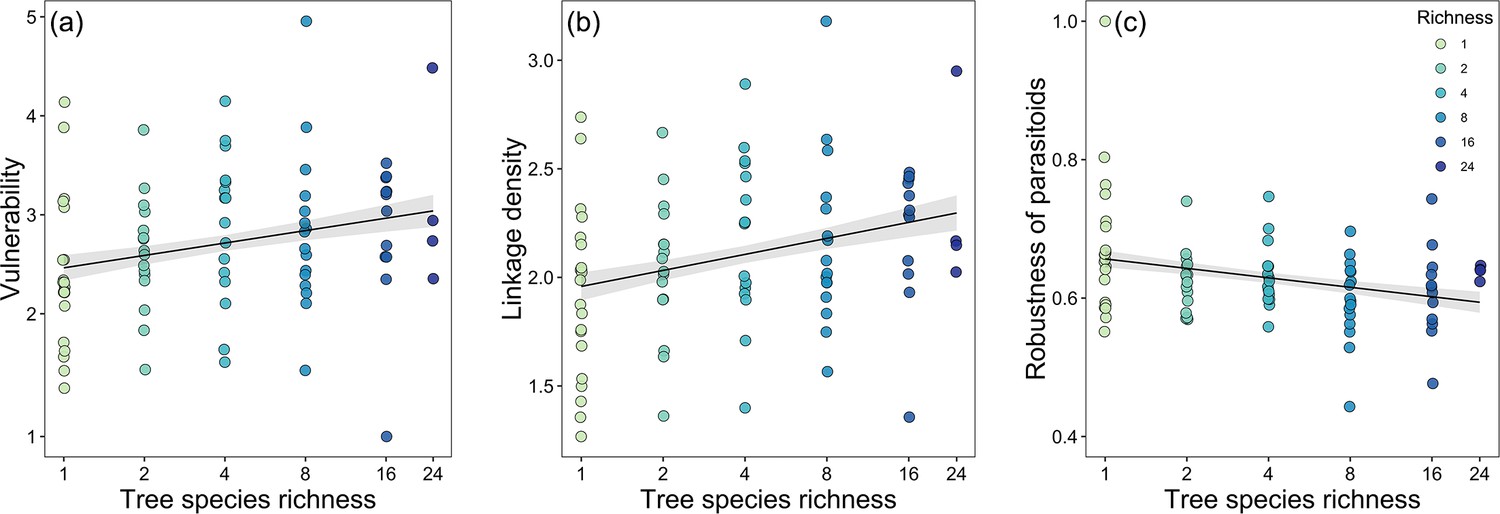
Bivariate relationships between tree species richness and network indices.
Community-level relationships of network between tree species richness and (a) vulnerability, (b) linkage density, and (c) robustness of parasitoids.
Values were adjusted for covariates of the final regression model. Regression lines (with 95% confidence bands) show significant (p<0.05) relationships. Note that axes are on a log scale for tree species richness.
Figure 3—figure supplement 1
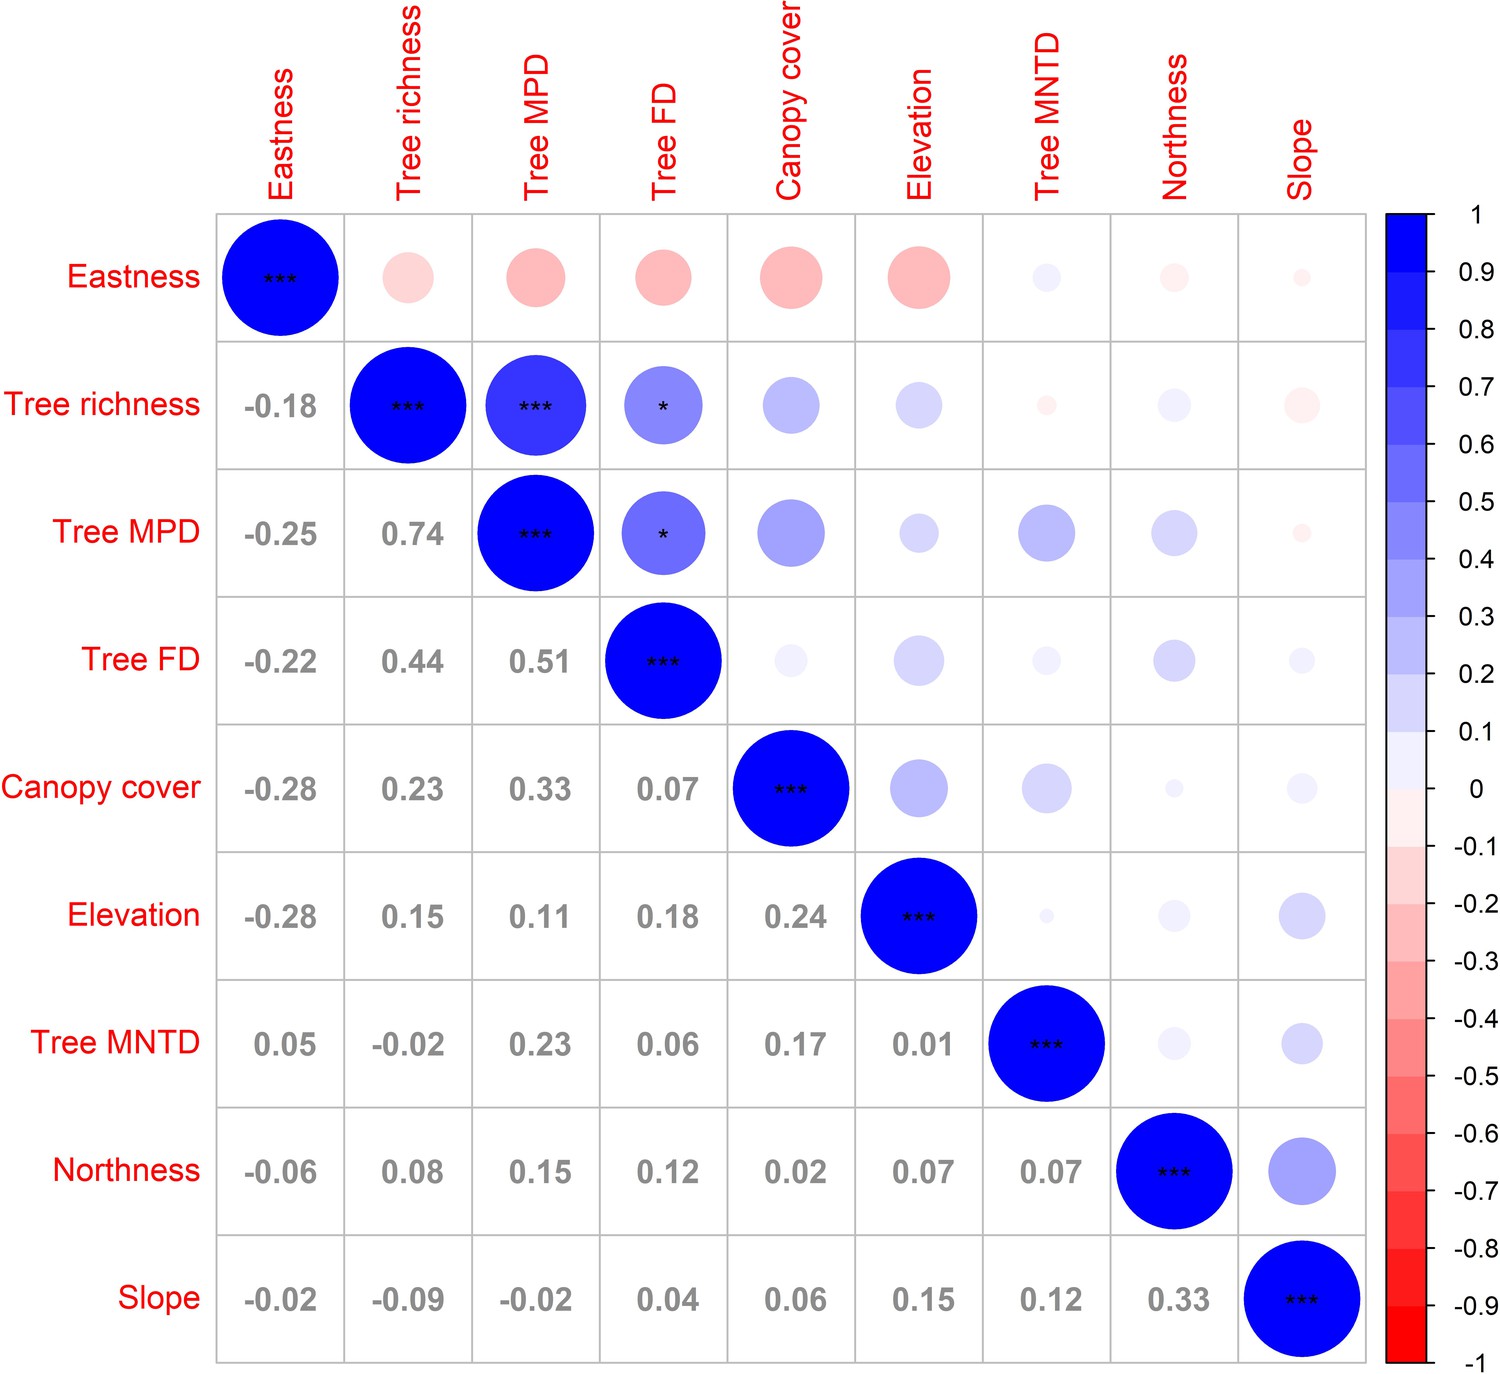
Correlations among the predictors used in the study.
Values and colored circles are Pearson’s correlation coefficients r, significances are indicated by asterisks: ***p<0.001, **p<0.01, *p≤0.05. Tree MPD (tree phylogenetic mean pairwise phylogenetic distance), tree FD (tree functional diversity expressed as Rao’s Q), tree MNTD (tree mean nearest taxon distance).
Figure 4 with 1 supplement
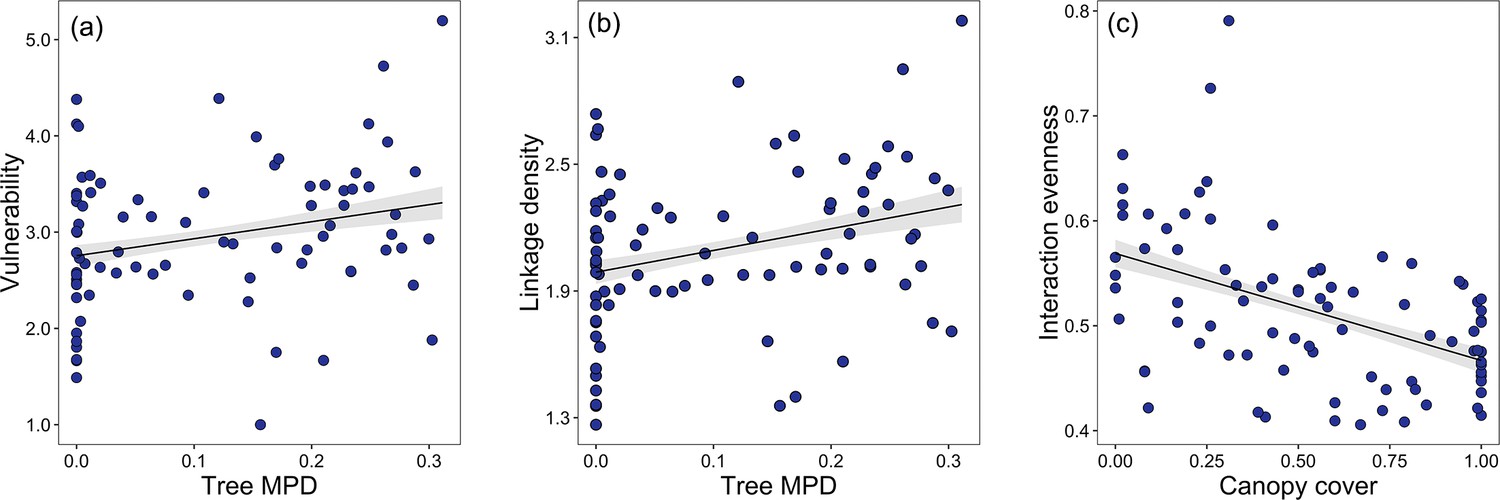
Bivariate relationships between tree MPD, canopy cover and network indices.
Community-level relationships of network between tree phylogenetic mean pairwise distance and (a) vulnerability and (b) linkage density and community-level relationships of network between canopy cover, and (c) interaction evenness.
Values were adjusted for covariates of the final regression model. Regression lines (with 95% confidence bands) show significant (p<0.05) relationships.
Figure 4—figure supplement 1
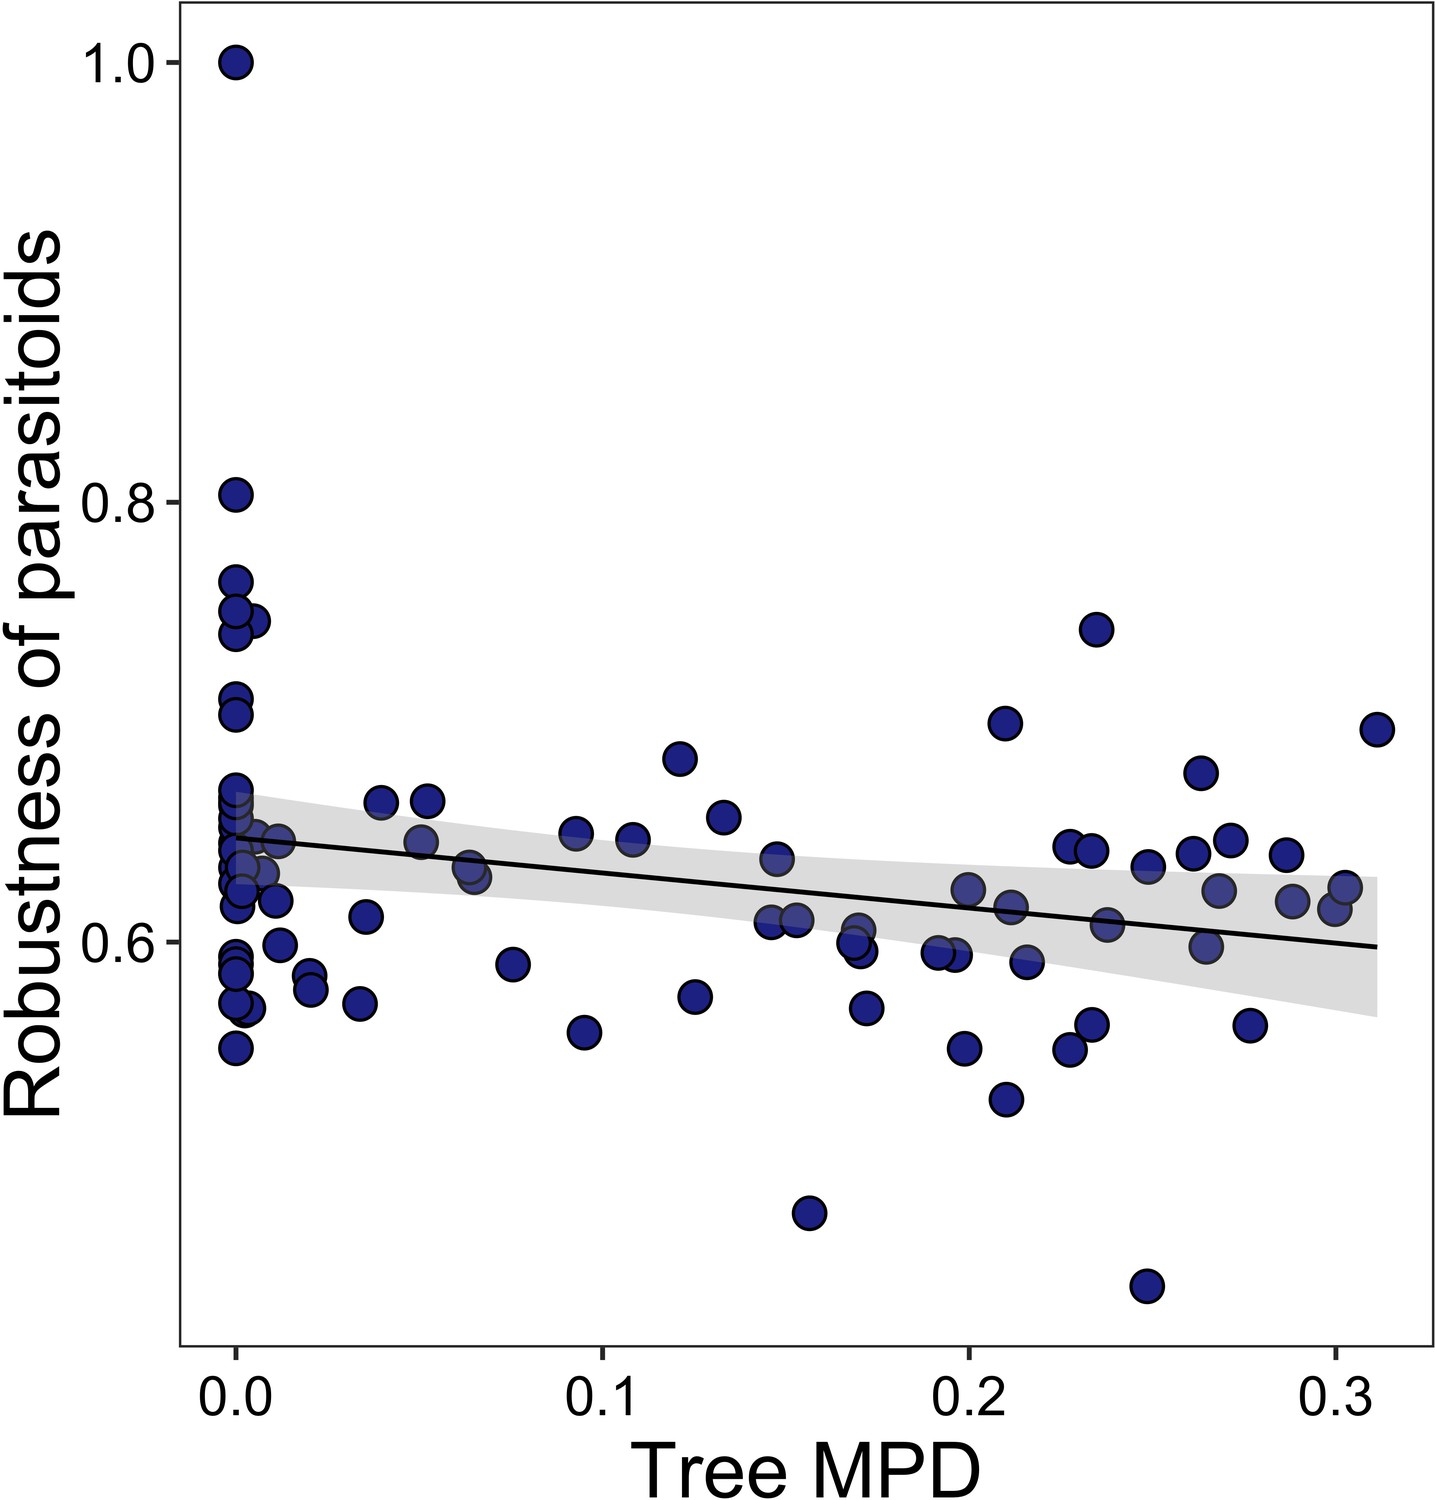
Community-level relationships of networks between tree phylogenetic mean pairwise distance (MPD) and robustness of parasitoids.
Values were adjusted for covariates of the final regression model (i.e., partial residuals shown on y-axis). Regression lines (with 95% confidence bands) show significant (p<0.05) relationships.
Tables
Table 1
Environmental correlates of dissimilarity matrixes with predictors (nonmetric multidimensional scaling [NMDS] on Morisita-Horn dissimilarity) across the study plots.
Significant p-values are indicated in bold. See Supplementary file 1b–e for the complete information.
| Host species community | Parasitoid species community | Host phylogenetic community | Parasitoid phylogenetic community | |
|---|---|---|---|---|
| Tree phylogeny NMDS1 | 0.225 | 0.422 | 0.386 | 0.274 |
| Tree phylogeny NMDS2 | 0.003 | 0.12 | 0.128 | 0.024 |
| Tree composition NMDS1 | 0.001 | 0.001 | 0.001 | 0.001 |
| Tree composition NMDS2 | 0.604 | 0.418 | 0.433 | 0.031 |
| Canopy cover | 0.001 | 0.001 | 0.001 | 0.004 |
| Tree species richness | 0.035 | 0.122 | 0.100 | 0.094 |
| Elevation | 0.005 | 0.007 | 0.001 | 0.001 |
| Eastness | 0.079 | 0.045 | 0.04 | 0.001 |
| Northness | 0.49 | 0.837 | 0.821 | 0.340 |
| Slope | 0.031 | 0.507 | 0.507 | 0.959 |
| Tree FD (Rao’s Q) | 0.094 | 0.019 | 0.021 | 0.031 |
| Tree MPD | 0.005 | 0.021 | 0.013 | 0.223 |
| Host phylogeny NMDS1 | – | 0.016 | – | 0.584 |
| Host phylogeny NMDS2 | – | 0.027 | – | 0.914 |
| Host composition NMDS1 | – | 0.001 | – | 0.008 |
| Host composition NMDS2 | – | 0.169 | – | 0.138 |
| Parasitoid phylogeny NMDS1 | 0.001 | – | 0.001 | – |
| Parasitoid phylogeny NMDS2 | 0.462 | – | 0.058 | – |
| Parasitoid composition NMDS1 | 0.001 | – | 0.001 | – |
| Parasitoid composition NMDS2 | 0.014 | – | 0.001 | – |
Table 2
Summary results of linear models for parasitoid generality, host vulnerability, robustness, linkage density, and interaction evenness of host-parasitoid network indices at the community level across the tree species richness gradient.
Standardized parameter estimates (with standard errors, t- and p-values) are shown for the variables retained in the minimal models.
| Est. | SE | t | p | ||
|---|---|---|---|---|---|
| Parasitoid generality | Intercept | 0.176 | 0.016 | 10.96 | <0.001 |
| Canopy cover | 0.033 | 0.016 | 2.03 | 0.046 | |
| Host vulnerability | Intercept | 2.873 | 0.08 | 35.89 | <0.001 |
| Elevation | –0.140 | 0.08 | –1.66 | 0.101 | |
| Tree species richness: Site A | 0.150 | 0.13 | 1.20 | 0.234 | |
| Tree species richness: Site B | 0.230 | 0.11 | 2.12 | 0.037 | |
| Robustness of parasitoids | Intercept | 0.630 | 0.01 | 84.43 | <0.001 |
| Tree species richness: Site A | –0.022 | 0.01 | –1.99 | 0.049 | |
| Tree species richness: Site B | –0.019 | 0.01 | –1.90 | 0.061 | |
| Linkage density | Intercept | 2.038 | 0.04 | 50.99 | <0.001 |
| Elevation | –0.078 | 0.04 | –1.85 | 0.069 | |
| Tree species richness: Site A | 0.106 | 0.06 | 1.70 | 0.094 | |
| Tree species richness: Site B | 0.106 | 0.04 | 2.68 | 0.009 | |
| Intercept | 0.511 | 0.009 | 59.12 | 0.025 | |
| Interaction evenness | Canopy cover | –0.037 | 0.007 | –5.06 | <0.001 |
| Eastness | –0.018 | 0.007 | –2.50 | 0.015 | |
Additional files
-
Supplementary file 1
Supplementary tables were included in this file.
- https://cdn.elifesciences.org/articles/100202/elife-100202-supp1-v2.docx
-
MDAR checklist
- https://cdn.elifesciences.org/articles/100202/elife-100202-mdarchecklist1-v2.docx
Download links
A two-part list of links to download the article, or parts of the article, in various formats.
Downloads (link to download the article as PDF)
Open citations (links to open the citations from this article in various online reference manager services)
Cite this article (links to download the citations from this article in formats compatible with various reference manager tools)
Multidimensionality of tree communities structure host-parasitoid networks and their phylogenetic composition
eLife 13:RP100202.
https://doi.org/10.7554/eLife.100202.3


