The neuropeptide sulfakinin is a peripheral regulator of insect behavioral switch between mating and foraging
- Key Laboratory of Entomology and Pest Control Engineering, College of Plant Protection, Southwest University, China
- Key Laboratory of Agricultural Biosafety and Green Production of Upper Yangtze River (Ministry of Education), Academy of Agricultural Sciences, Southwest University, China
- Department of Entomology, Kansas State University, United States
Figures
Figure 1 with 2 supplements
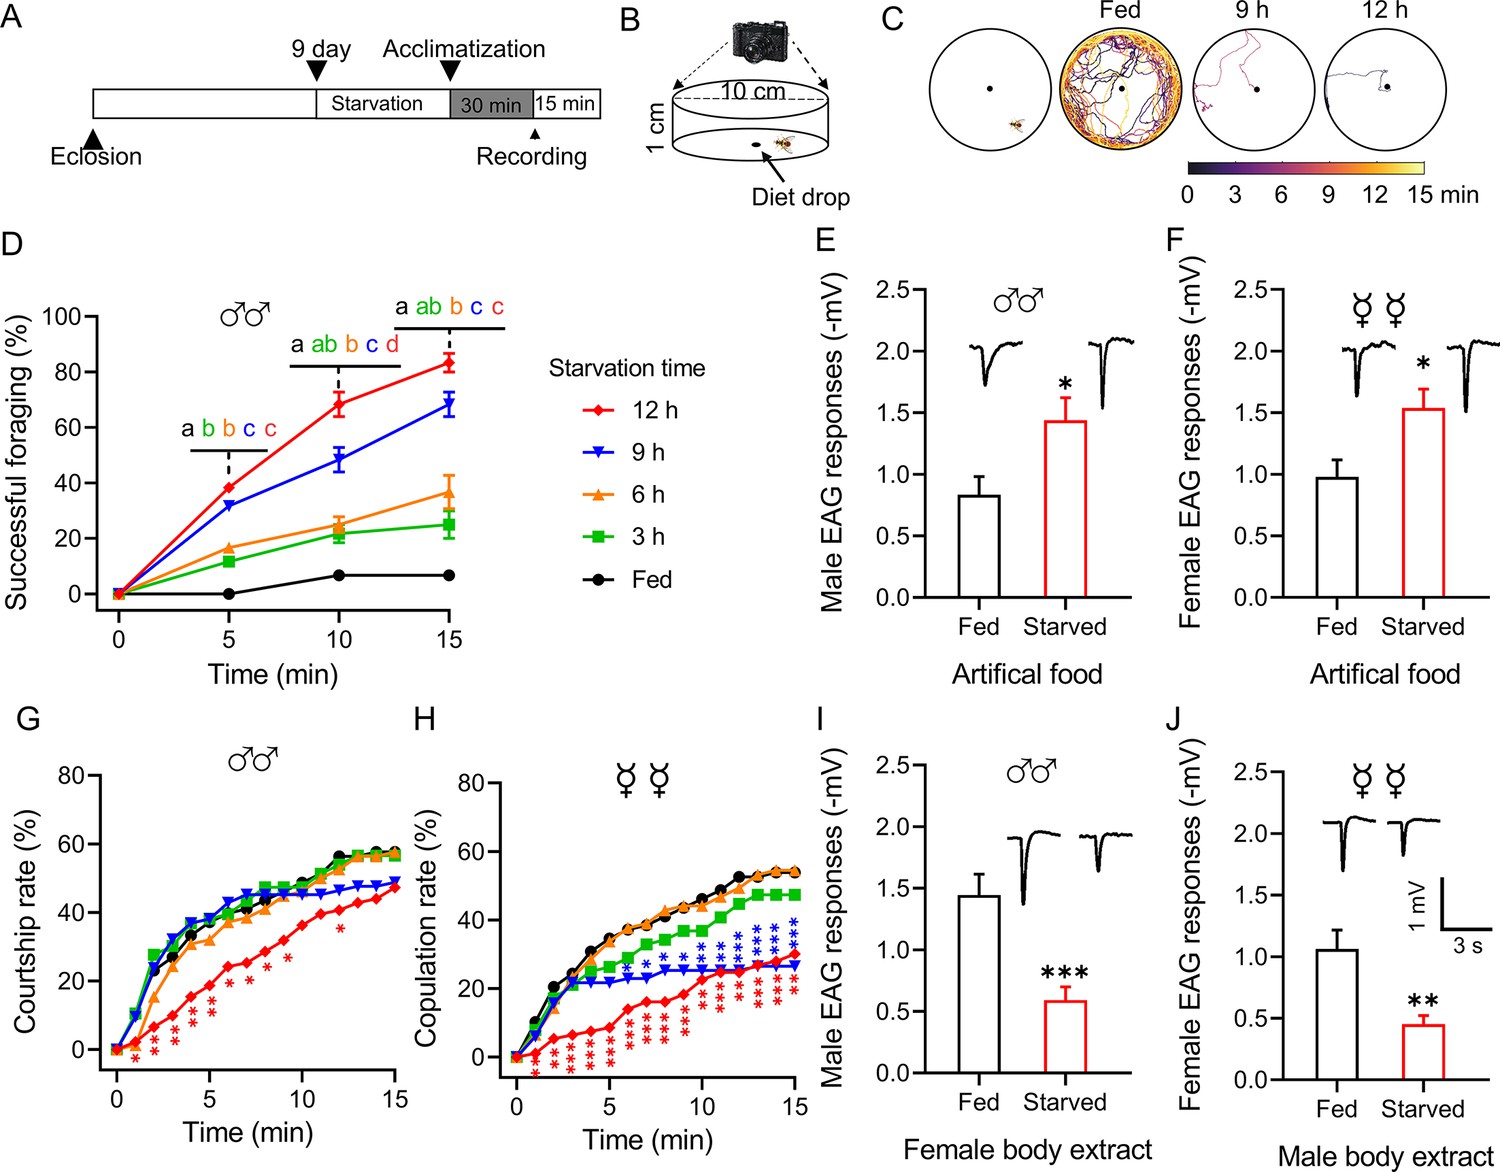
Starvation alters the behavior and olfactory responses of B. dorsalis.
(A) Schematic illustration of the experimental design. (B) Schematic illustration of the mating behavior assay device. (C) Representative foraging trajectories in the 100 mm diameter arenas within a 15 min observation period of flies starved for different durations. (D) Cumulative successful foraging within a 15 min observation period of male flies starved for different durations. Data are means ± SEM, n=60 flies for each condition. Different letters above the error bars indicate significant differences (one-way ANOVA followed by Tukey’s multiple comparisons test; p<0.05). (E, F) Electroantennogram (EAG) responses to artificial food in fed and starved male (E) and female (F) flies (unpaired t-test). (Top) Representative EAG recordings. (G) Cumulative courtship rate within a 15 min observation period of flies starved for different durations (n=78, 76, 78, 84, and 91, respectively, from fed to 12 h). (H) Cumulative copulation rate within a 15 min observation period of the flies starved for different durations (n=78, 76, 79, 83, and 93, respectively, from fed to 12 h). (G, H) Kruskal–Wallis and post hoc Mann–Whitney U tests were applied. (I, J) EAG responses to body extracts in fed and starved male (I) and female (J) flies. (Top) Representative EAG recordings. Data are means ± SEM, n=10–12 antennae per genotype (unpaired t-test; *p<0.05, **p<0.01, ***p<0.001).
-
Figure 1—source data 1
Starvation alters the behavior and olfactory responses of B. dorsalis.
- https://cdn.elifesciences.org/articles/100870/elife-100870-fig1-data1-v1.xlsx
Figure 1—figure supplement 1
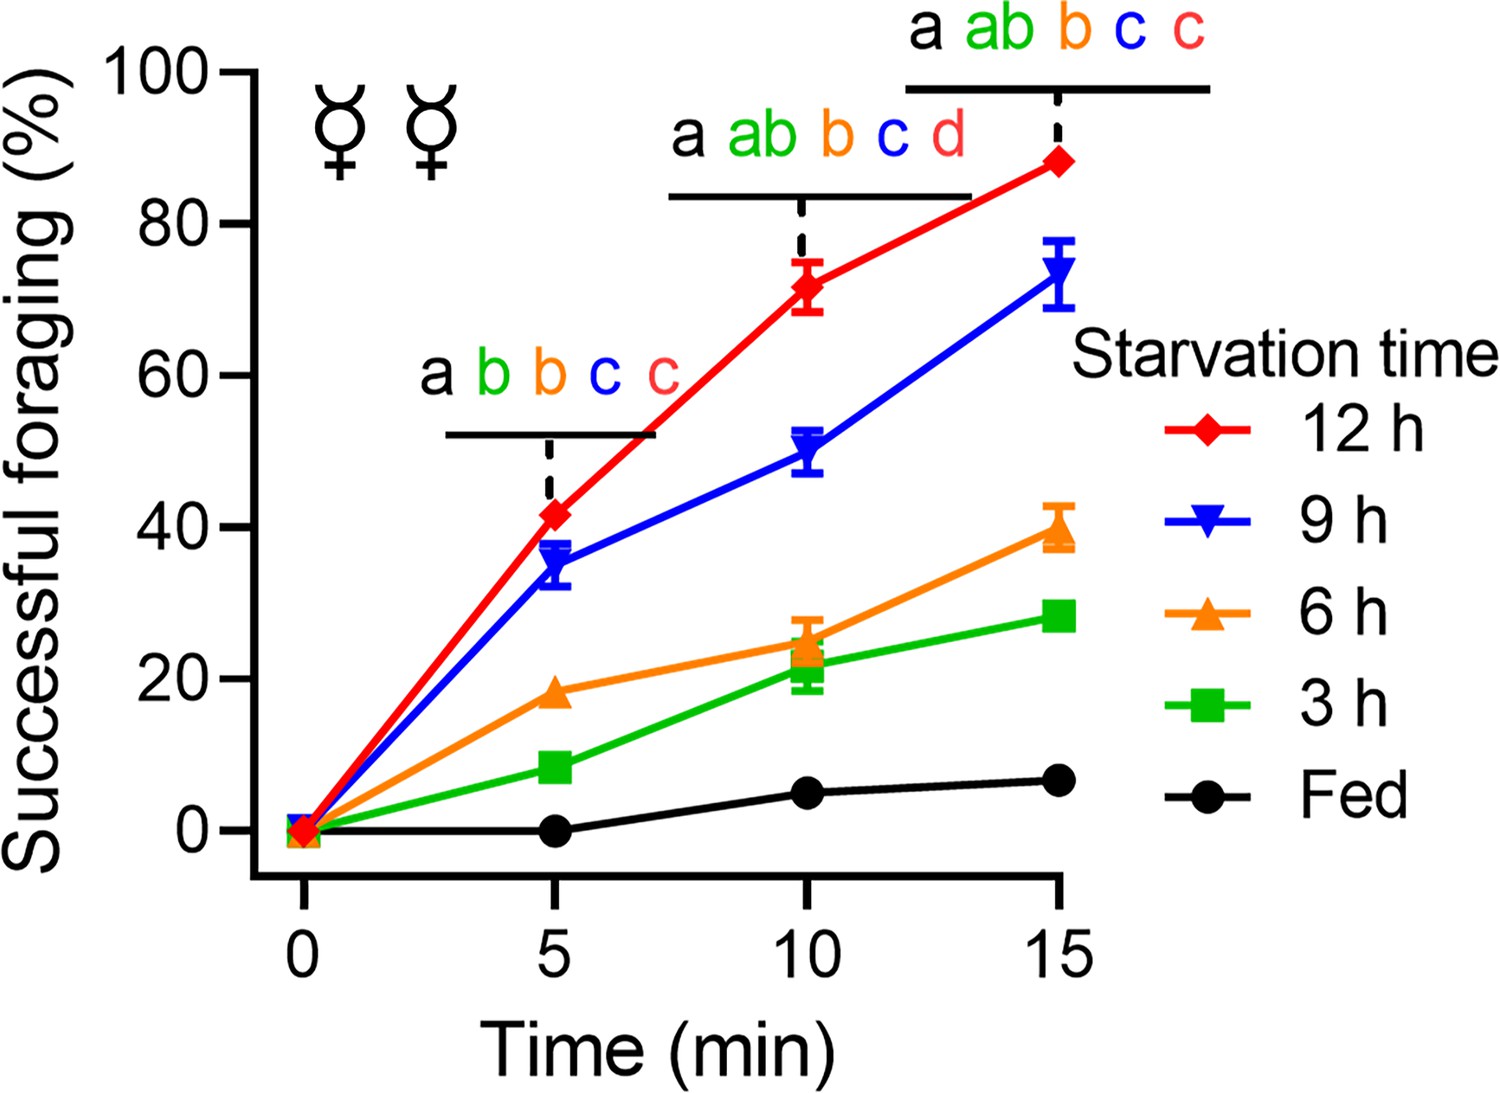
The cumulative successful foraging within a 15 min observation period of female flies with different starvation durations.
Data are means ± SEM. n=60 flies for each condition. Different letters above the error bars indicate significant differences (p<0.05, one-way ANOVA followed by Tukey’s multiple comparisons test).
-
Figure 1—figure supplement 1—source data 1
The cumulative successful foraging within a 15 min observation period of female flies with different starvation durations.
- https://cdn.elifesciences.org/articles/100870/elife-100870-fig1-figsupp1-data1-v1.xlsx
Figure 1—figure supplement 2
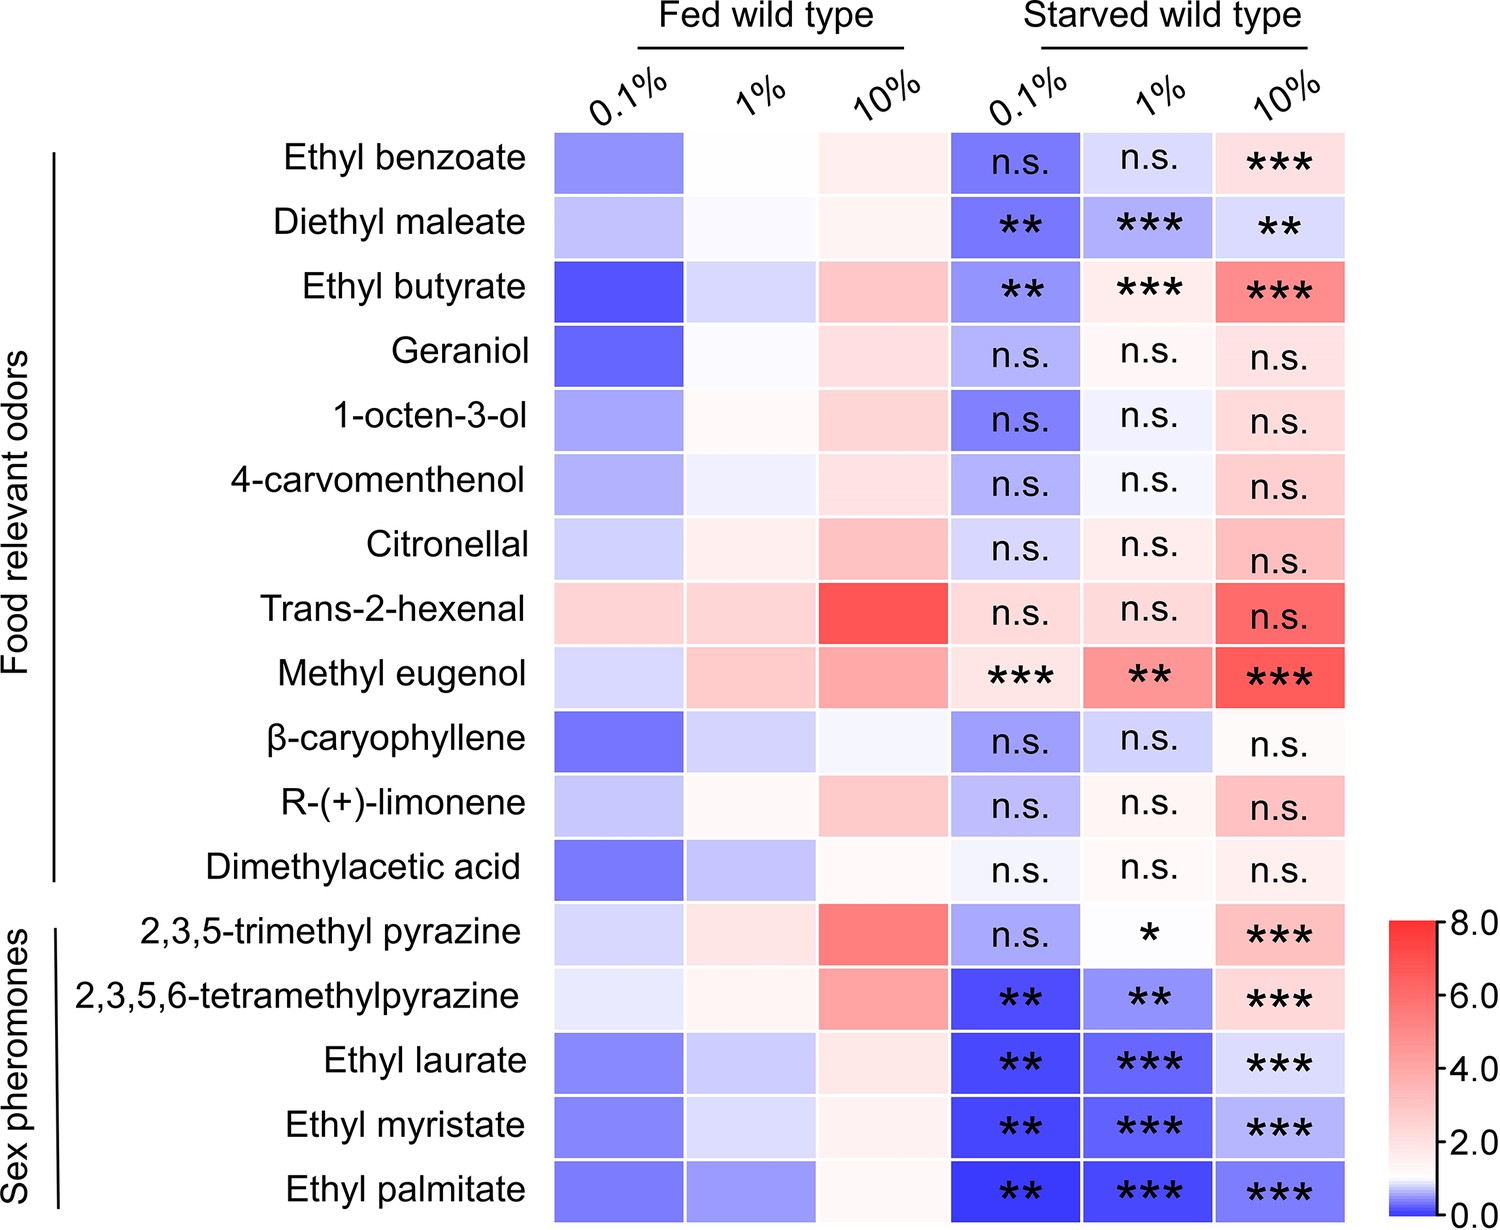
Electroantennogram (EAG) responses of fed and starved flies to food relevant odors and sex pheromones at three concentrations.
Heatmap representation of median EAG response values. n=5–10 antennae for each condition. The EAG response of fed flies and starved flies were compared under the same concentration. Unpaired t-test, n.s. indicates no significant difference, *p<0.05, **p<0.01, ***p<0.001.
-
Figure 1—figure supplement 2—source data 1
EAG responses of fed and starved flies to food relevant odors and sex pheromones at three concentrations.
- https://cdn.elifesciences.org/articles/100870/elife-100870-fig1-figsupp2-data1-v1.xlsx
Figure 2 with 4 supplements
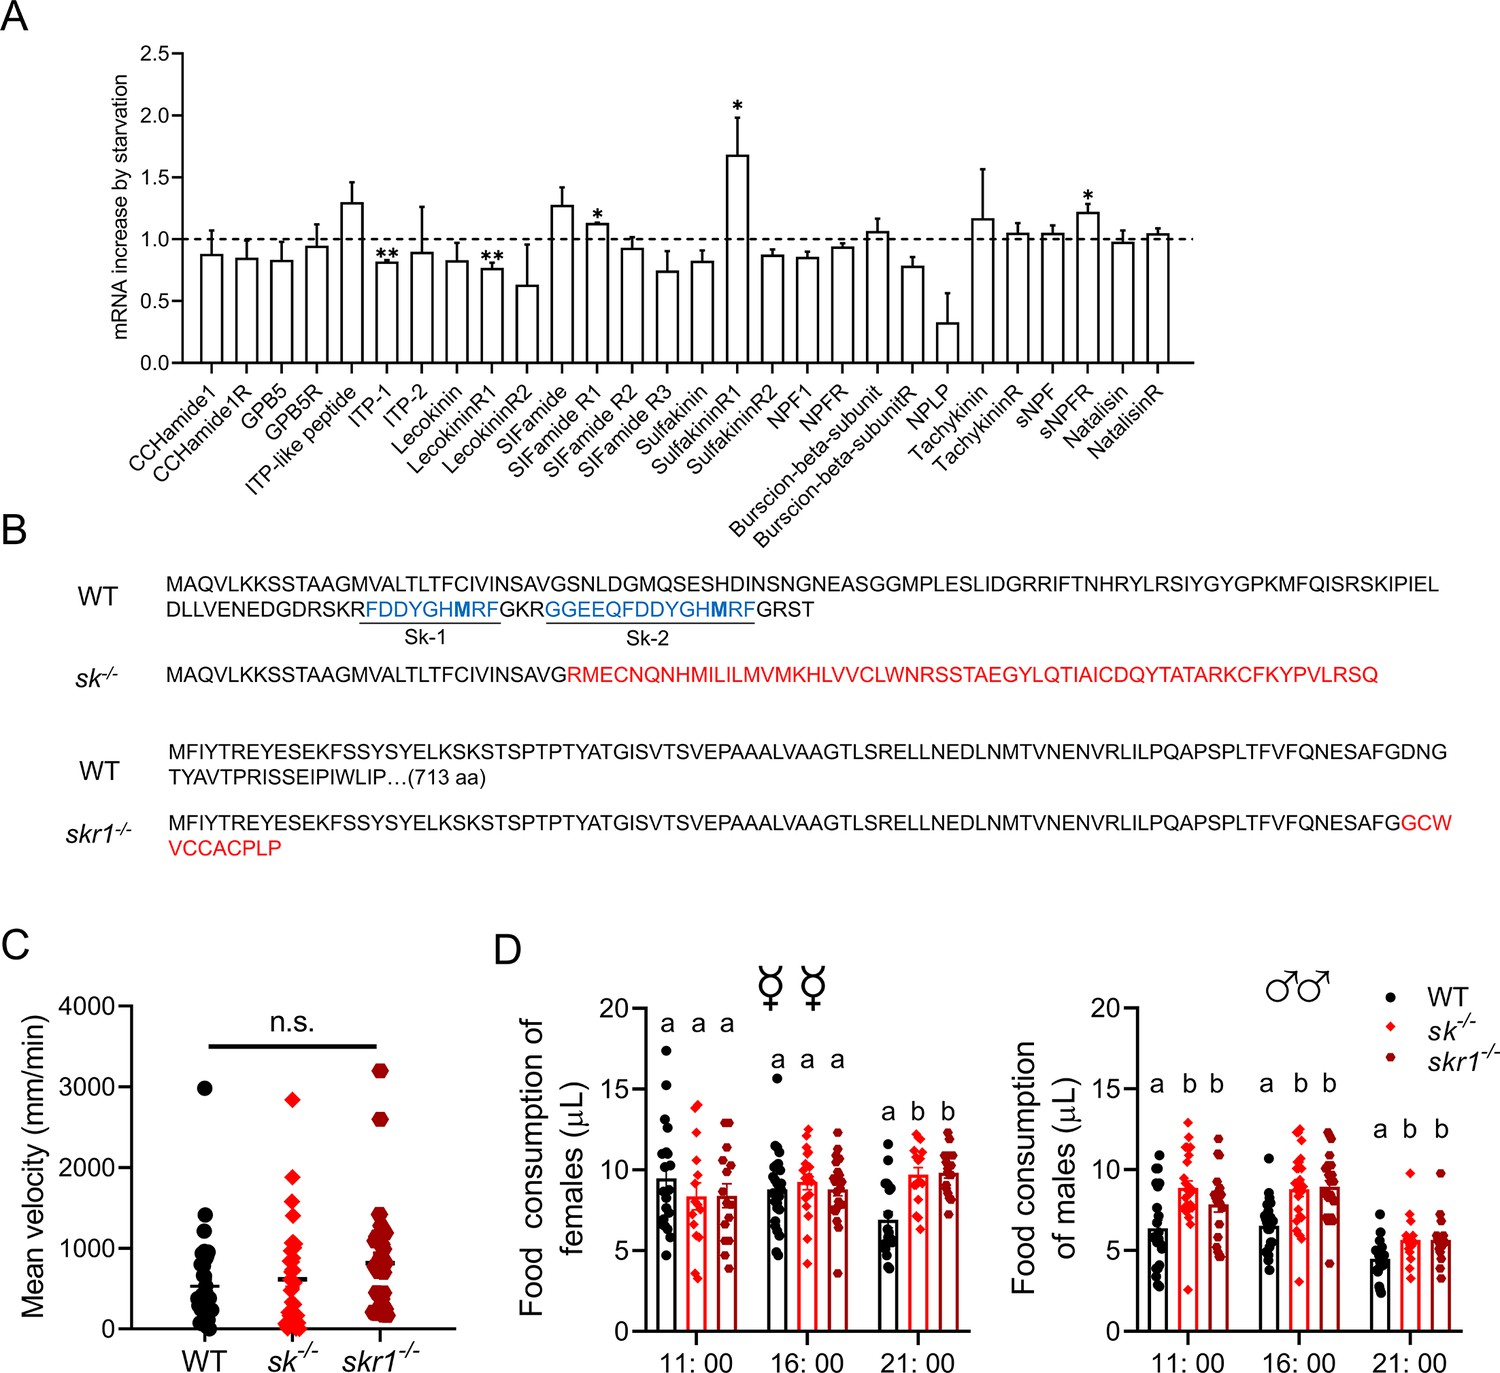
Starvation-induced expression of neuropeptide system components and phenotypes of null mutant flies.
(A) Changes in the expression of neuropeptide system components in the antennae of starved flies. The relative expression values are the fold-changes compared to the control. Data are means ± SEM, n=3 (unpaired t-test; *p<0.05, **p<0.01). (B) Altered amino acid sequence and mature peptides in the null mutants sk–/– and skr1–/– compared to wild-type (WT) flies. (C) Mean velocity of flies representing each genotype during a 15 min observation period. Data are means ± SEM (Kruskal–Wallis test). (D) Knockout of sulfakinin and SkR1 increases food consumption in B. dorsalis at different times of day. Each experiment consisted of one fly, and at least 15 flies were contained for the assay. Different lowercase letters indicate significant differences between treatments (one-way ANOVA followed by Tukey’s multiple comparisons test; p<0.05).
-
Figure 2—source data 1
Starvation-induced expression of neuropeptide system components and phenotypes of null mutant flies.
- https://cdn.elifesciences.org/articles/100870/elife-100870-fig2-data1-v1.xlsx
Figure 2—figure supplement 1
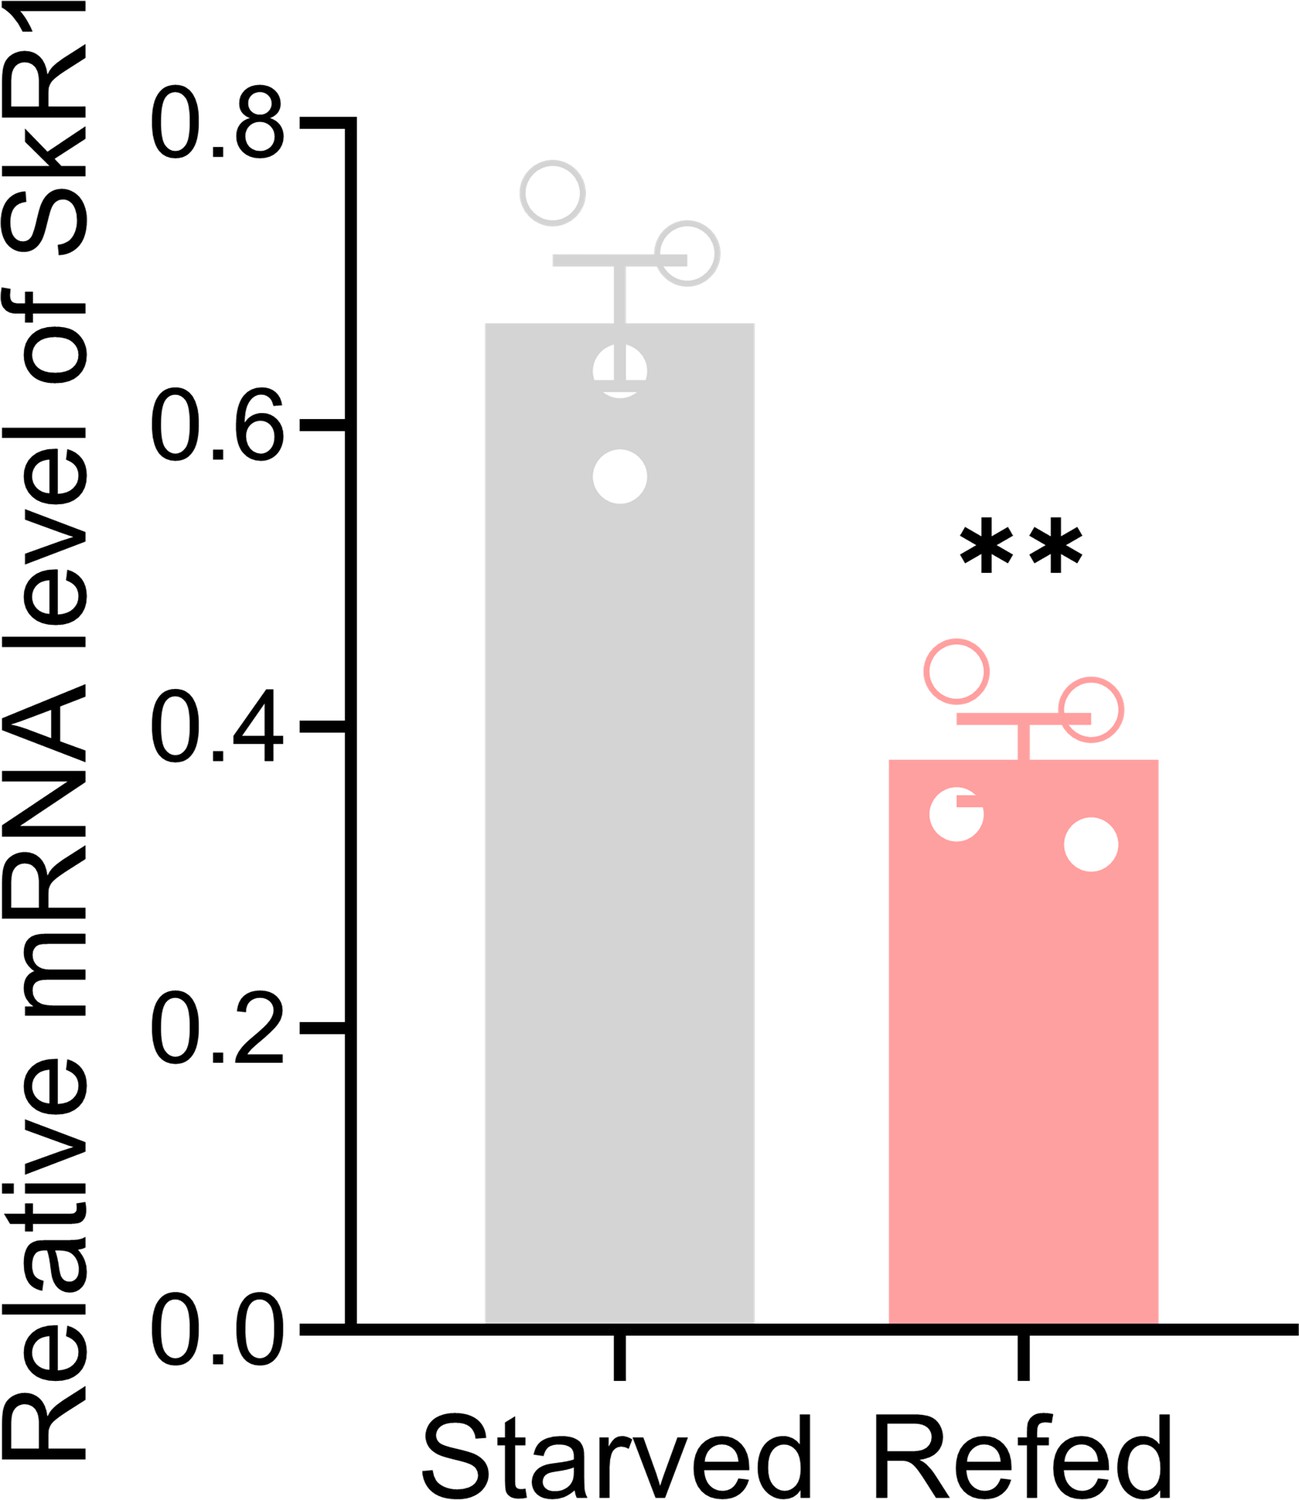
Refeeding after 12 h starvation decreases SkR1 transcript.
Data are means ± SEM, n=4, unpaired t-test; **p<0.01.
-
Figure 2—figure supplement 1—source data 1
Refeeding after 12 h starvation decreases SkR1 transcript.
- https://cdn.elifesciences.org/articles/100870/elife-100870-fig2-figsupp1-data1-v1.xlsx
Figure 2—figure supplement 2
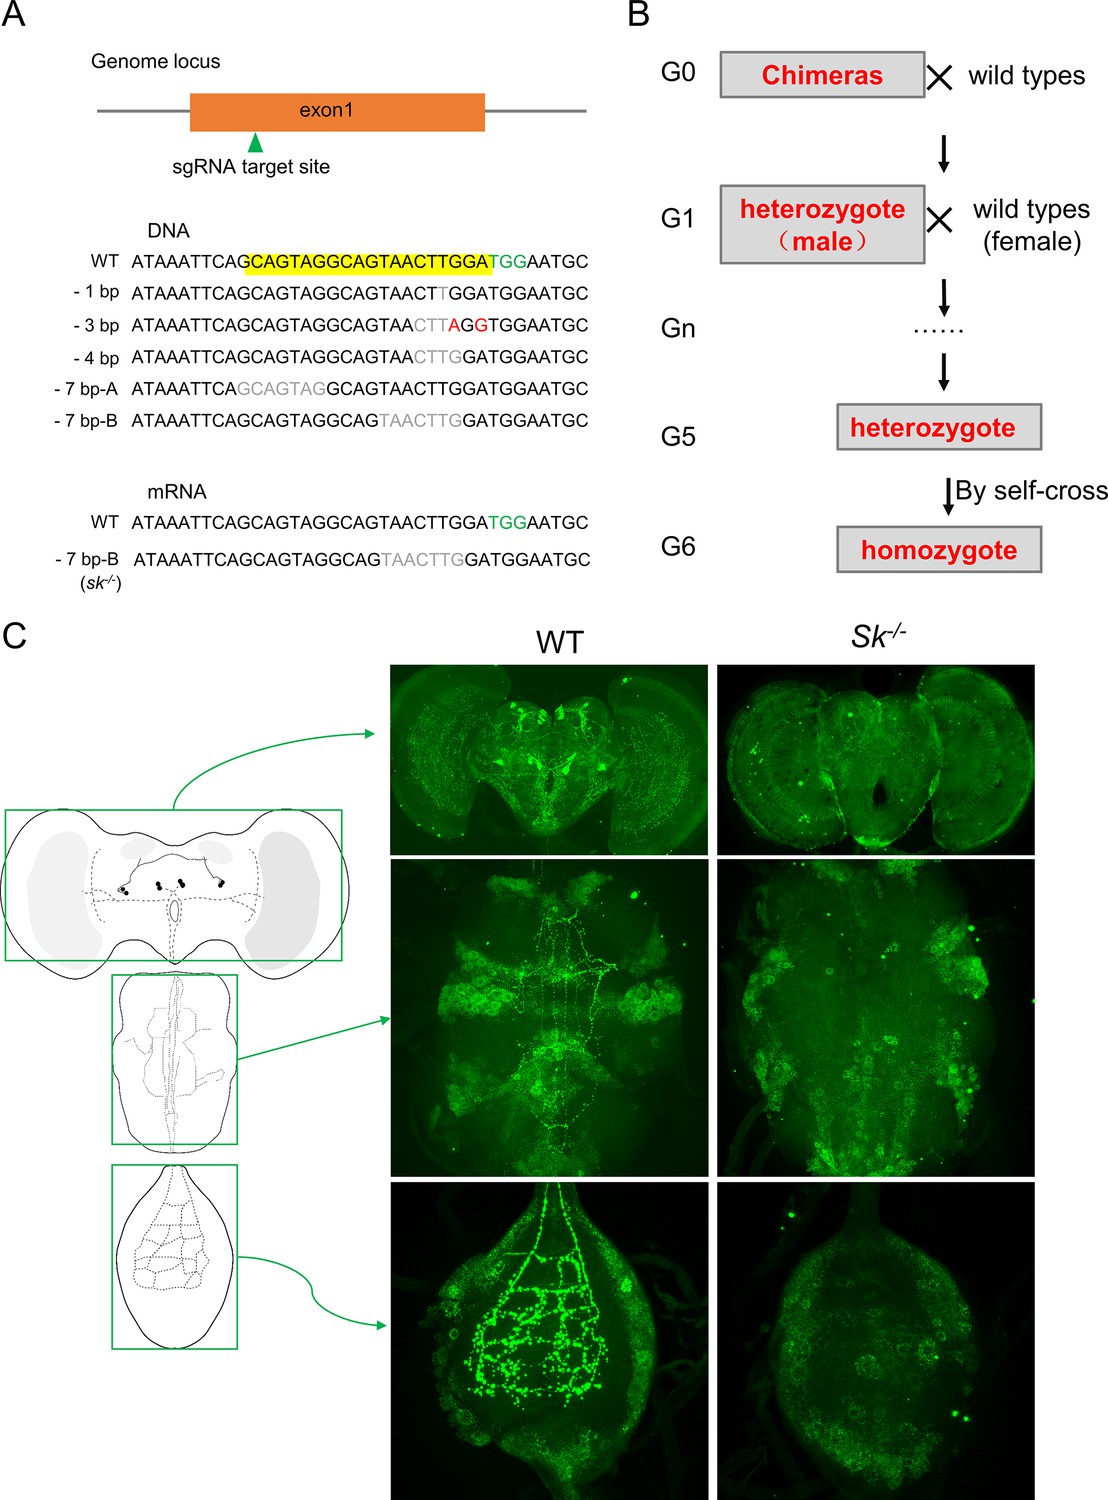
Generation of the BdSk null mutant via CRISPR-Cas9 system.
(A) Schematic of the Sk gene, showing the single guide RNA (sgRNA) target site. The Sk gene has only one exon, shown as an orange box. Among five independent mutants generated, the 7-bp-B deletion was chosen for generation of sk-/- flies for further experiments. The protospacer adjacent motif (PAM) is highlighted in green. (B) The screening strategy for Sk and SkR1 mutants. (C) Suppression of Sk expression in Sk mutants. The left panel represents a schematic diagram of the central nervous system of B. dorsalis. The middle and right panels show the Sk staining of wild-type and sk-/- mutant brains, respectively.
Figure 2—figure supplement 3
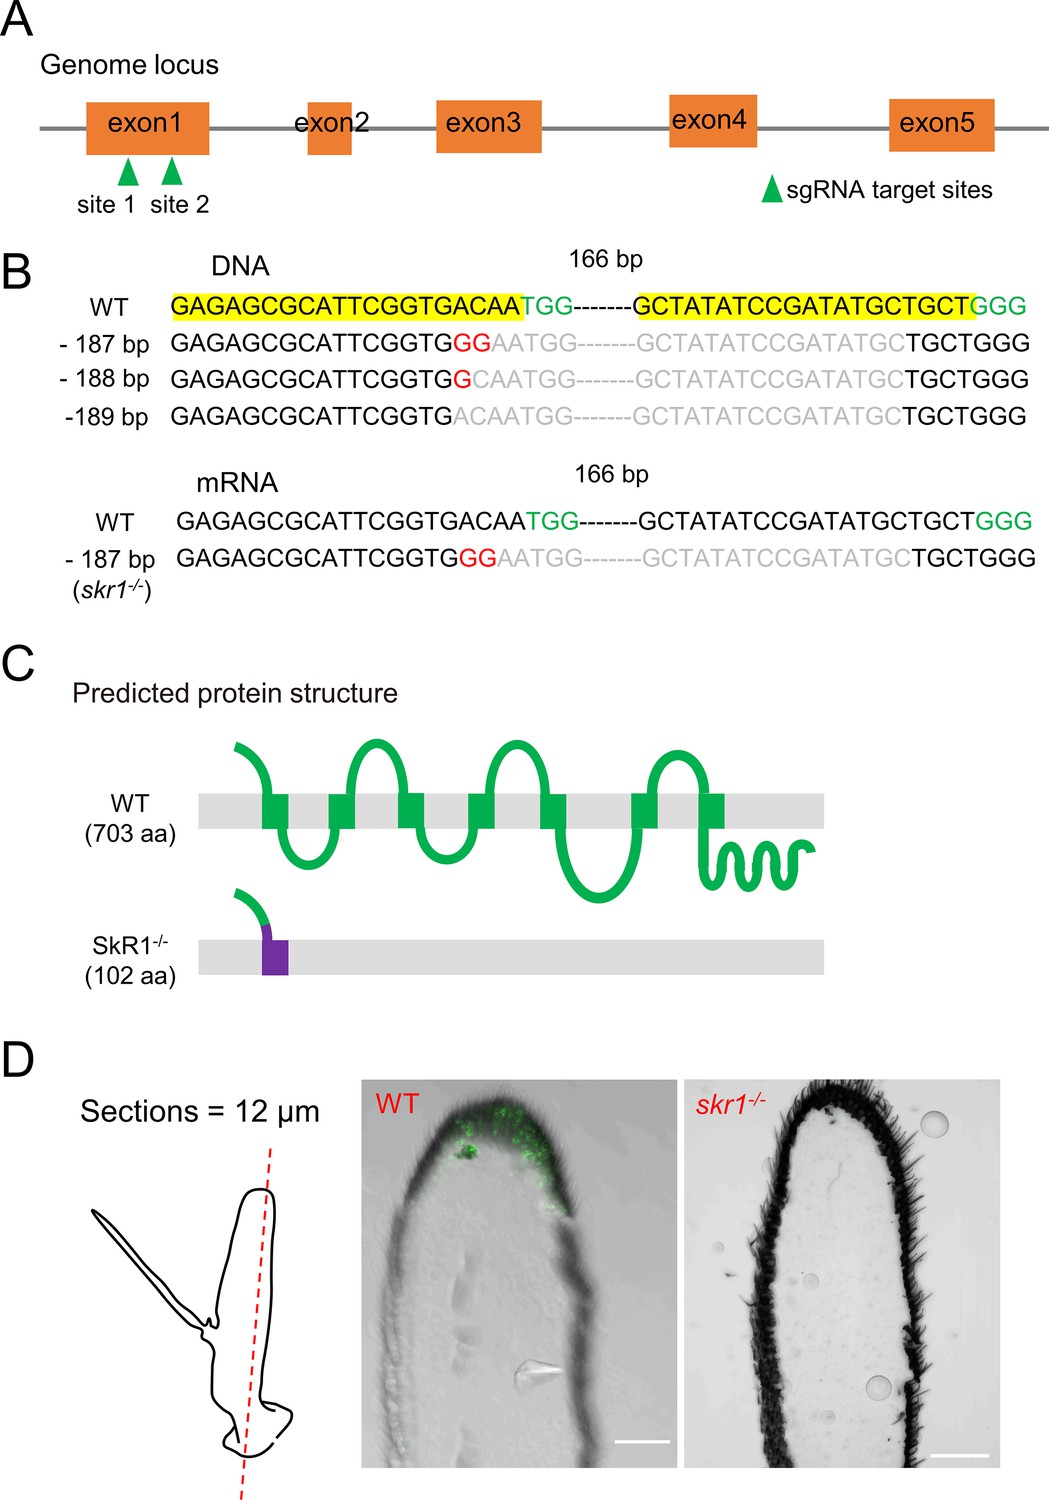
Generation of the BdSkR1 null mutant via CRISPR-Cas9 system.
(A) Schematic of the SkR1 gene, showing the single guide RNA (sgRNA) target sites. The SkR1 gene has five exons, shown as orange boxes. (B) A 187 bp deletion and 2 bp substitution was chosen for generation of skr1-/- flies. The protospacer adjacent motif (PAM) is highlighted in green. (C) The predicted seven transmembrane domains of BdSkR1. Disruption of the first transmembrane domain by a frameshift is shown in purple. (D) Suppression of SkR1 expression in SkR1 mutants. The left panel represents a schematic diagram of the antenna sections. The middle and right panels show the SkR1 staining of wild-type and skr1-/- mutant brains, respectively. No SkR1 staining was detected in the skr1-/- mutant brain.
Figure 2—figure supplement 4
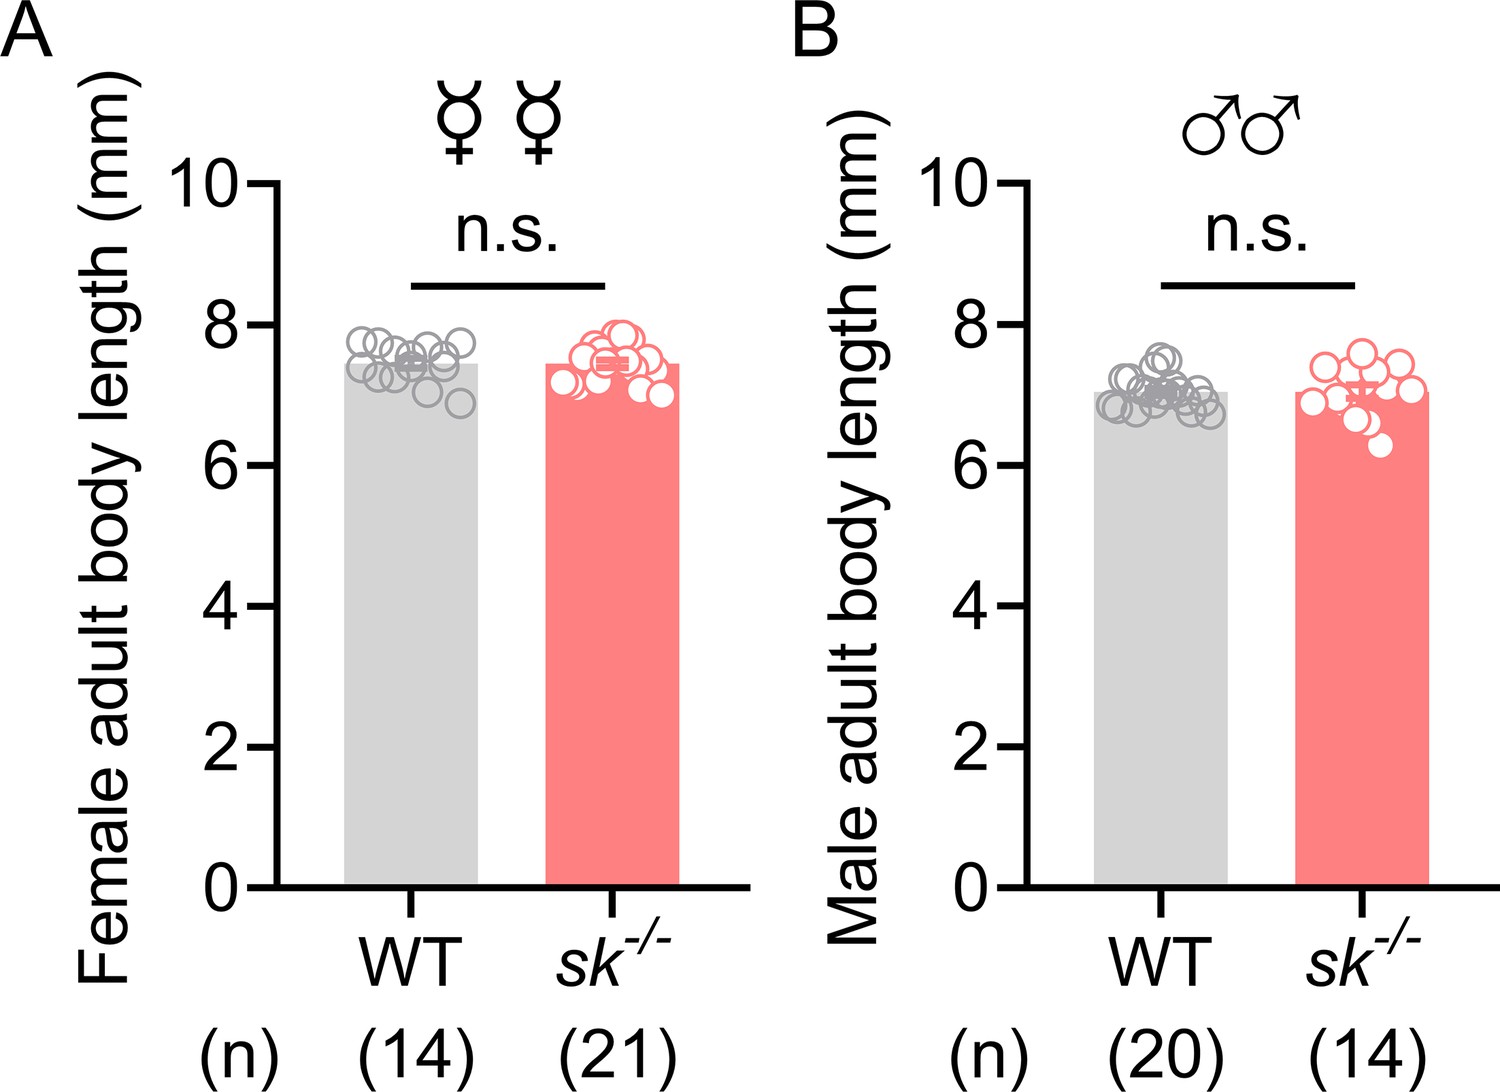
Knockout of Sk did not affect the body length of B. dorsalis.
(A, B) Sk-/- mutant flies have the same body length as the WT flies. The body length of females (A) and males (B) was measured separately. Data are means ± SEM. Unpaired t-test, n.s. indicates no significant difference.
-
Figure 2—figure supplement 4—source data 1
Knockout of Sk did not affect the body length of B. dorsalis.
- https://cdn.elifesciences.org/articles/100870/elife-100870-fig2-figsupp4-data1-v1.xlsx
Figure 3 with 2 supplements
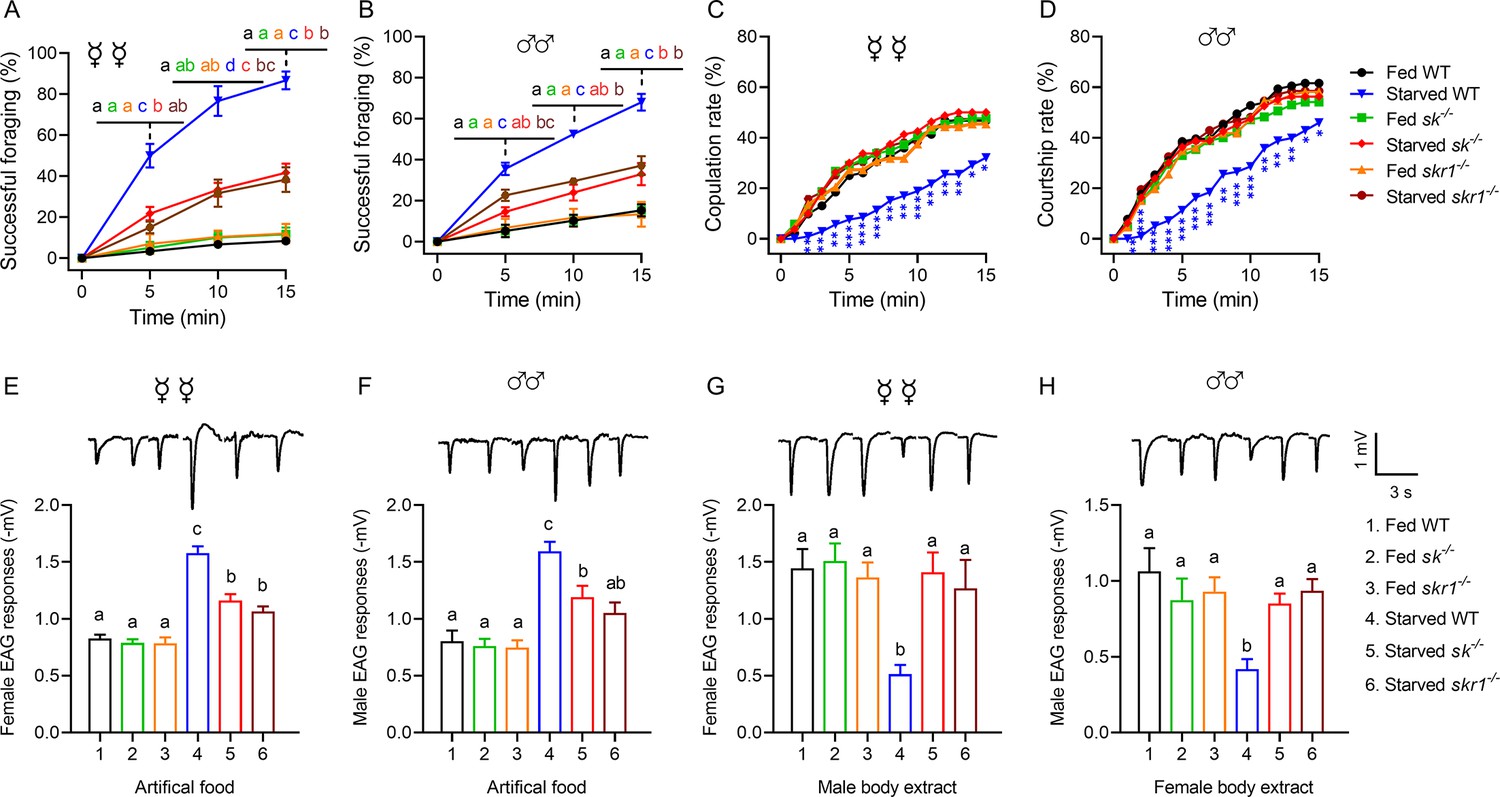
Sk-SkR1 signaling is required for changes in behavior and olfactory sensitivity induced by starvation.
(A, B) Cumulative successful foraging within a 15 min observation period of fed and starved flies with different genotypes. The successful foraging of females (A) and males (B) was measured separately. Data are means ± SEM, n=60 flies for each condition. Different letters above the error bars indicate significant differences (one-way ANOVA followed by Tukey’s multiple comparisons test; p<0.05). (C) Cumulative copulation rates within a 15 min observation period of fed and starved flies with different genotypes (n=92, 86, 88, 106, 80, and 76, respectively, from fed WT to starved skr1–/–). (D) Cumulative courtship rates within a 15 min observation period of fed and starved flies with different genotypes (n=91, 85, 86, 98, 80, and 77, respectively, from fed WT to starved skr1–/–). (C, D) Kruskal–Wallis and post hoc Mann–Whitney U tests were applied (*p<0.05, **p<0.01, ***p<0.001). (E, F) Electroantennogram (EAG) responses to artificial food in fed and starved flies of different genotypes. The EAG responses to artificial food in females (E) and males (F) were measured separately. (Top) Representative EAG recordings. (G, H) EAG responses to body extracts in fed and starved flies of different genotypes. The EAG responses to body extracts of females (G) and males (H) were measured separately. (Top) Representative EAG recordings. Data are means ± SEM, n=10–12 antennae for each condition. Different letters above the error bars indicate significant differences (one-way ANOVA followed by Tukey’s multiple comparisons test; p<0.05).
-
Figure 3—source data 1
Sk-SkR1 signaling is required for changes in behavior and olfactory sensitivity induced by starvation.
- https://cdn.elifesciences.org/articles/100870/elife-100870-fig3-data1-v1.xlsx
Figure 3—figure supplement 1
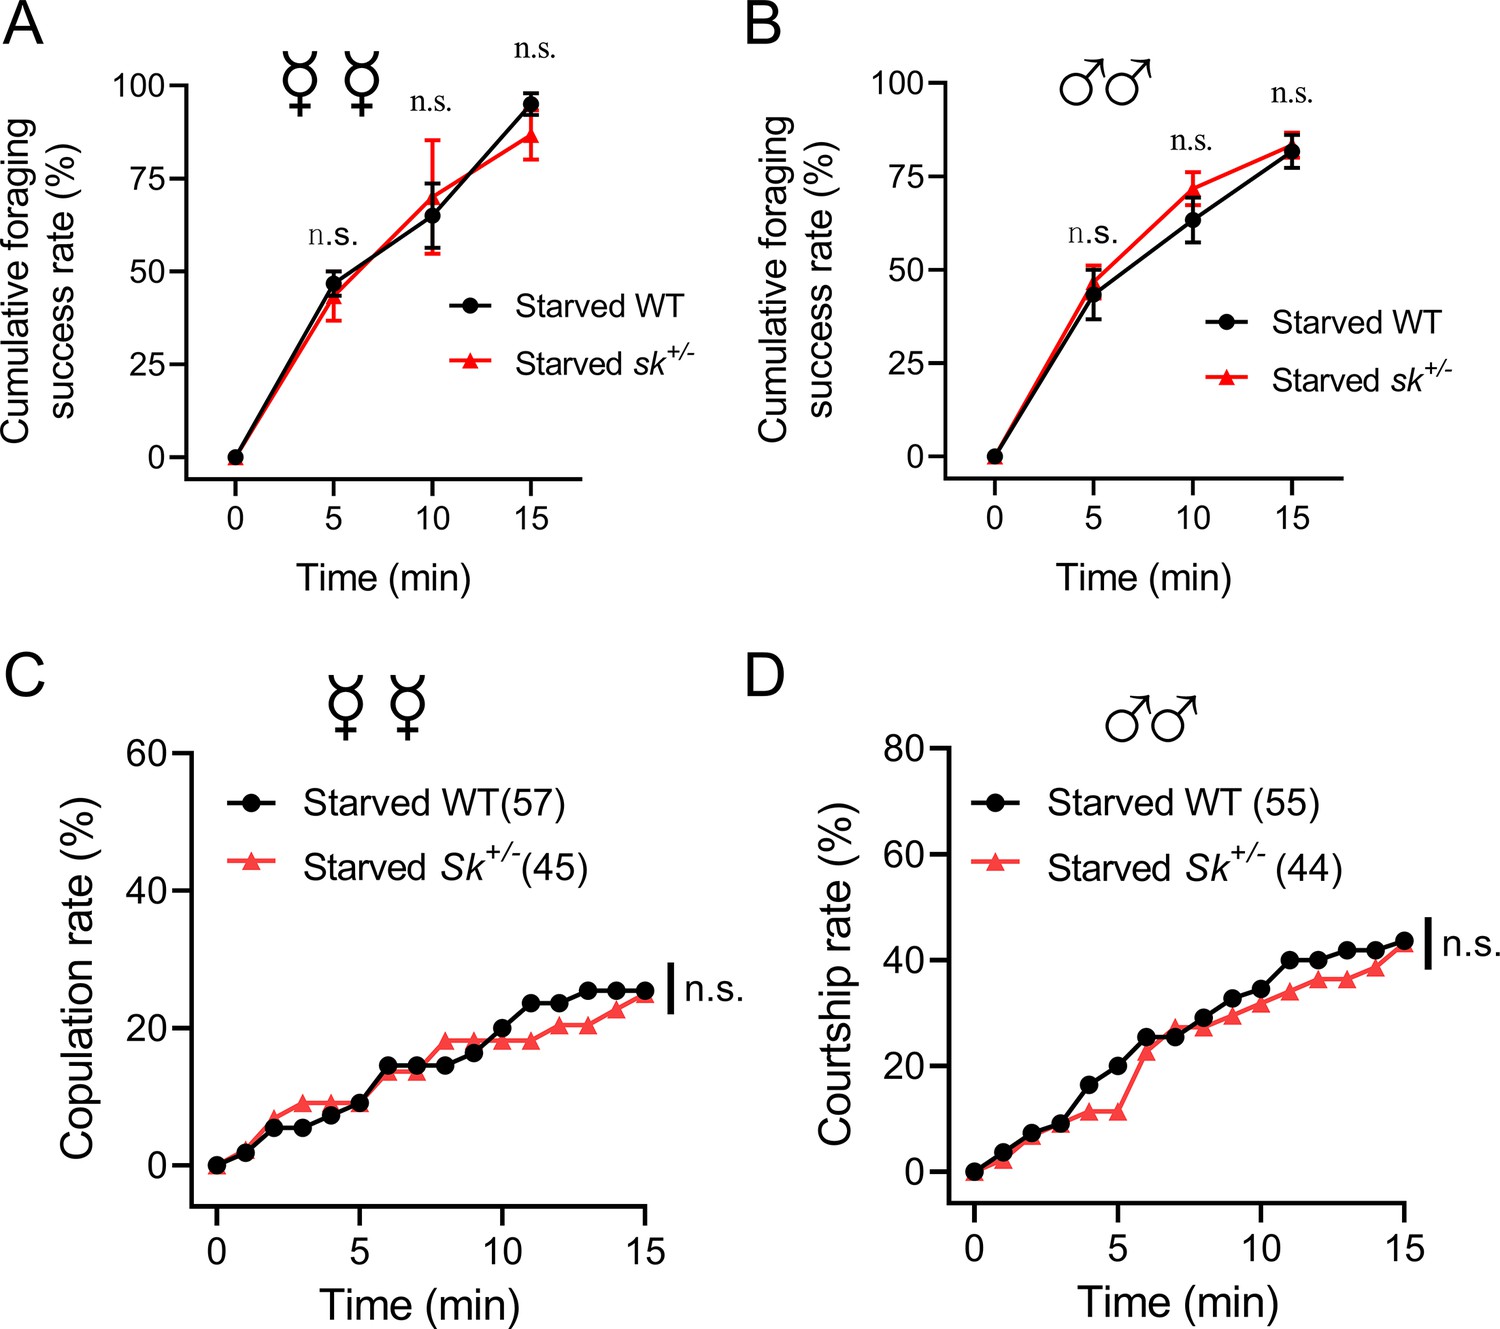
Behavioral phenotypes of Sk heterozygous mutants.
(A, B) Cumulative successful foraging within a 15 min observation period of starved WT and Sk heterozygous flies. The successful foraging of females (A) and males (B) was measured separately. Data are means ± SEM, n=60 flies for each condition. Unpaired t-test, n.s. indicates no significant difference. (C) Cumulative copulation rates within a 15 min observation period of starved WT and Sk heterozygous flies (n=57 and 45, respectively). (D) Cumulative courtship rates within a 15 min observation period of starved WT and Sk heterozygous flies (n=55 and 44, respectively). (C, D) Kruskal–Wallis and post hoc Mann–Whitney U tests were applied, n.s. indicates no significant difference.
-
Figure 3—figure supplement 1—source data 1
Behavioral phenotypes of Sk heterozygous mutants.
- https://cdn.elifesciences.org/articles/100870/elife-100870-fig3-figsupp1-data1-v1.xlsx
Figure 3—figure supplement 2
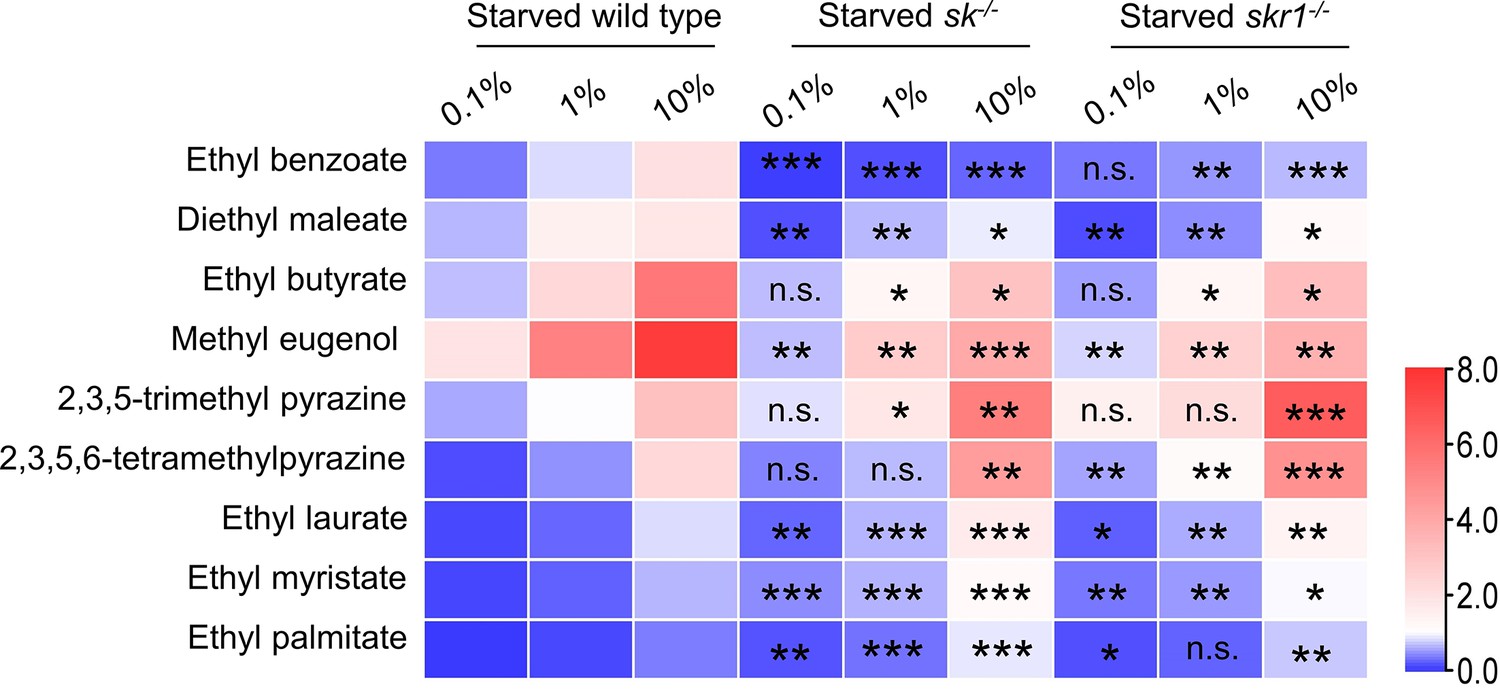
Electroantennogram (EAG) responses of starved flies with different genotypes to food relevant odors and sex pheromones at three concentrations.
Heatmap representation of median EAG response values. n=5–10 antennae for each condition. The EAG response of fed flies and starved flies were compared under the same concentration. Unpaired t-test, n.s. indicates no significant difference, *p<0.05, **p<0.01, ***p<0.001.
-
Figure 3—figure supplement 2—source data 1
EAG responses of starved flies with different genotypes to food relevant odors and sex pheromones at three concentrations.
- https://cdn.elifesciences.org/articles/100870/elife-100870-fig3-figsupp2-data1-v1.xlsx
Figure 4

The transition of olfactory responses is associated with the expression of different sets of odorant receptors (ORs) in OR neurons induced by Sk-SkR1 signaling.
(A) Principal component analysis (PCA) using differentially expressed genes obtained from pairwise comparisons between different treatments. (B) The expression profiles of the candidate OR genes in wild-type (WT) and sk–/– flies determined by qRT-PCR. The OR names with red fonts represent the set of ORs for food odor and blue fronts represent the set of ORs for sex pheromone. Data are mean relative expression levels ± SEM. R1−R3 represent biological replicates. Different lowercase letters indicate significant differences between treatments (one-way ANOVA followed by Tukey’s multiple comparisons test; p<0.05). (C) Quantification of calcium levels following the response of candidate ORs to sex pheromones and food odors at a concentration of 10–4 M (n=3‒6). Different lowercase letters indicate significant differences between treatments (one-way ANOVA followed by Tukey’s multiple comparisons test; p<0.05). (D) Dose–response curves of candidate ORs to sex pheromone components such as ethyl laurate (EL), ethyl palmitate (EP), 2,3,5-trimethyl pyrazine (TMP), and 2,3,5,6-tetramethylpyrazine (TTMP). (E) Dose–response curves of candidate ORs to food odorants such as ethyl benzoate (EBE), ethyl butyrate (EBU), diethyl maleate (DM), and methyl eugenol (ME). In both cases, n=5. (F) Co-localization of Orco (red) and SkR1 (green) neurons in B. dorsalis antennae. Scale bars = 50 μm.
-
Figure 4—source data 1
The transition of olfactory responses is associated with the expression of different sets of ORs in OR neurons induced by Sk-SkR1 signaling.
- https://cdn.elifesciences.org/articles/100870/elife-100870-fig4-data1-v1.xlsx
Figure 5
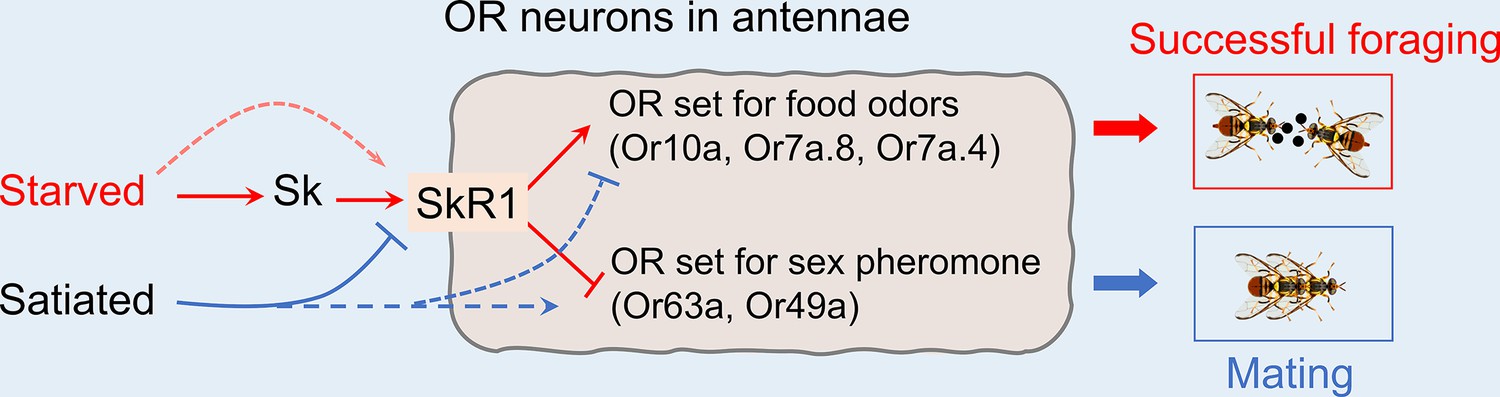
Schematic representation of peripheral olfactory remodeling in odorant receptor (OR) neurons of the antenna that arbitrate between mating and foraging behavior in B. dorsalis.
Starvation increases the abundance of SkR1 in the OR neurons (red arrows) and SkR1 signaling induces the expression of genes encoding ORs that sense food odors, resulting in successful foraging. Satiation suppresses SkR1 expression and induces the expression of genes encoding ORs that sense opposite-sex pheromones, leading to successful mating (blue arrows). Dashed arrows represent the additional possible pathways that have not been tested in this study, but not excluded in the model. Please see the ‘Discussion’ for details of additional possible factors modulating odorant sensitivity relevant to satiety.
Tables
Key resources table
| Reagent type (species) or resource | Designation | Source or reference | Identifiers | Additional information |
|---|---|---|---|---|
| Genetic reagent (Bactrocera dorsalis) | sk-/- | Wang Lab, Southwest University, this paper | See Material and methods/CRISPR/Cas9-mediated mutants | |
| Genetic reagent (B. dorsalis) | skr1-/- | Wang Lab, Southwest University, this paper | See Material and methods/CRISPR/Cas9-mediated mutants | |
| Cell line (Homo sapiens) | Flip-In T-REx293 cell line | Park Lab, Kansas State University | Cat# R78007 | |
| Antibody | Rabbit polyclonal anti-DSK | Zhou Lab, Chinese Academy of Science | IHC (1:1000) | |
| Antibody | Rabbit polyclonal anti-BdSkR1 | Wang Lab, Southwest University, this paper | IHC (1:500) | |
| Antibody | Rabbit polyclonal anti-BdOrco | Wang Lab, Southwest University, this paper | IHC (1:200) | |
| Antibody | Goat anti-rabbit polyclonal, Alexa Fluor 488 | Cell Signaling Technology | Cat# 4412S | IHC (1:1000) |
| Antibody | Goat anti-mouse polyclonal, Alexa Fluor 647 | Cell Signaling Technology | Cat# 4410S | IHC (1:1000) |
| Software, algorithm | ImageJ | National Institutes of Health | https://imagej.nih.gov/ij/ | ImageJ |
| Software, algorithm | Prism 8 | GraphPad | https://www.graphpad.com/ | ImageJ |
Additional files
-
Supplementary file 1
Chemicals used for electroantennograms.
- https://cdn.elifesciences.org/articles/100870/elife-100870-supp1-v1.docx
-
Supplementary file 2
Primer sequences used in this study.
- https://cdn.elifesciences.org/articles/100870/elife-100870-supp2-v1.docx
-
Supplementary file 3
Analysis of off-target effects of mutants.
- https://cdn.elifesciences.org/articles/100870/elife-100870-supp3-v1.docx
-
MDAR checklist
- https://cdn.elifesciences.org/articles/100870/elife-100870-mdarchecklist1-v1.docx
Download links
A two-part list of links to download the article, or parts of the article, in various formats.
Downloads (link to download the article as PDF)
Open citations (links to open the citations from this article in various online reference manager services)
Cite this article (links to download the citations from this article in formats compatible with various reference manager tools)
The neuropeptide sulfakinin is a peripheral regulator of insect behavioral switch between mating and foraging
eLife 13:RP100870.
https://doi.org/10.7554/eLife.100870.4


