Quantifying feral pig interactions to inform disease transmission networks
- School of Veterinary Science, The University of Queensland, Australia
- The University of Queensland, School of Chemistry and Molecular Biosciences, Australian Centre for Ecogenomics, Australia
- NSW Department of Primary Industries, Vertebrate Pest Research Unit, Australia
- Pest Animal Research Centre, Biosecurity Queensland, Department of Agriculture and Fisheries, Australia
- School of Sciences, University of Southern Queensland, Australia
- School of the Environment, The University of Queensland, Australia
- Centre for Invasive Species Solutions, S. Bruce Australian Capital Territory, Australia
Figures
Figure 1
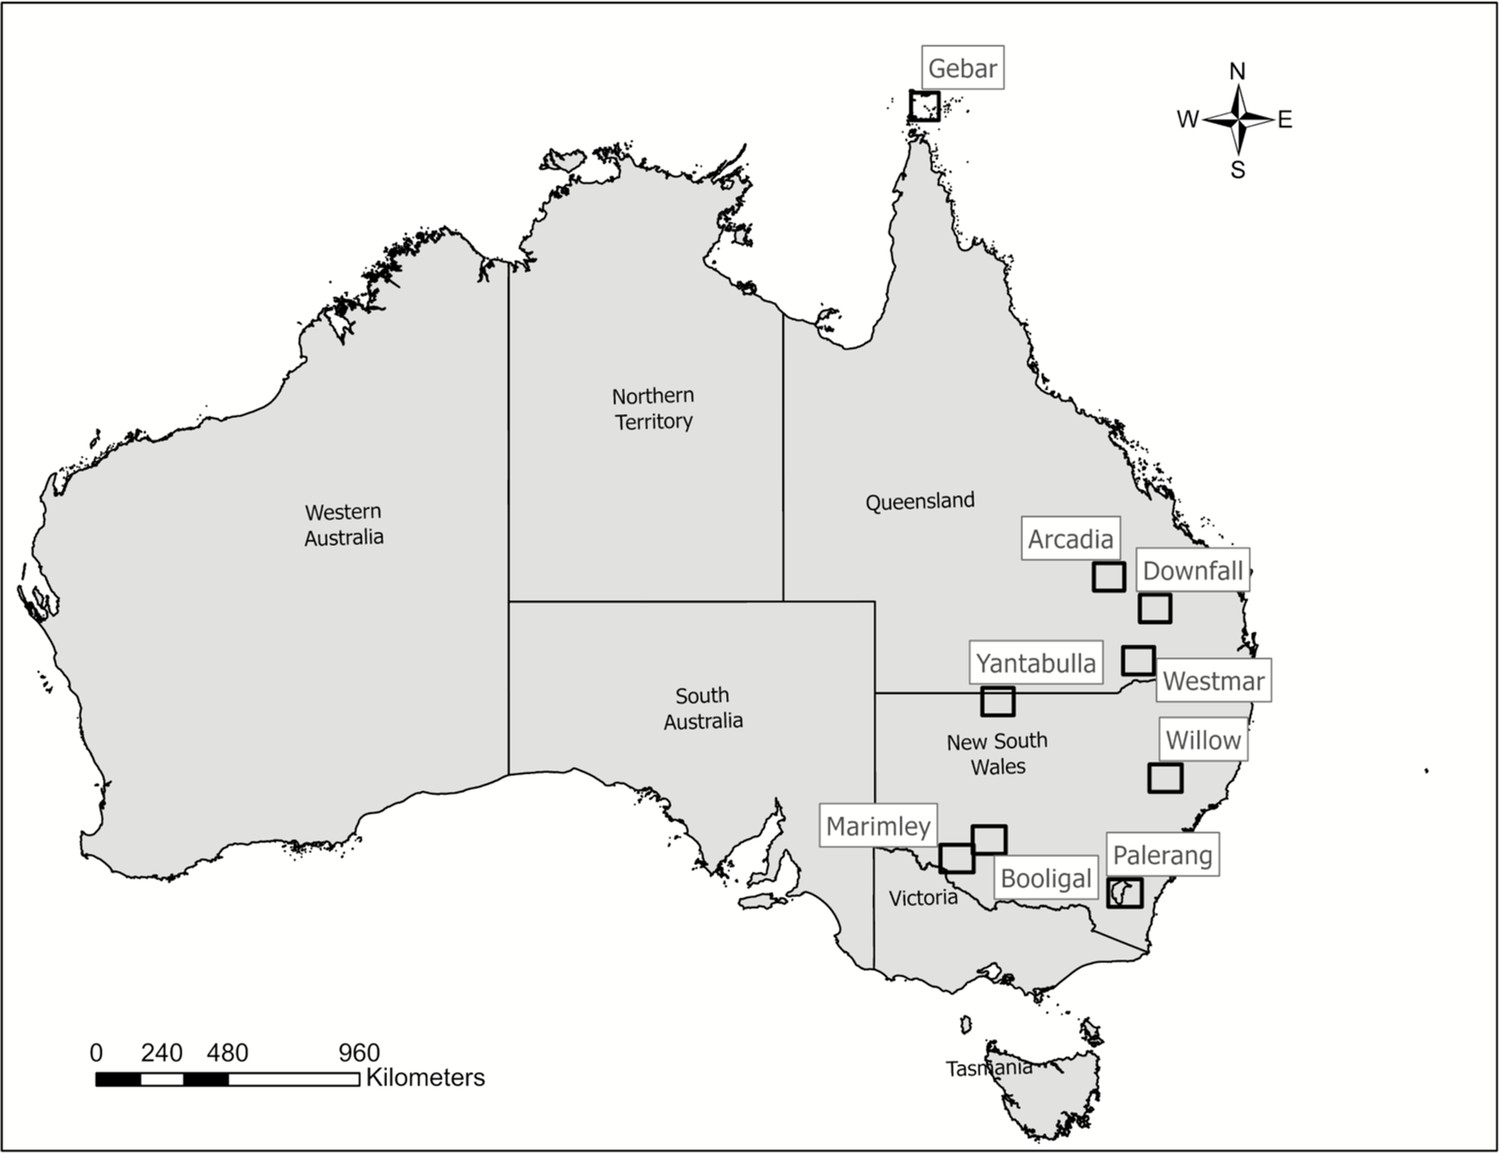
Map of Australia identifying the location (name of the population) of the study site.
Figure 2
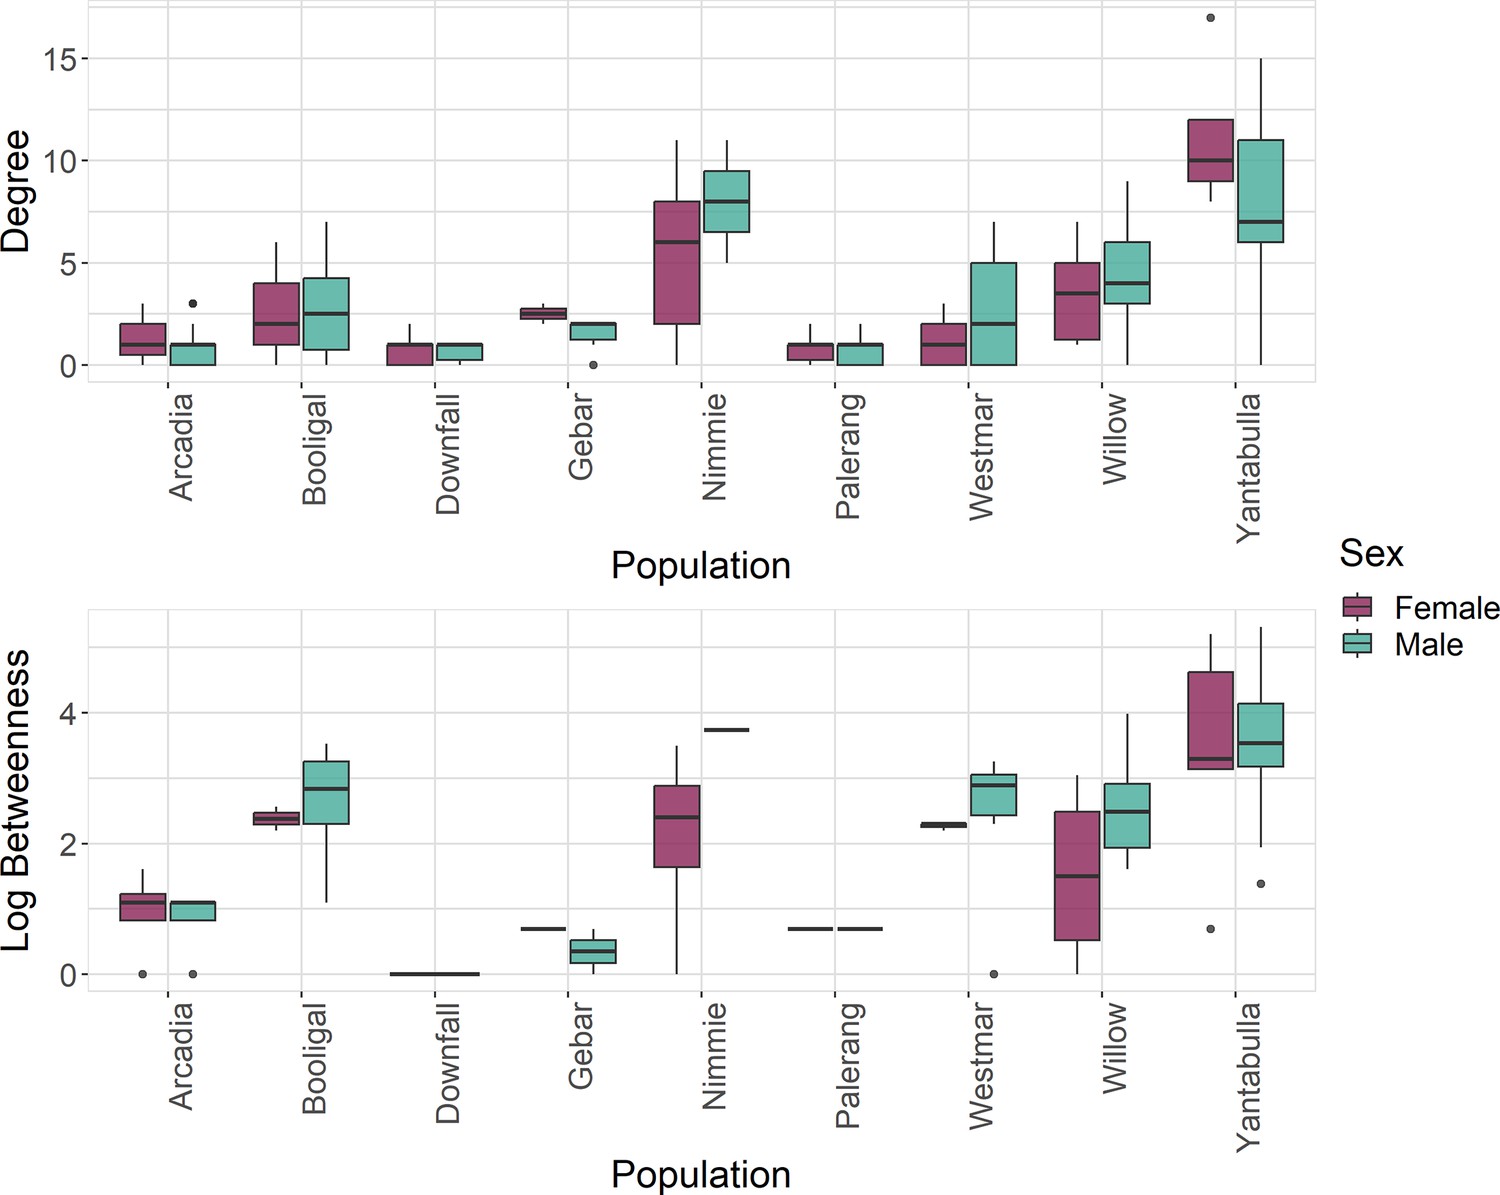
Betweenness (log) and degree measures at the individual level for each population and by sex, where green represents males and red represents females.
Figure 3 with 3 supplements

Node-level measures (5 m threshold), including betweenness, centrality, degree, log(betweenness) and strength by sex for (a) direct network and (b) indirect network.
Figure 3—figure supplement 1
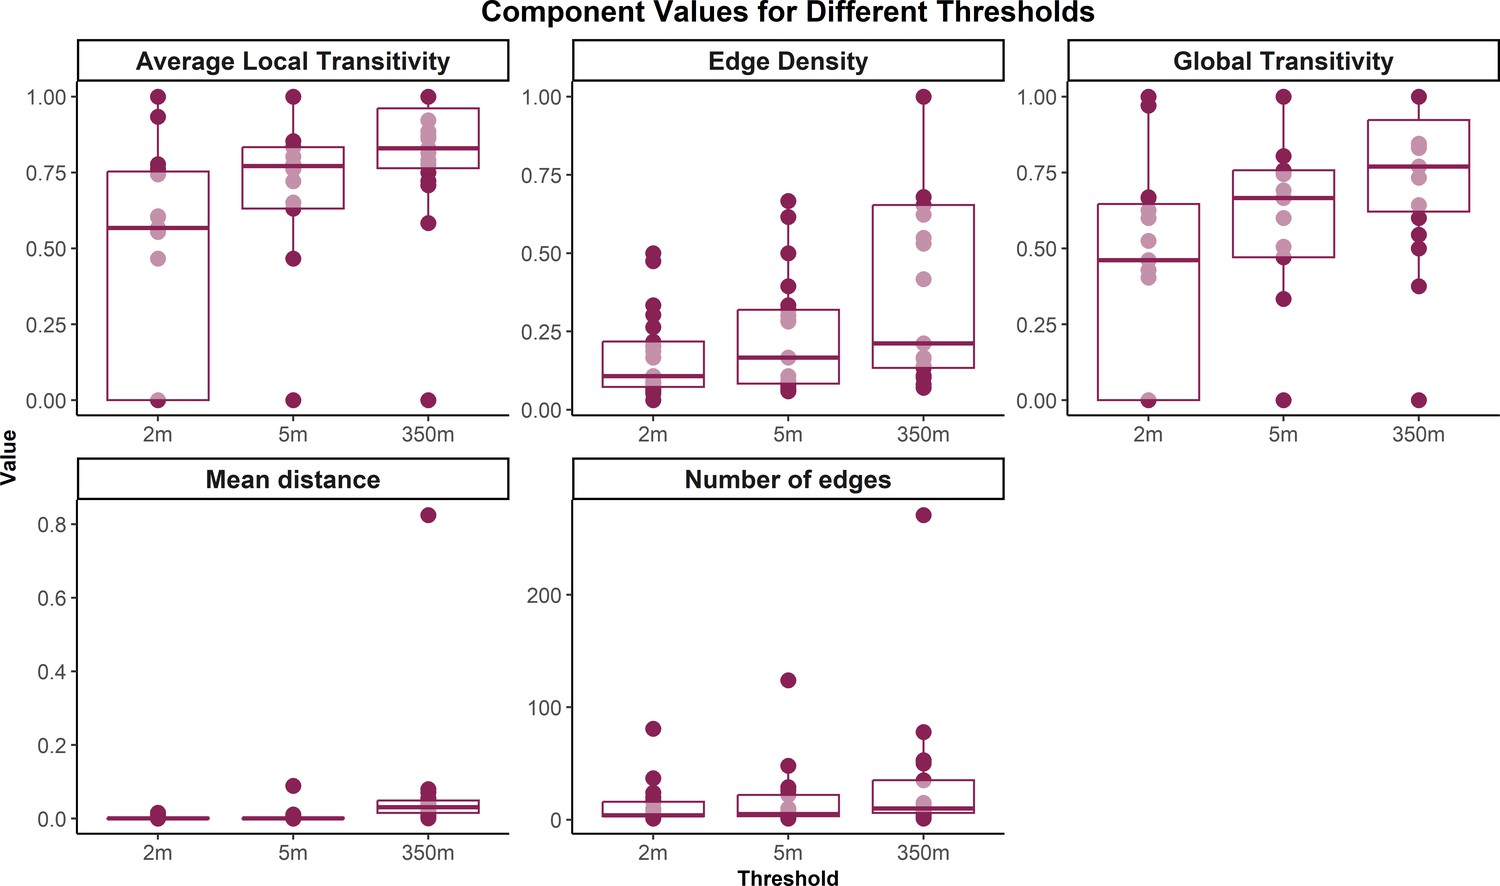
Sensitivity analysis.
Global network measures derived from thresholds of 2, 5, and 350 metres.
Figure 3—figure supplement 2
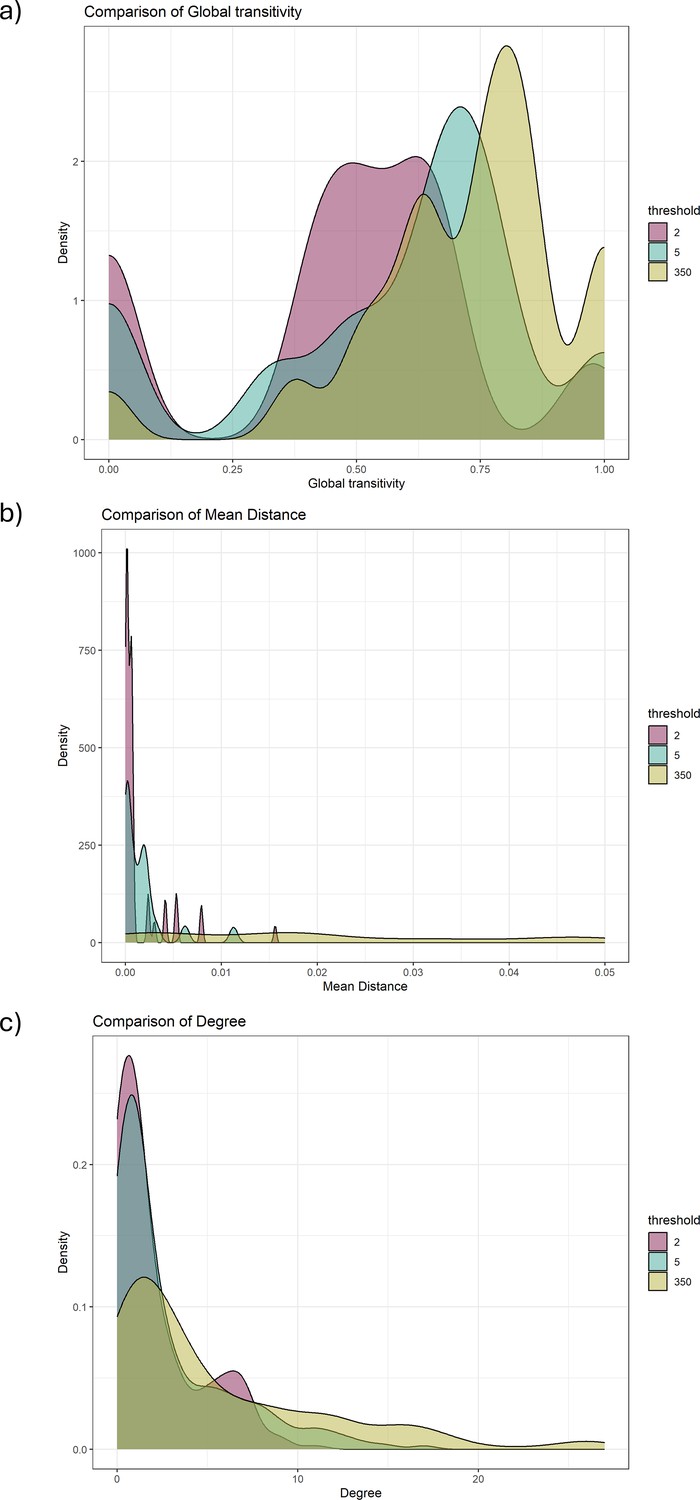
Density comparison between different thresholds.
(a) Global transitivity, (b) mean distance, and (c) degree.
Figure 3—figure supplement 3
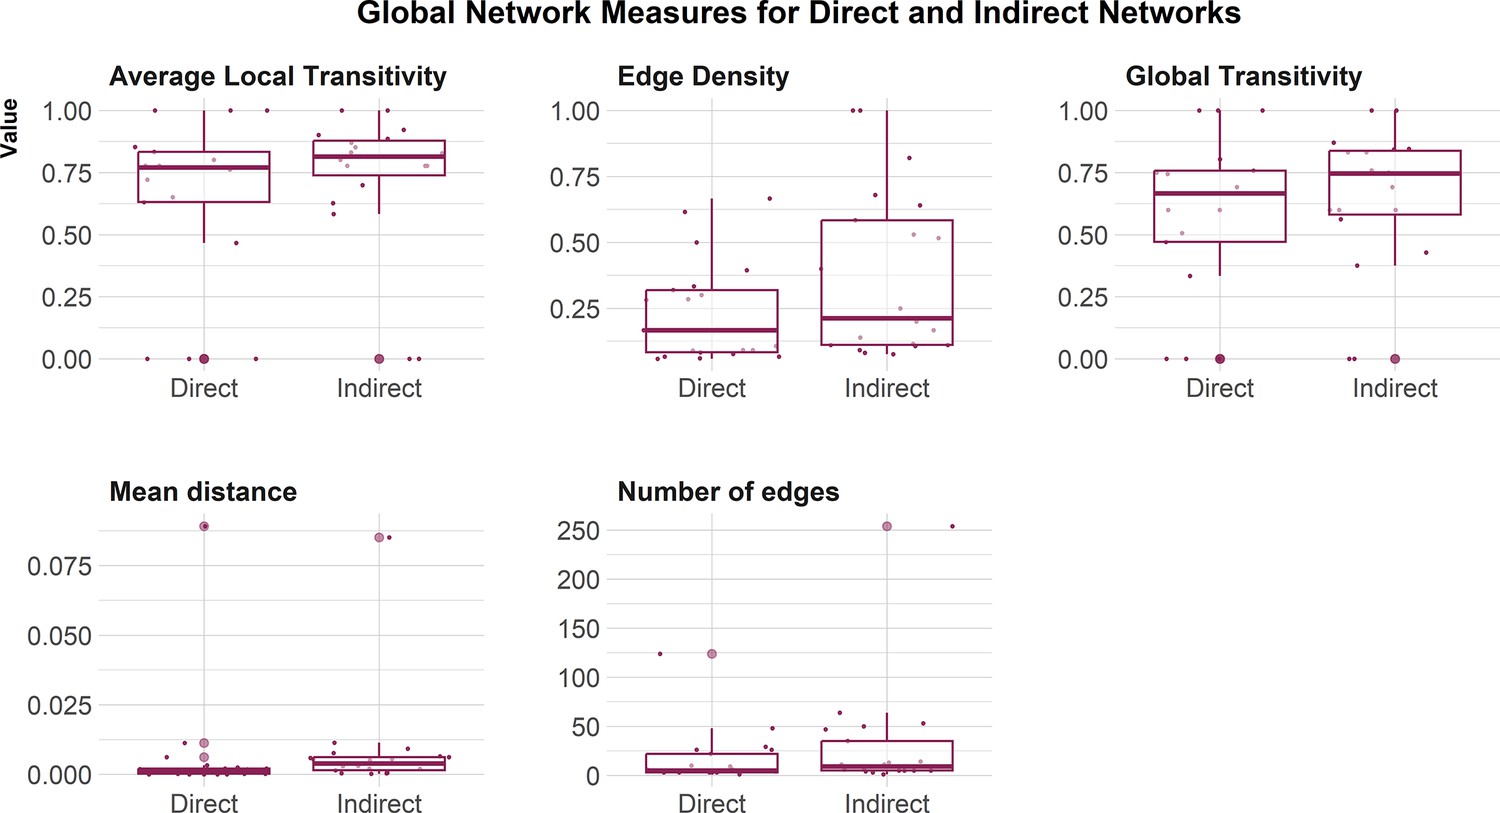
Comparison between global network measures, including average local transitivity, edge density, global transitivity, mean distance and number of edges for direct and indirect networks using a 5 metres threshold.
Figure 4
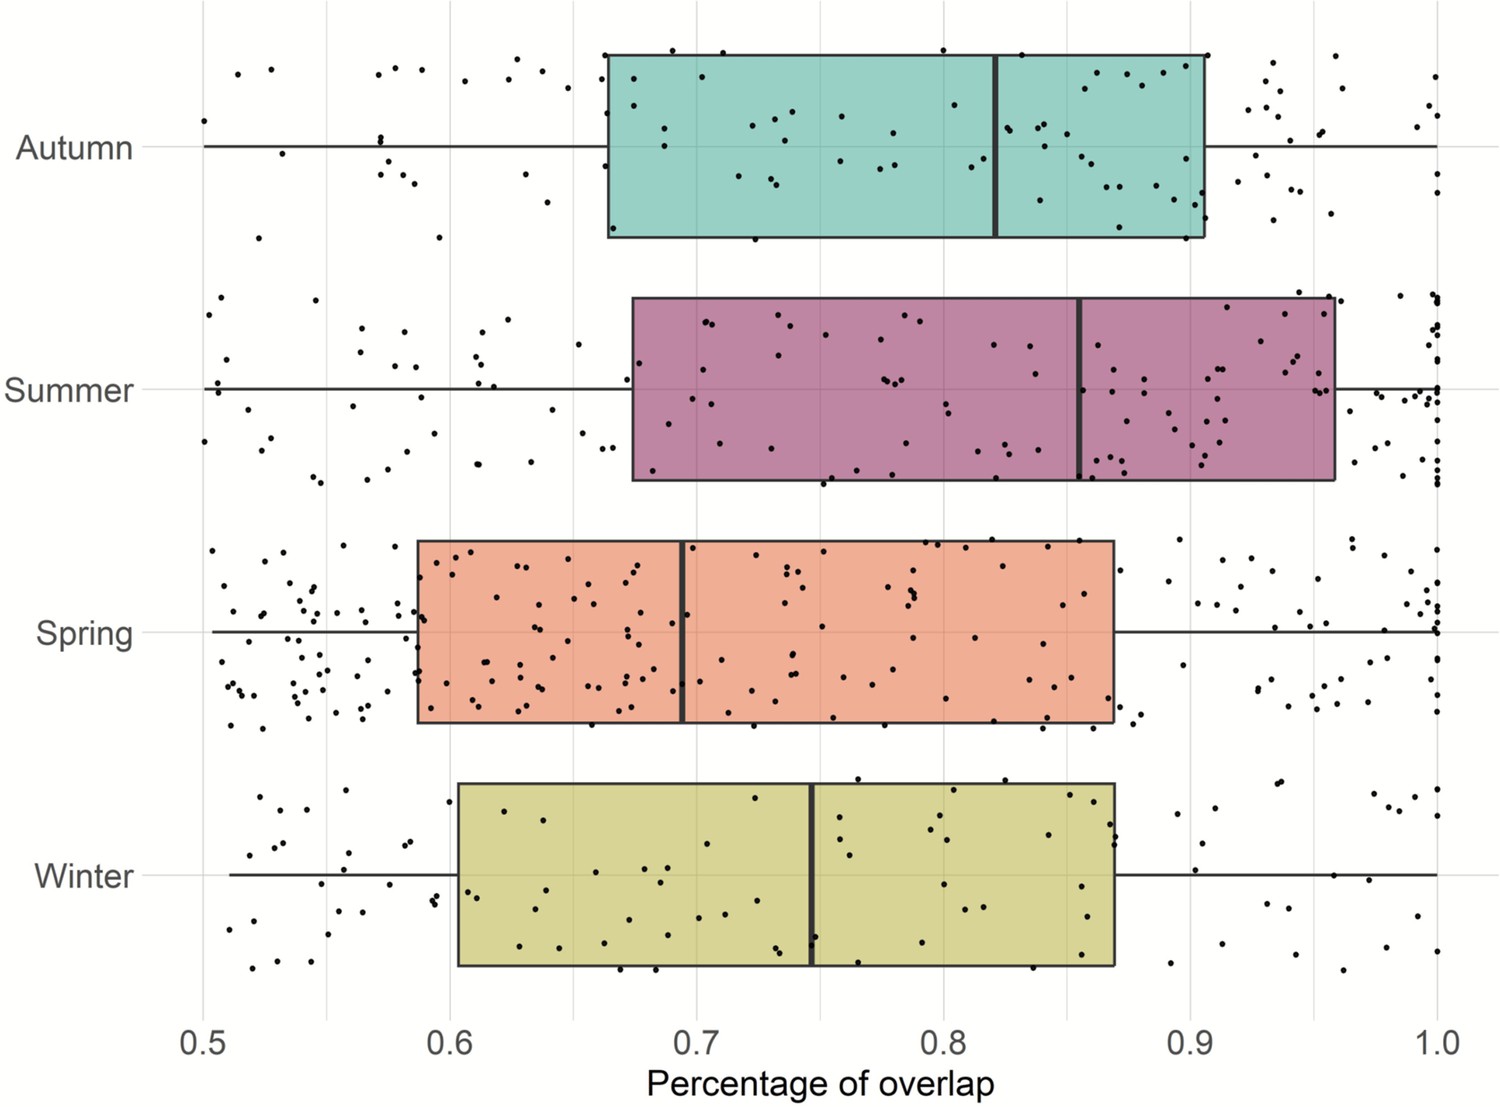
Home range overlaps per dyad for each season.
Figure 5
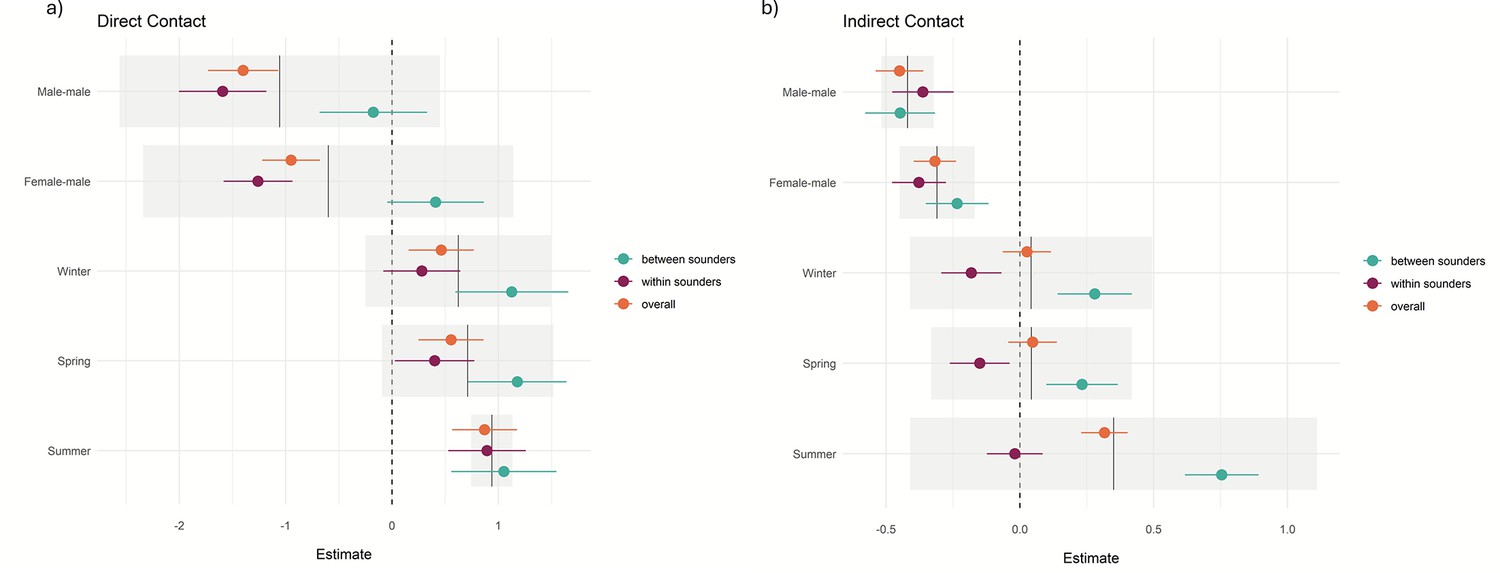
Diagram of direct and indirect means contact rate for each season for dyads between sounders and within sounders per year and population.
Figure 6 with 1 supplement
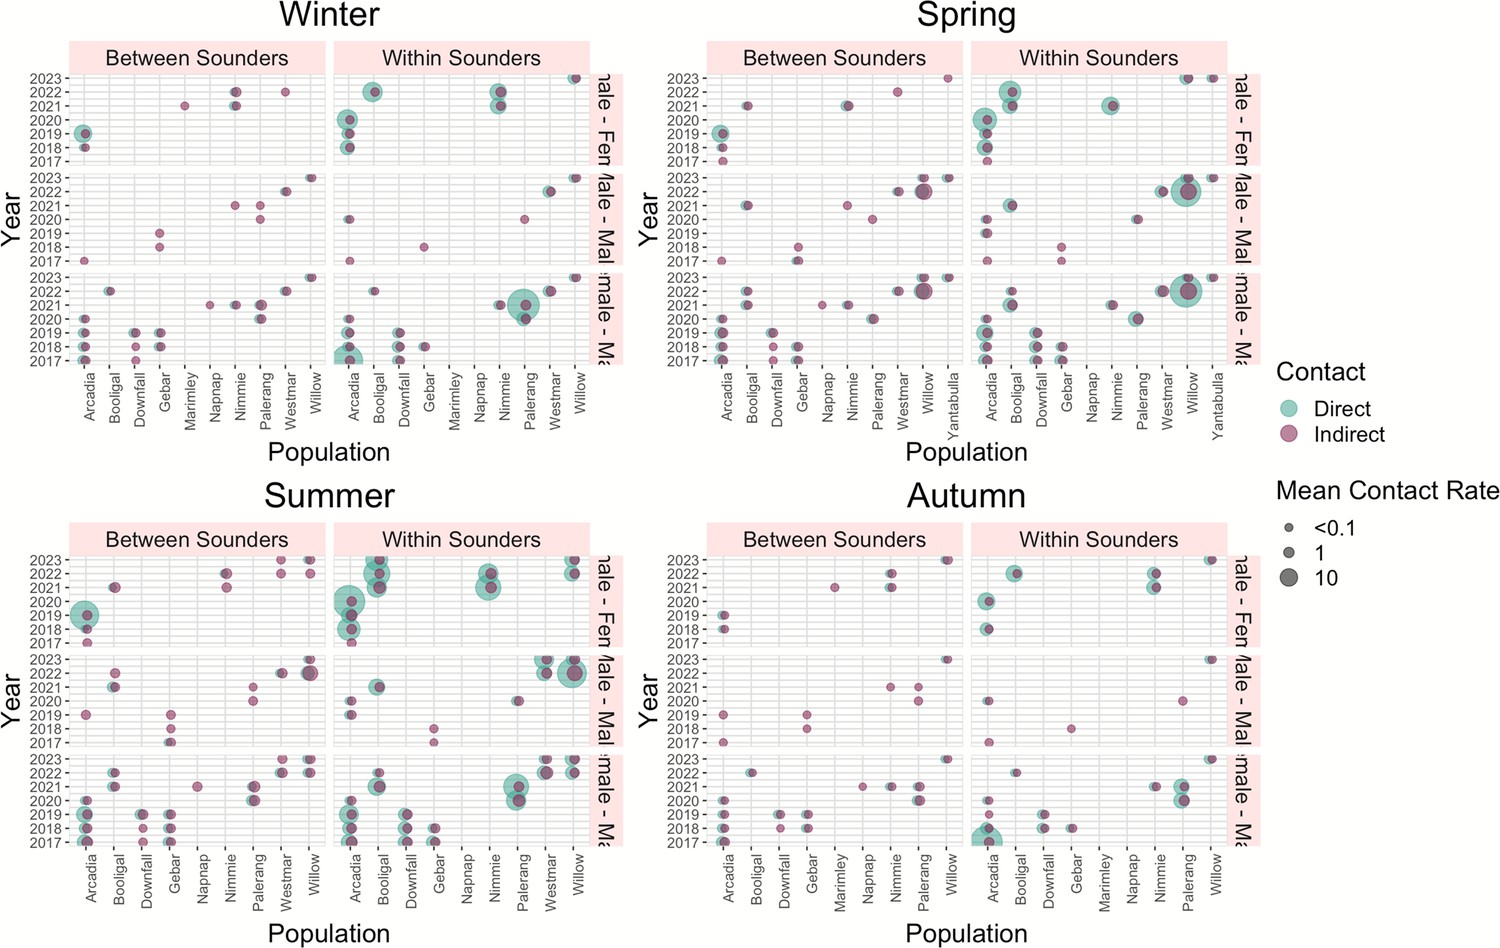
Diagram of direct and indirect mean contact rate for each season for dyads between sounders and within sounders per year and population.
Figure 6—figure supplement 1
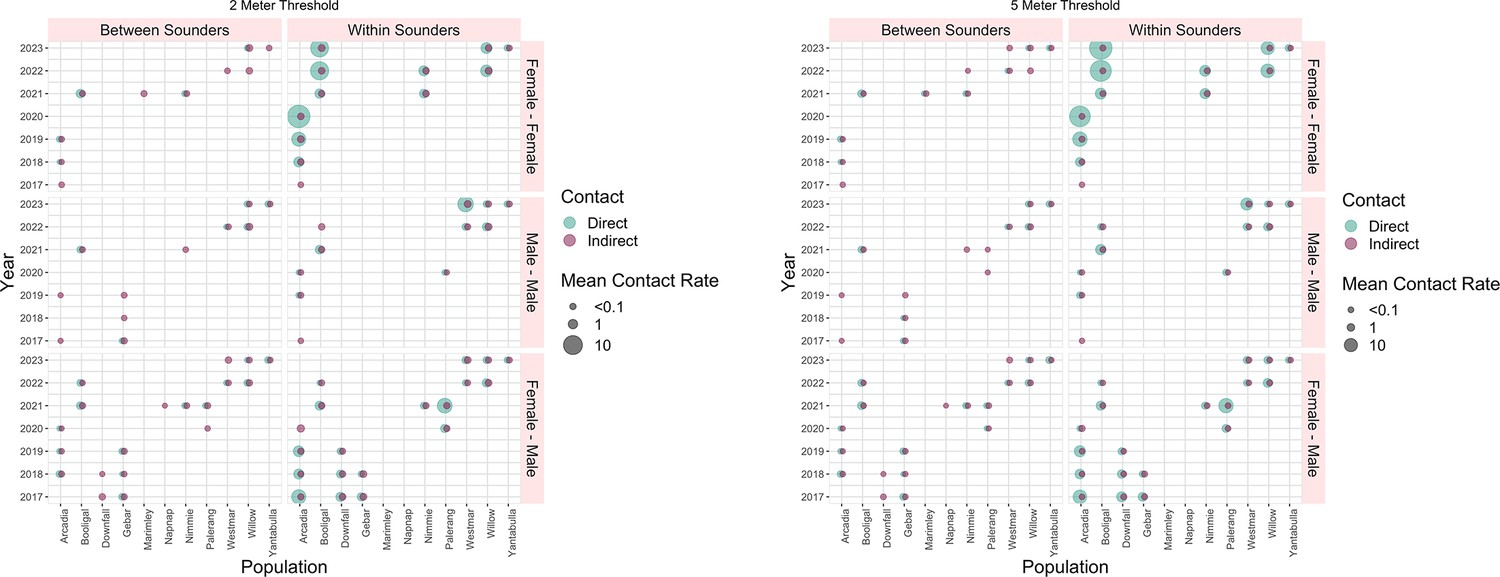
Diagram of direct and indirect means contact rate for dyads between sounders and within sounders per year and population with a 2 metres threshold and a 5 metres threshold.
Tables
Table 1
Differences between sex and network measures using Wilcoxon rank-sum test for direct and indirect contact.
| Direct Contact Network | Indirect Contact Networks | |||||||
|---|---|---|---|---|---|---|---|---|
| Network measures | Mean rank (SD) | W Statistic | p-value | Mean rank (SD) | W Statistic | p-value | ||
| Female | Male | Female | Male | |||||
| Centrality | 0.263 (0.44) | 0.146 (0.32) | 7215.5 | 0.968 | 0.304 (0.41) | 0.256 (0.36) | 7204 | 0.985 |
| Betweenness | 4.77 (20.5) | 7.75 (23.0) | 6707.5 | 0.25 | 3.06 (7.59) | 8.51 (18.1) | 6162.5 | 0.021 |
| Strength | 0.012 (0.019) | 0.004 (0.009) | 8311.5 | 0.037 | 0.033 (0.043) | 0.023 (0.033) | 8086.5 | 0.097 |
| Degree | 2.56 (3.10) | 3.10 (3.60) | 6892 | 0.569 | 4.01 (4.55) | 5.93 (6.34) | 6165.5 | 0.054 |
| SD: Standard deviation | ||||||||
Table 2
Association between the mean contact rate within sounders, between sounders and overall and the distinct types of contacts (female-female, male-male, female-male) and seasons (autumn, spring, summer, winter), for direct and indirect contact calculated with 5 metres threshold.
| Response variable | Direct contact (within 5 min) | Indirect contact (within 5 d) | |||||
|---|---|---|---|---|---|---|---|
| Estimate | Std error | p-value | Estimate | Std error | p-value | ||
| Overall contact rates (within and between) | |||||||
| Contact type (within) Male-male Female-male Spring Summer Winter | 0.86 | 0.20 | <0.001 | 0.67 | 0.05 | <0.001 | |
| –1.40 | 0.33 | <0.001 | –0.45 | 0.09 | <0.001 | ||
| –0.95 | 0.27 | <0.001 | –0.31 | 0.07 | <0.001 | ||
| 0.56 | 0.31 | 0.07 | 0.04 | 0.09 | 0.06 | ||
| 0.87 | 0.30 | 0.004 | 0.31 | 0.08 | <0.001 | ||
| 0.46 | 0.30 | 0.13 | 0.03 | 0.09 | 0.77 | ||
| Contact rates within the sounder | |||||||
| Male-male Female-male Spring Summer Winter | –1.59 | 0.45 | <0.001 | –0.36 | 0.12 | 0.001 | |
| –1.26 | 0.41 | <0.001 | –0.37 | 0.10 | <0.001 | ||
| 0.40 | 0.32 | 0.28 | –0.15 | 0.11 | 0.18 | ||
| 0.89 | 0.37 | 0.01 | –0.01 | 0.10 | 0.85 | ||
| 0.28 | 0.36 | 0.43 | –0.18 | 0.11 | 0.11 | ||
| Contact rates between sounders | |||||||
| Male-male Female-male Spring Summer Winter | –0.17 | 0.51 | 0.73 | –0.44 | 0.13 | <0.001 | |
| 0.41 | 0.45 | 0.37 | –0.23 | 0.11 | 0.04 | ||
| 1.18 | 0.46 | 0.13 | 0.23 | 0.13 | 0.08 | ||
| 1.05 | 0.49 | 0.04 | 0.75 | 0.13 | <0.001 | ||
| 1.13 | 0.53 | 0.04 | 0.27 | 0.13 | 0.05 | ||
| Std error: standard error | |||||||
Additional files
-
Supplementary file 1
Summary of the mean direct contact rate per population, year, season, and type of dyad.
- https://cdn.elifesciences.org/articles/102643/elife-102643-supp1-v1.docx
-
MDAR checklist
- https://cdn.elifesciences.org/articles/102643/elife-102643-mdarchecklist1-v1.docx
Download links
A two-part list of links to download the article, or parts of the article, in various formats.
Downloads (link to download the article as PDF)
Open citations (links to open the citations from this article in various online reference manager services)
Cite this article (links to download the citations from this article in formats compatible with various reference manager tools)
Quantifying feral pig interactions to inform disease transmission networks
eLife 13:RP102643.
https://doi.org/10.7554/eLife.102643.3


