A circadian clock drives behavioral activity in Antarctic krill (Euphausia superba) and provides a potential mechanism for seasonal timing
- Neurobiology and Genetics, University of Würzburg, Biocenter, Theodor-Boveri-Institute, Germany
- Section Polar Biological Oceanography, Alfred Wegener Institute Helmholtz Centre for Polar and Marine Research, Germany
- National Oceanography Centre, European Way, United Kingdom
- Institute for Chemistry and Biology of the Marine Environment, University of Oldenburg, Germany
- Helmholtz Institute for Functional Marine Biodiversity at the University of Oldenburg (HIFMB), Germany
Figures
Figure 1 with 1 supplement
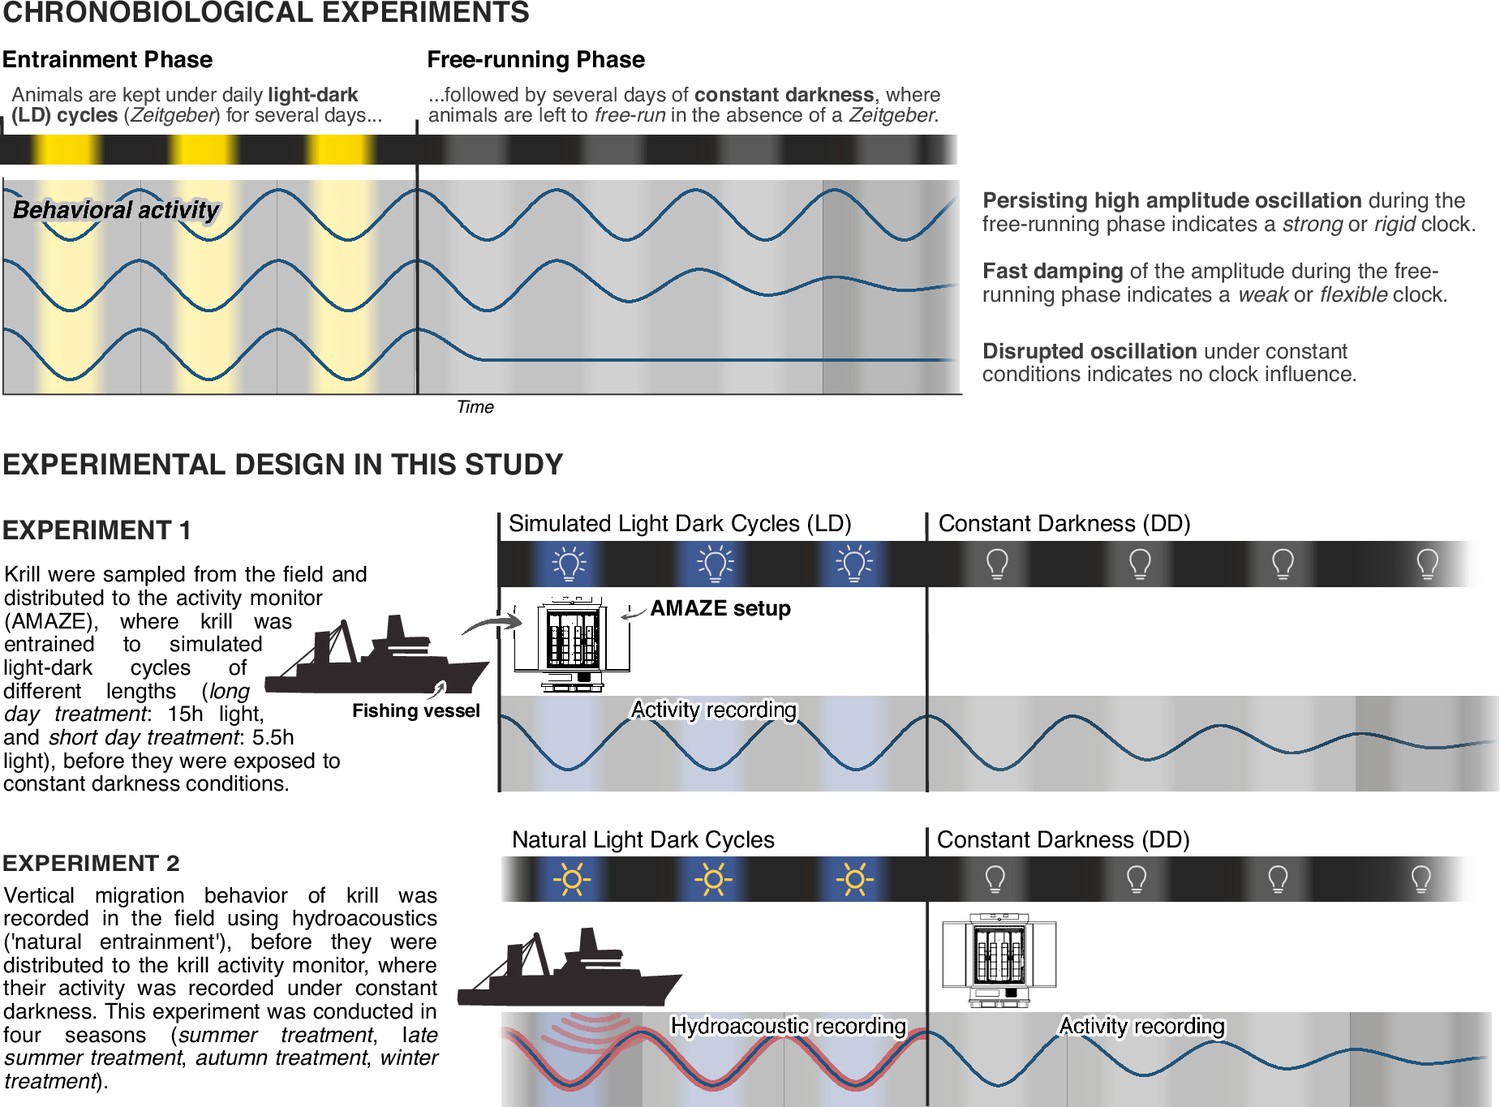
Experimental design of chronobiological studies.
Overview of the basic principle of chronobiological experiment design and how it is adopted in our study to characterize the influence of the circadian clock on swimming activity of wild-caught Antarctic krill.
Figure 1—figure supplement 1
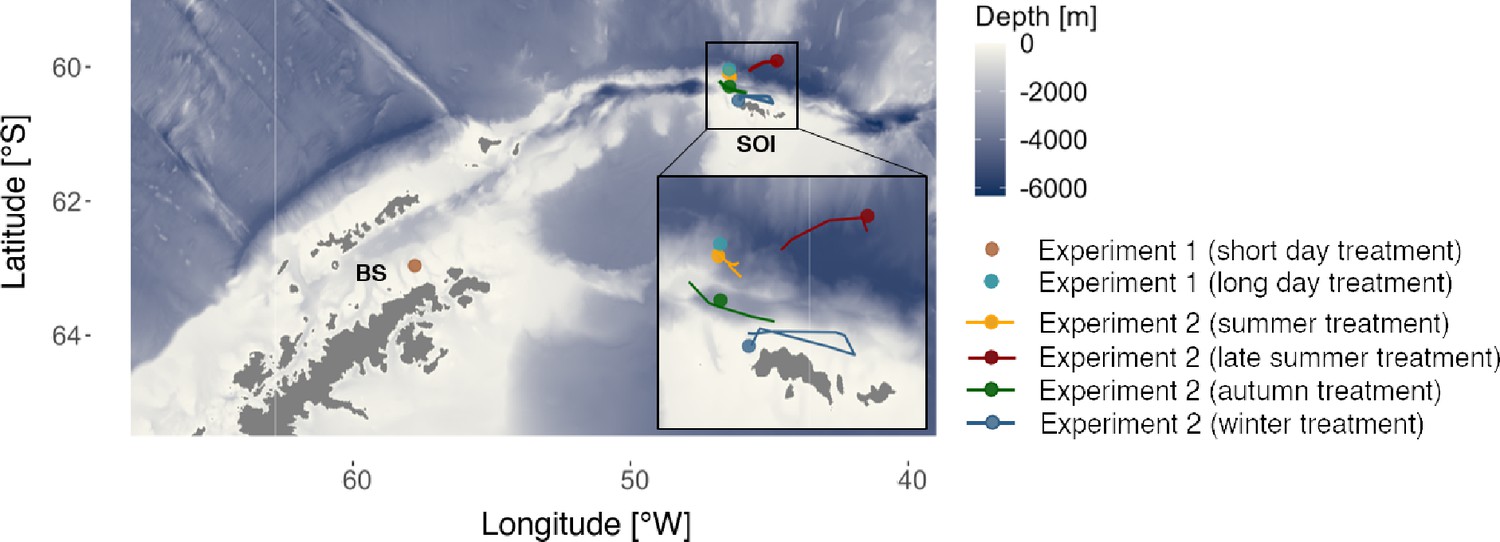
Locations of krill sampling and hydroacoustic recordings for behavioral experiments.
Colored dots indicate sampling locations for the respective behavioral experiments. Colored lines indicate the cruise track of the fishing vessel during recording of hydroacoustic data prior to sampling for behavioral experiment 2. BS: Bransfield Strait. SOI: South Orkney Islands. Bathymetric data were retrieved from the International Bathymetric Chart of the Southern Ocean (500 m×500 m resolution, https://ibcso.org/).
Figure 2 with 3 supplements
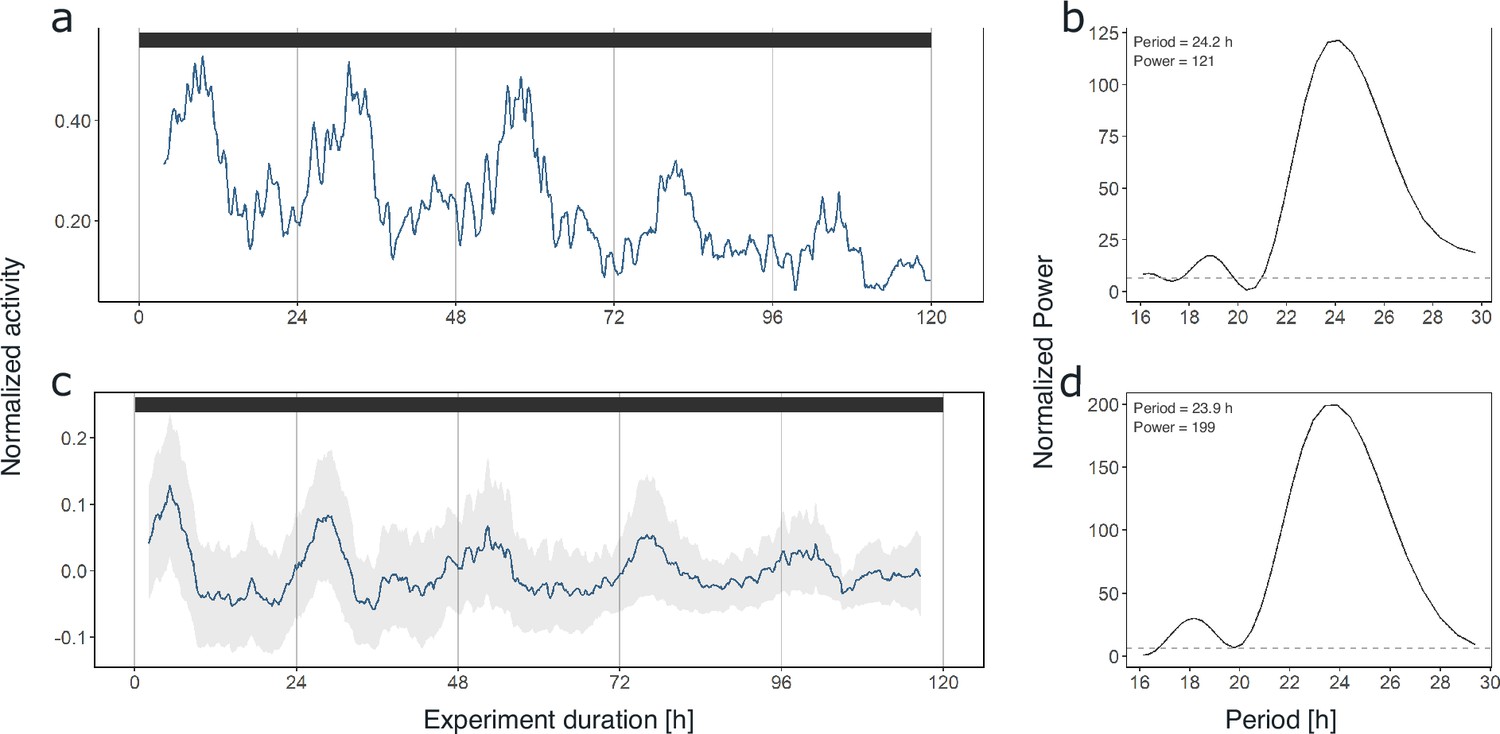
Krill swimming activity persists under constant conditions.
Swimming activity under 5 days of DD conditions in experiment 1 of individual #9 after entrainment to simulated short-day conditions (a) and group mean swimming activity of rhythmic individuals under 5 days of DD conditions from the same experiment (n=6, c). The result from Lomb-Scargle periodogram (LSP) analysis shows significant circadian rhythmicity of swimming activity of individual #9 (period: 24.2 hr, b) as well as for group mean swimming activity (period: 23.9 hr, d) during DD conditions of experiment 1 (short-day treatment). Gray shading represents standard error of the mean (s.e.m.). Color bars at the top indicate light conditions (constant darkness).
Figure 2—figure supplement 1

Krill group activity under LD conditions.
Group mean swimming activity during experiment 1 of krill under long-day (n=9, a) and short-day (n=11, b) simulations. Shading around the line depicts the standard error of the mean (s.e.m.). Color bars at the top indicate the light regime provided. Data for (a) from Figure 5a in Hüppe et al., 2024.
Figure 2—figure supplement 2
Swimming activity of individual krill under LD conditions.
Normalized swimming activity during experiment 1 under 5 days of simulated short-day conditions for each individual. Color bars at the top indicate the light regime provided.
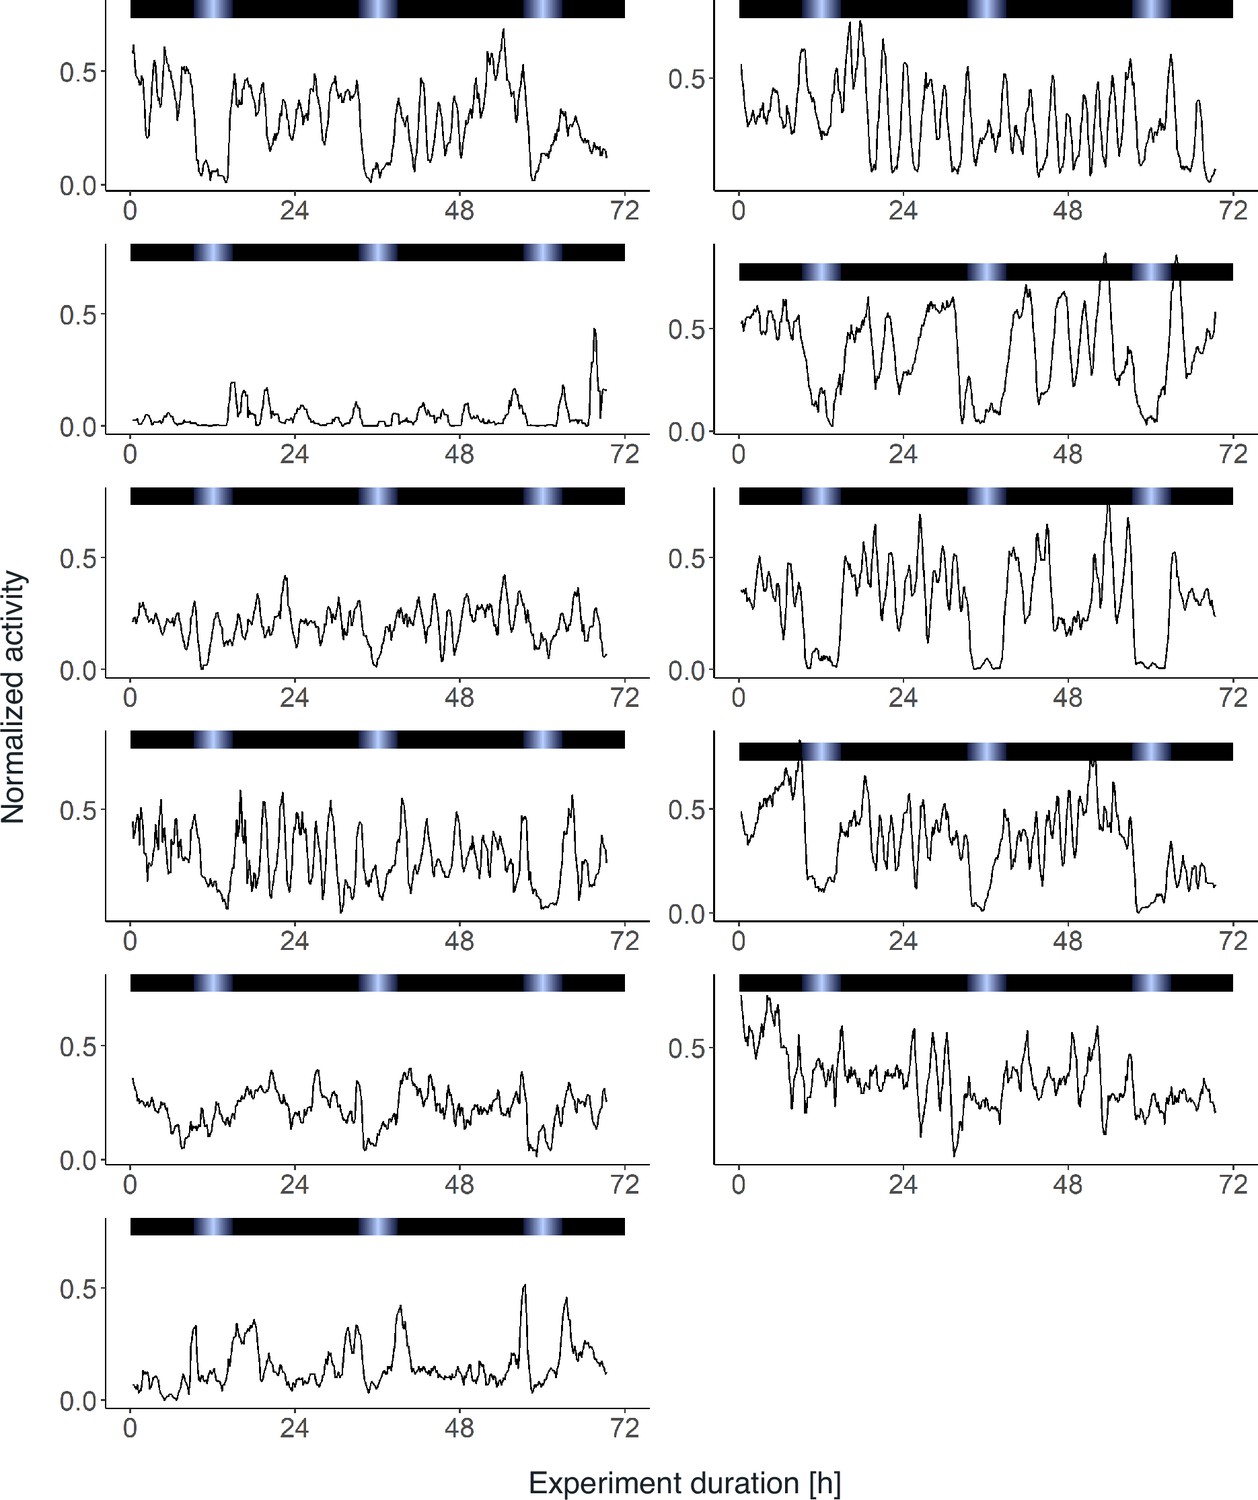
Figure 2—figure supplement 3
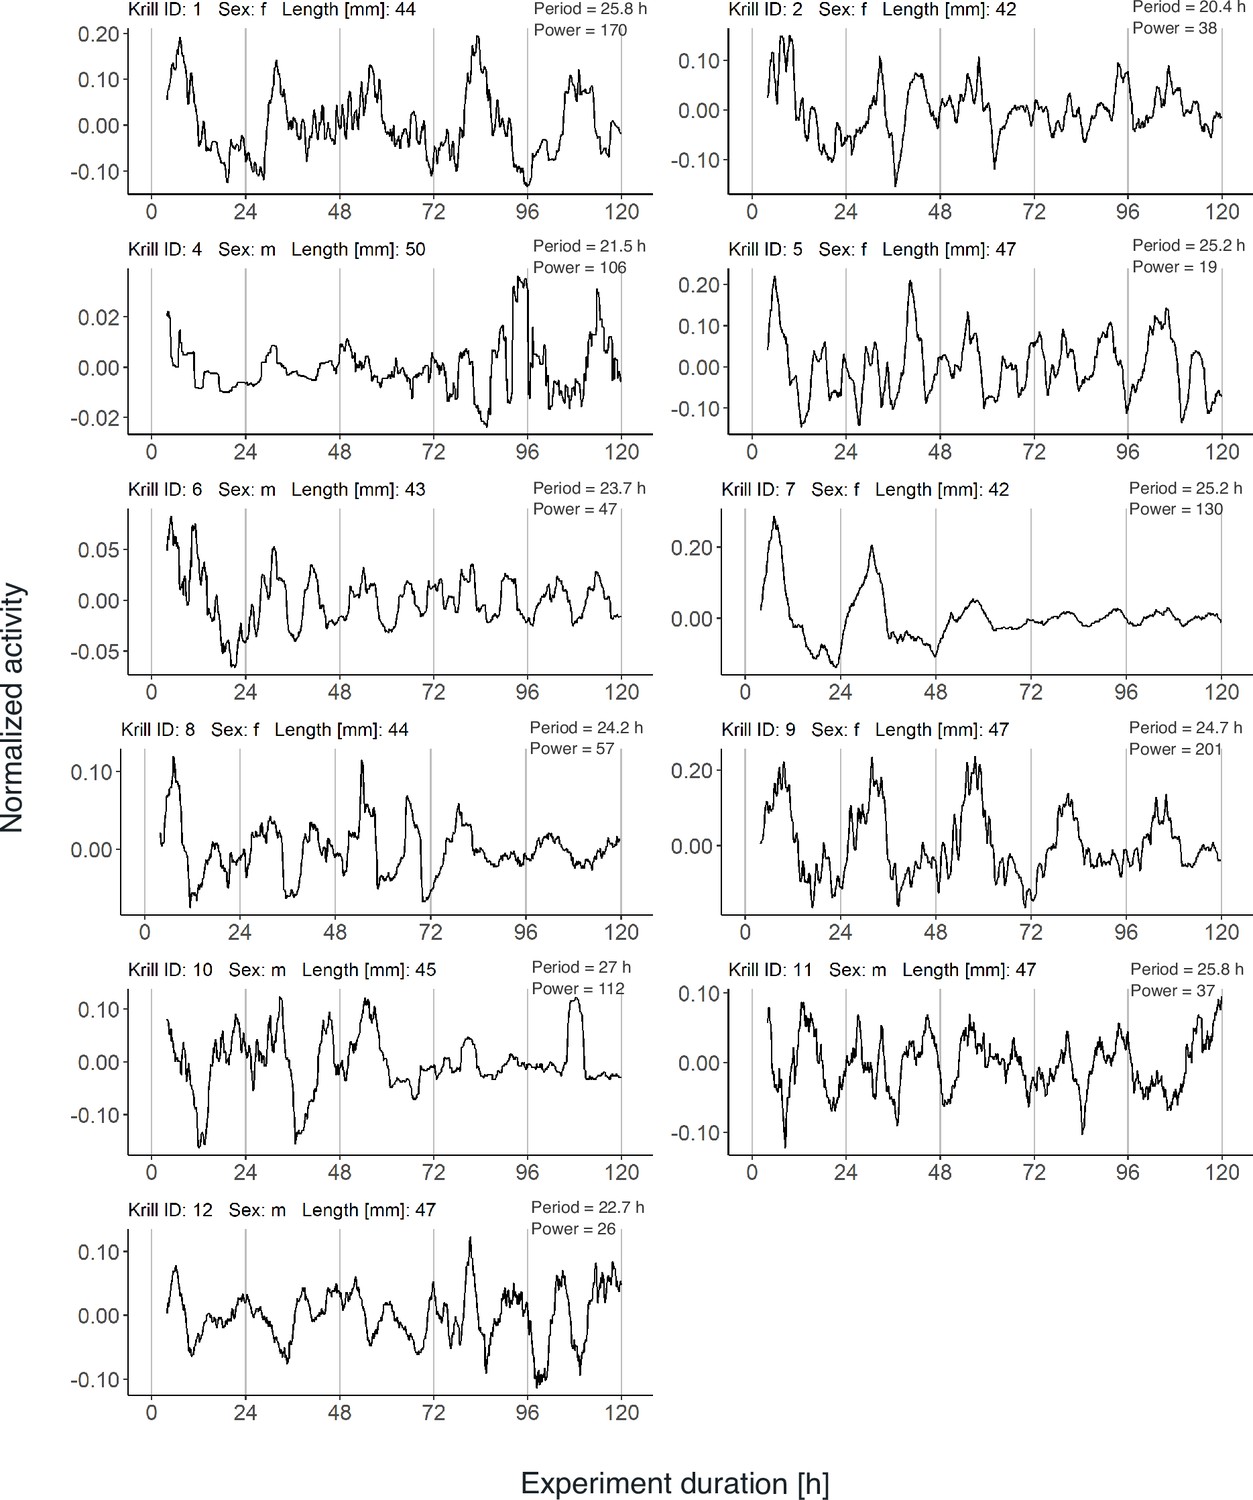
Swimming activity of individual krill under DD conditions.
Normalized and detrended swimming activity under 5 days of constant darkness (DD) after entrainment to simulated short-day conditions (experiment 1) for each individual. Period and power estimates from Lomb-Scargle periodogram (LSP) analysis are detailed for each individual.
Figure 3 with 1 supplement
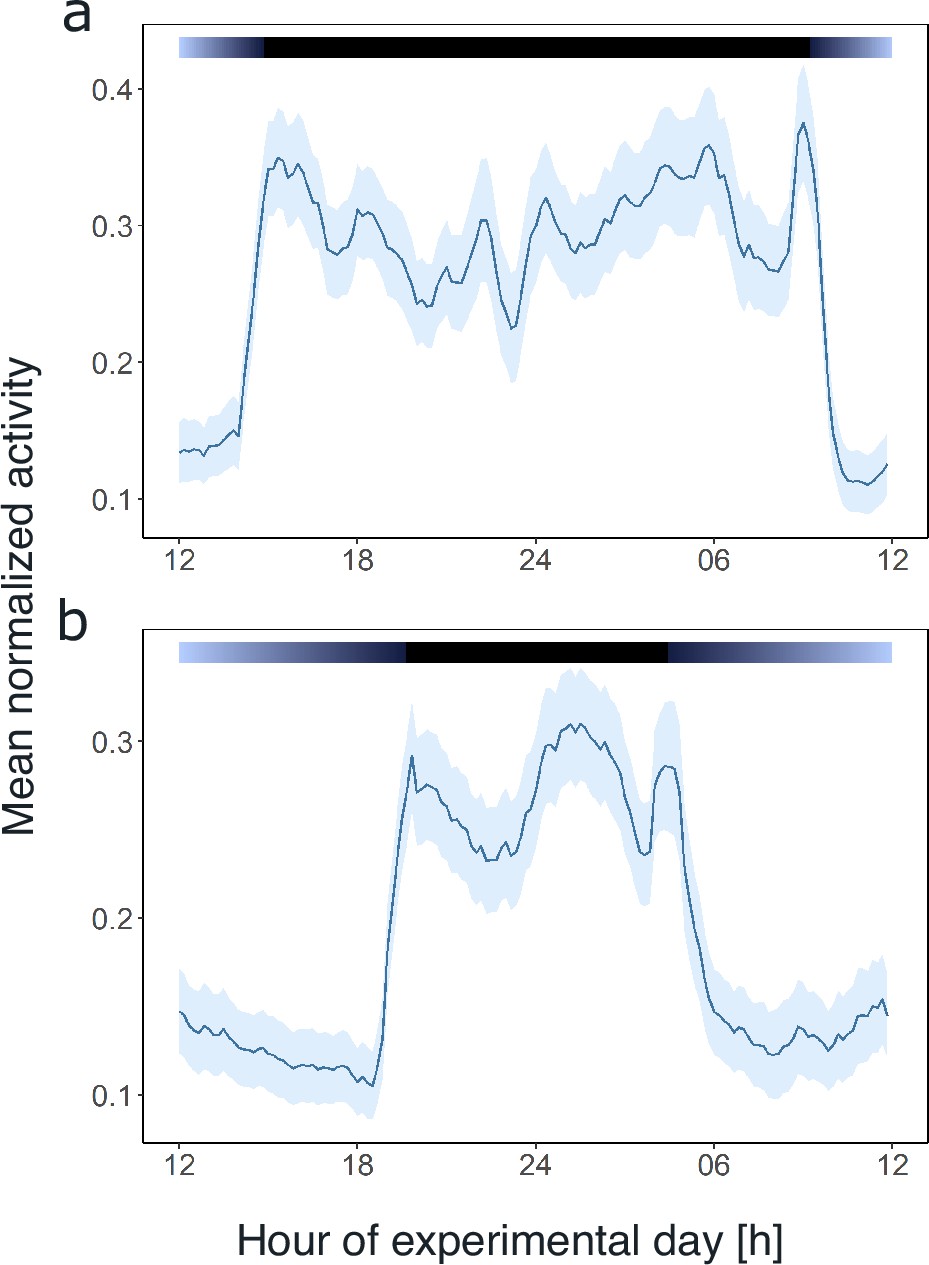
Light and the circadian clock shape the daily activity profile of krill.
Average day analysis of the group mean swimming activity during experiment 1 over 3 days of short-day simulations (short-day treatment, n=11, a) and 5 days of long-day simulations (long-day treatment, n=9, b). Color bars at the top indicate light regime under day-night simulations. Shading around the line represents the s.e.m. Data in (b) from Hüppe et al., 2024.
Figure 3—figure supplement 1

Comparison of daily swimming activity between LD and DD conditions.
Group mean swimming activity of rhythmic individuals over an average day under 3 days of simulated short-day conditions (n = 11, a) and 5 days of constant darkness (n = 6, b) during the short-day treatment of experiment 1. Color bars at the top indicate the light regime provided, as well as subjective day and night. Arrows indicate times of increased or decreased activity which lead to the characteristic activity pattern during the dark phase. Shading indicates the s.e.m.
Figure 4
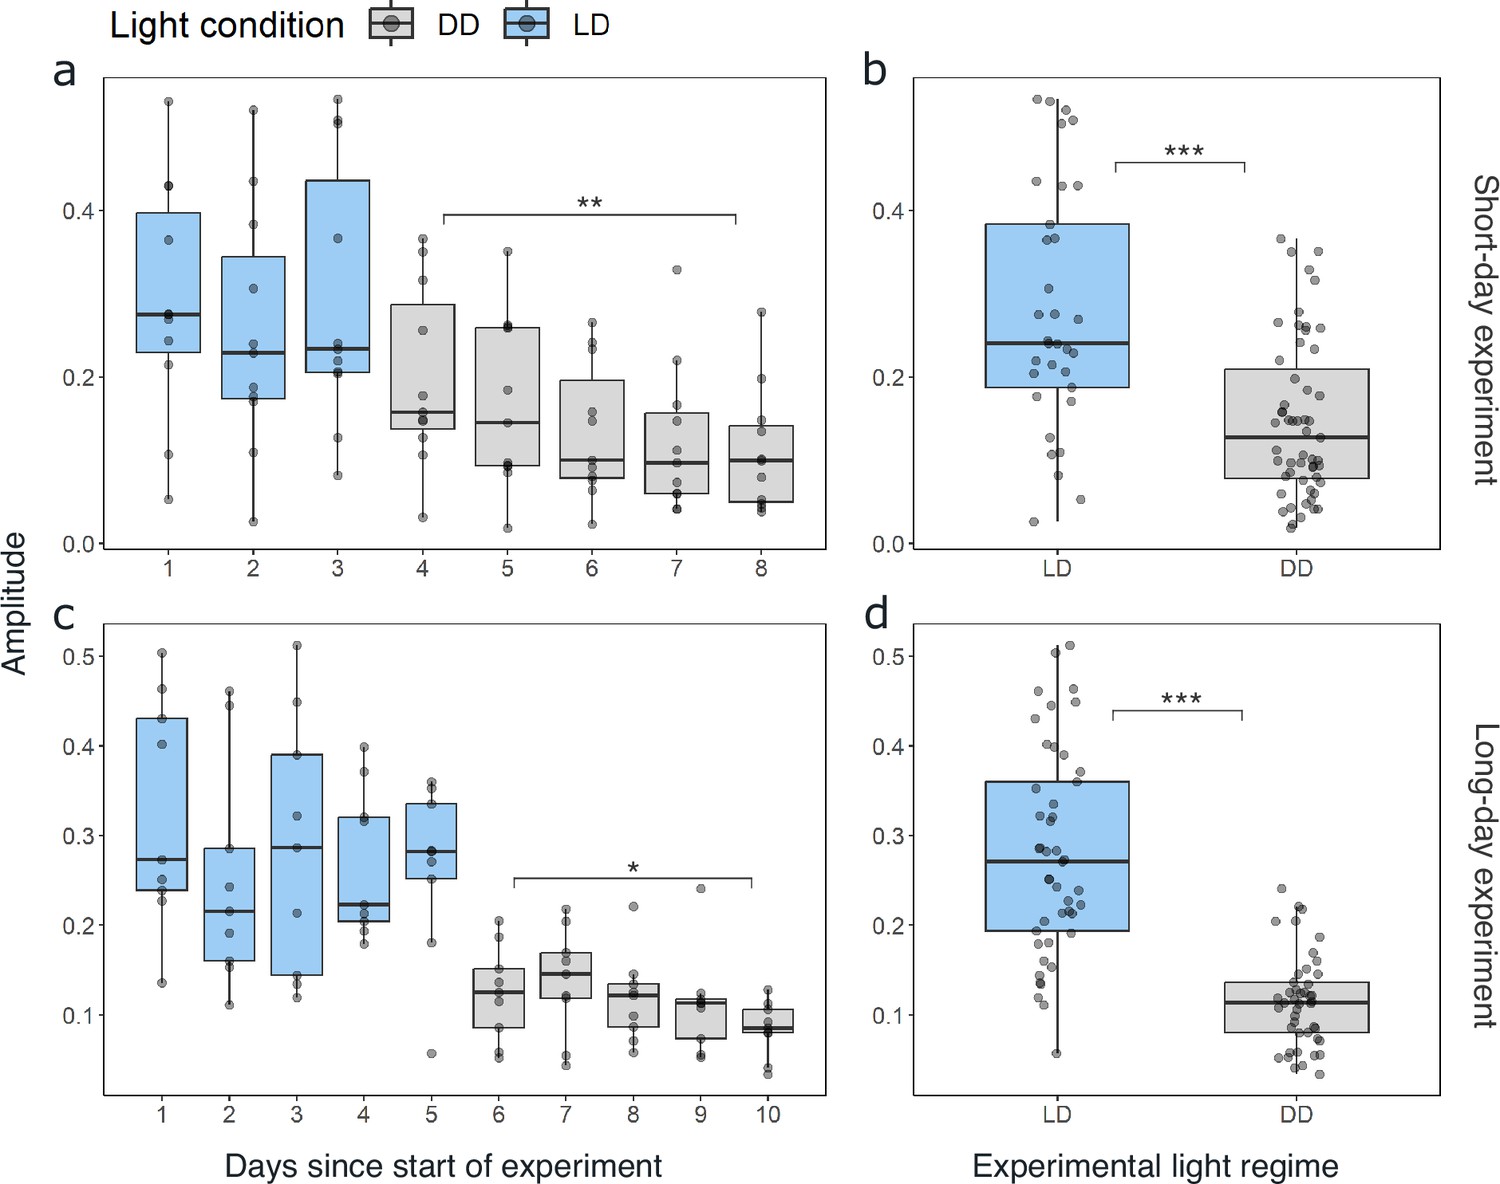
The amplitude of swimming activity decreases in DD conditions.
Distribution of the daily amplitudes of swimming activity visualized with boxplots for every day of experiment 1 for short-day (a) and long-day treatments (b). Differences in the daily amplitude of swimming activity between LD and DD conditions for short-day (b) and long-day (d) treatments. Lower and upper hinges of the boxes correspond to the 25th and 75th percentiles, the upper and lower whiskers extend to the largest and smallest value no further than 1.5 of the interquartile range, respectively, the horizontal line shows the median. Points represent daily amplitudes of individuals for each day and light condition. Differences in amplitude between first and last day under DD tested with paired t-test for short-day (a; n=11, t=3.197, df = 10, p-value=0.005) and long-day treatments (c, n=9, t=2.731, df = 8, p-value=0.012), and between LD and DD conditions with Mann-Whitney U-test for experiment 1 (b; n=88, p-value=<0.001) and experiment 2 (d; n=90, p-value<0.001). Significance levels: p<0.05: *, p<0.01: **, p<0.001: ***.
Figure 5 with 6 supplements
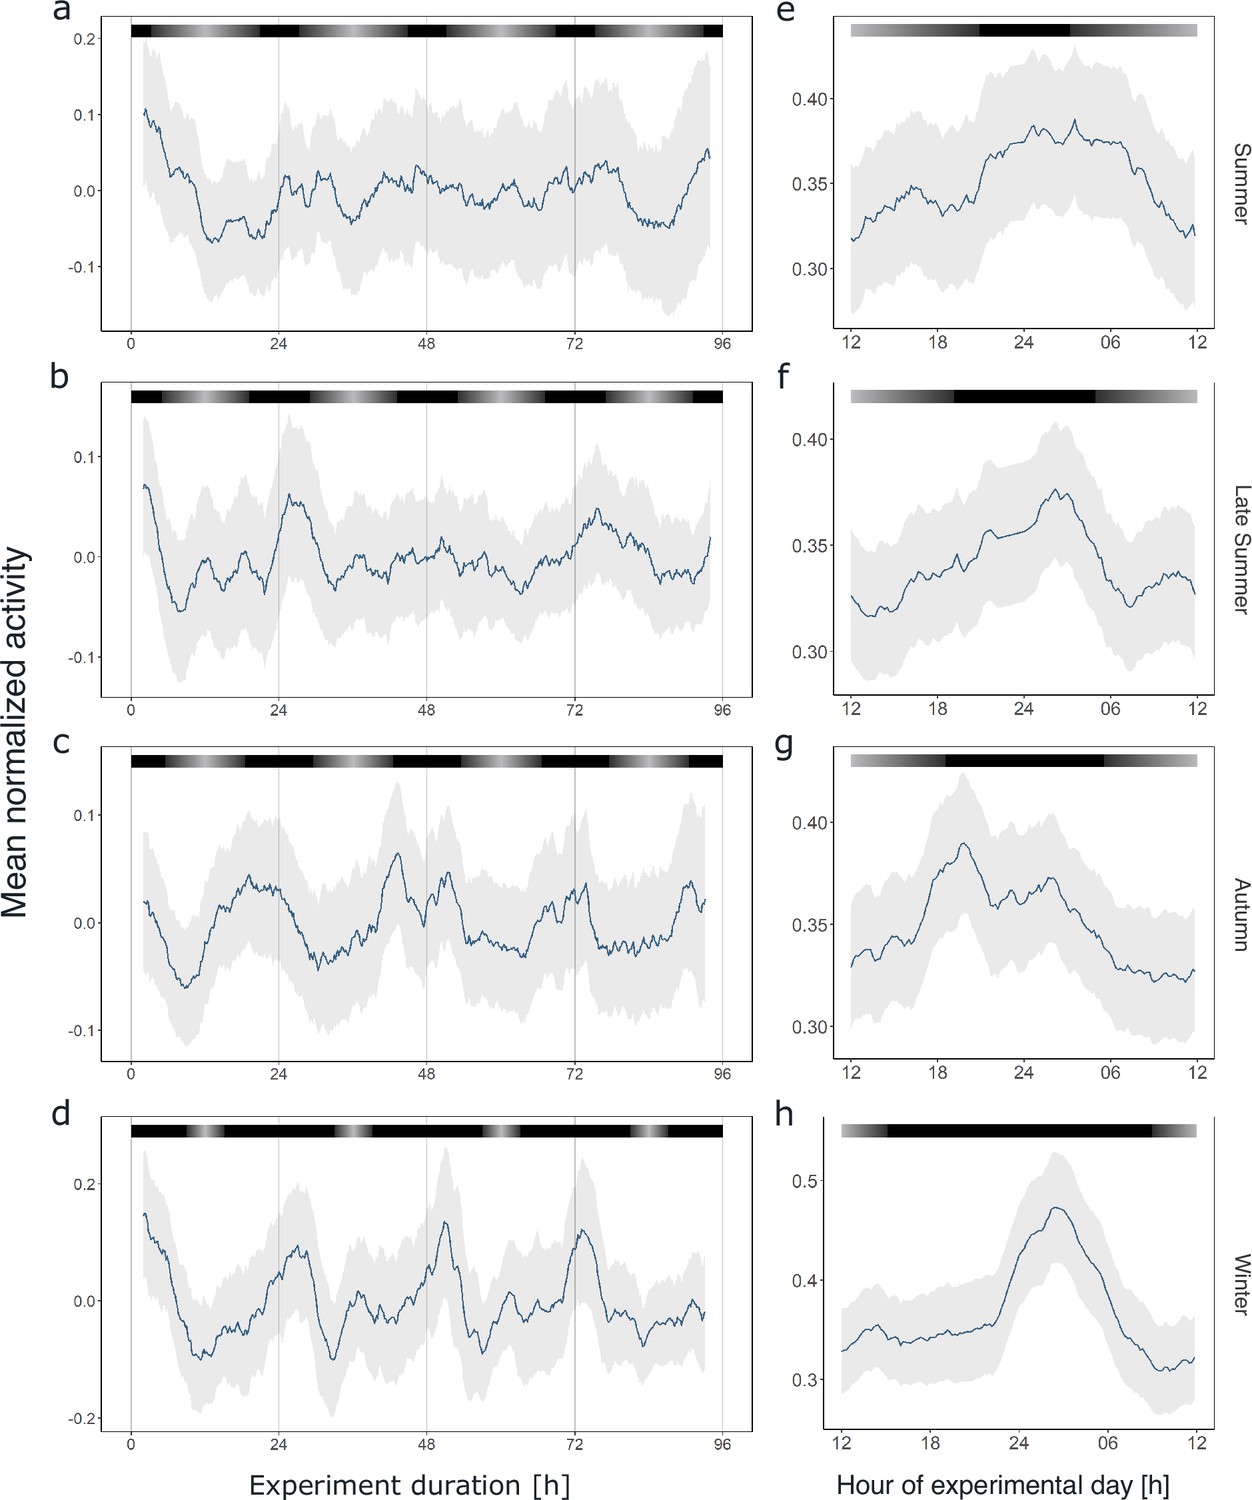
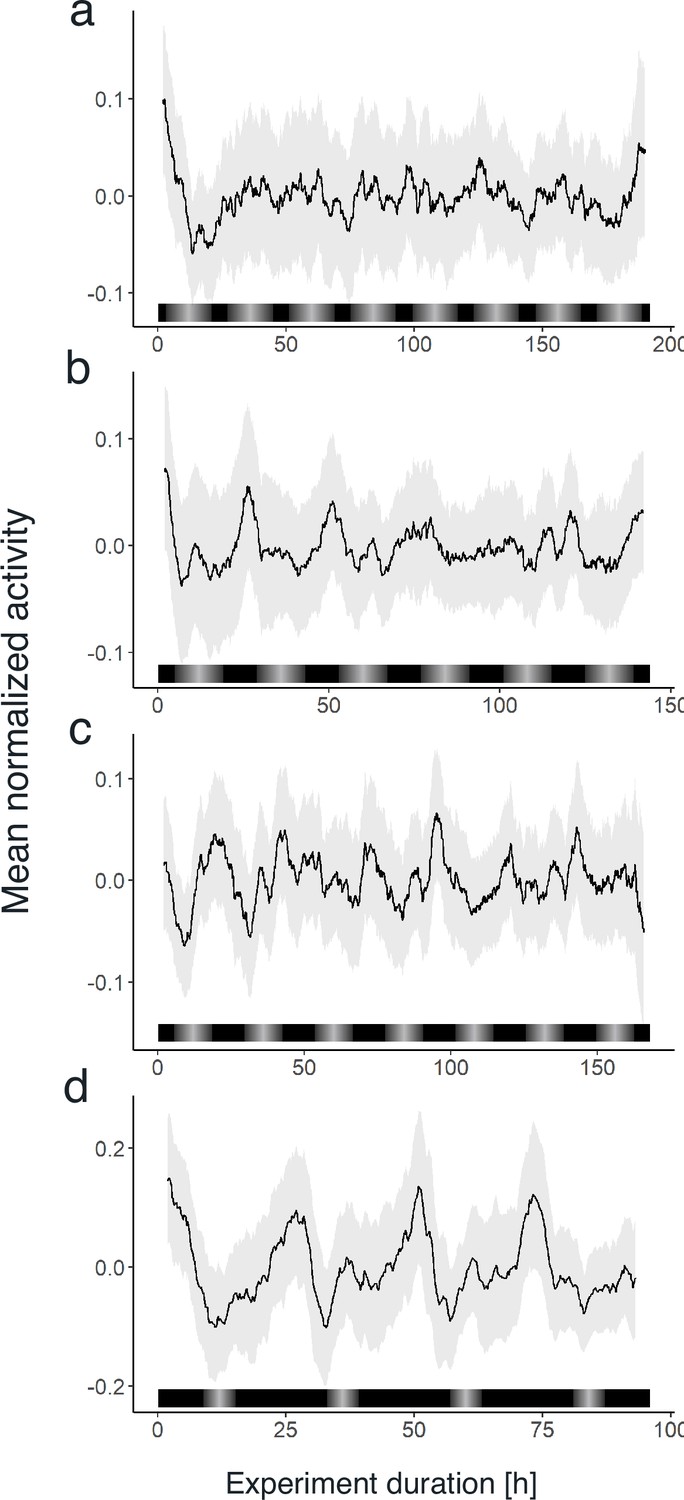
Circadian swimming activity persists across seasons.
Group mean swimming activity of rhythmic individuals during the first 4 days under DD conditions of experiment 2 for krill sampled for the summer (n = 5, a), late summer (n = 8, b), autumn (n = 10, c), and winter treatments (n = 4, d), as well as corresponding average day analysis of the first 4 days of experiment 2 in summer (e), late summer (f), autumn (g), and winter (h). Gray shading represents the s.e.m. Color bars at the top indicate the natural photoperiod at the day of sampling.
Figure 5—figure supplement 1
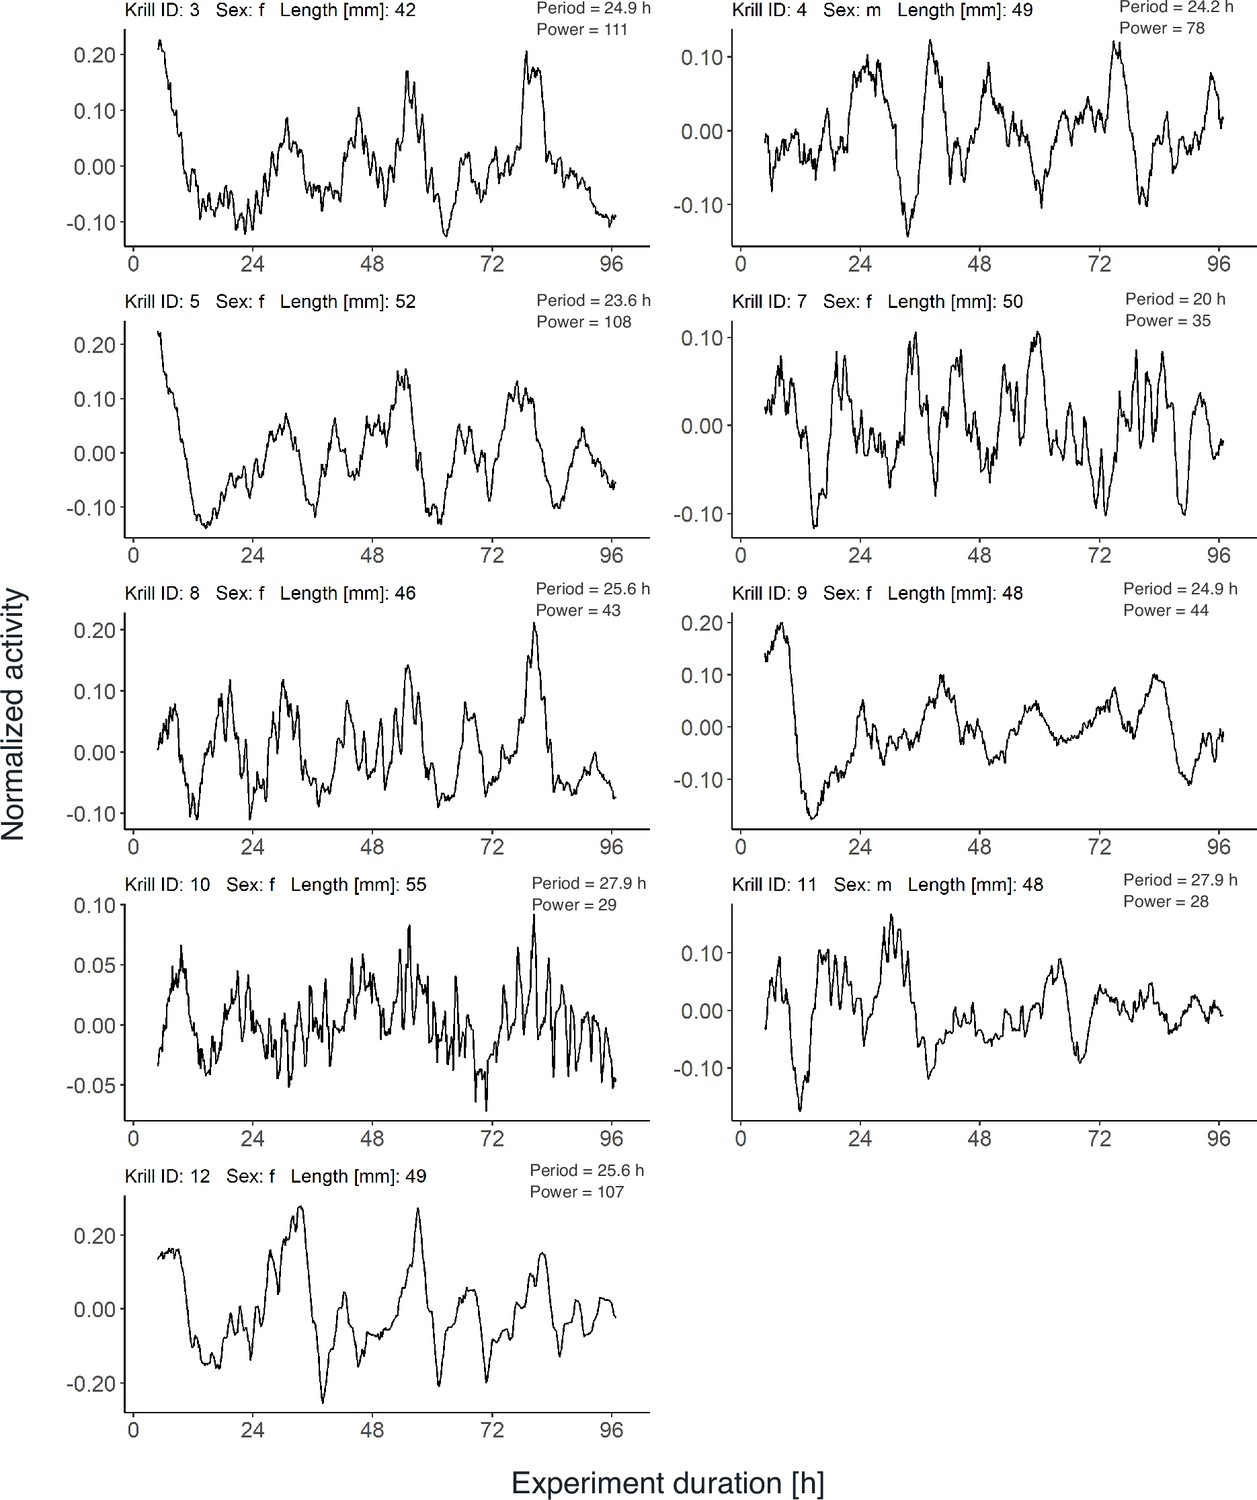
Individual swimming activity under DD conditions of krill sampled in summer.
Normalized and detrended swimming activity under 8 days of constant darkness (DD) after individuals have been sampled from their natural environment during the summer treatment of experiment 2 (photoperiod: 17.5 hr). Period and power estimates from Lomb-Scargle periodogram (LSP) analysis of the first 4 days under DD are detailed for each individual.
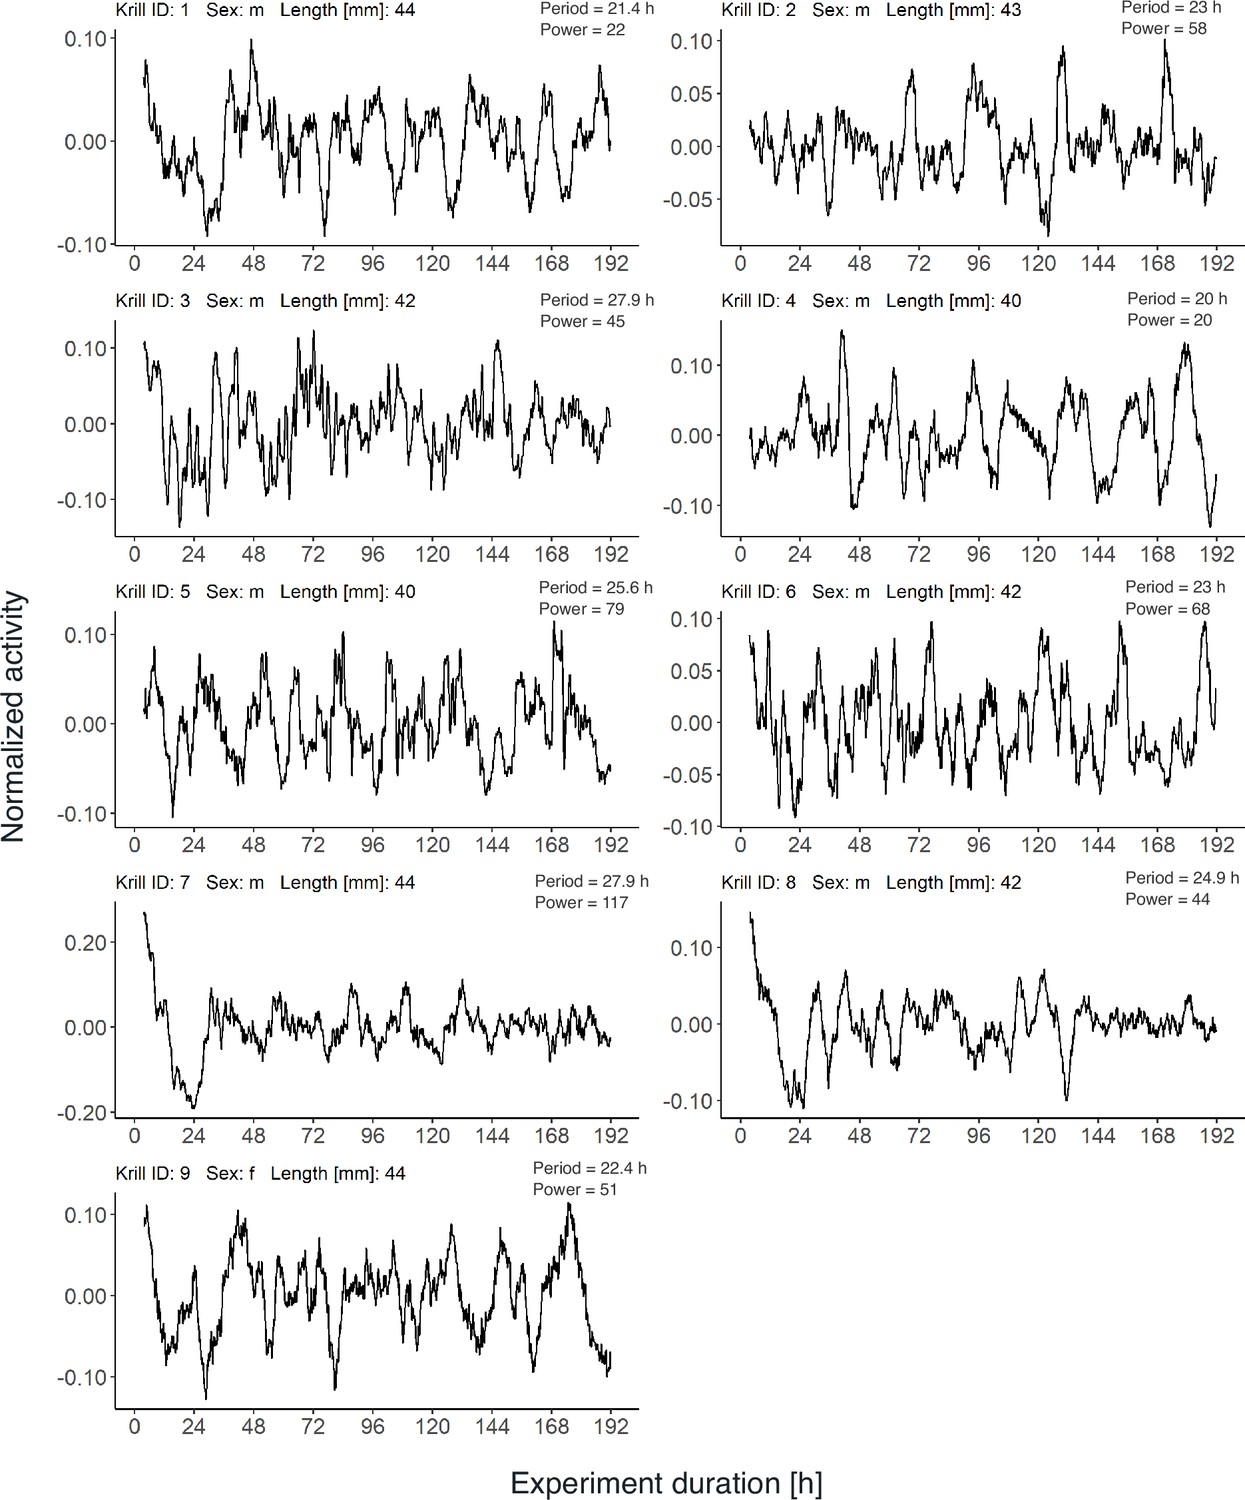
Figure 5—figure supplement 2
Individual swimming activity under DD conditions of krill sampled in late summer.
Normalized and detrended swimming activity under 6 days of constant darkness (DD) after individuals have been sampled from their natural environment during the late summer treatment of experiment 2 (photoperiod: 14 hr). Period and power estimates from Lomb-Scargle periodogram (LSP) analysis of the first 4 days under DD are detailed for each individual.
Figure 5—figure supplement 3
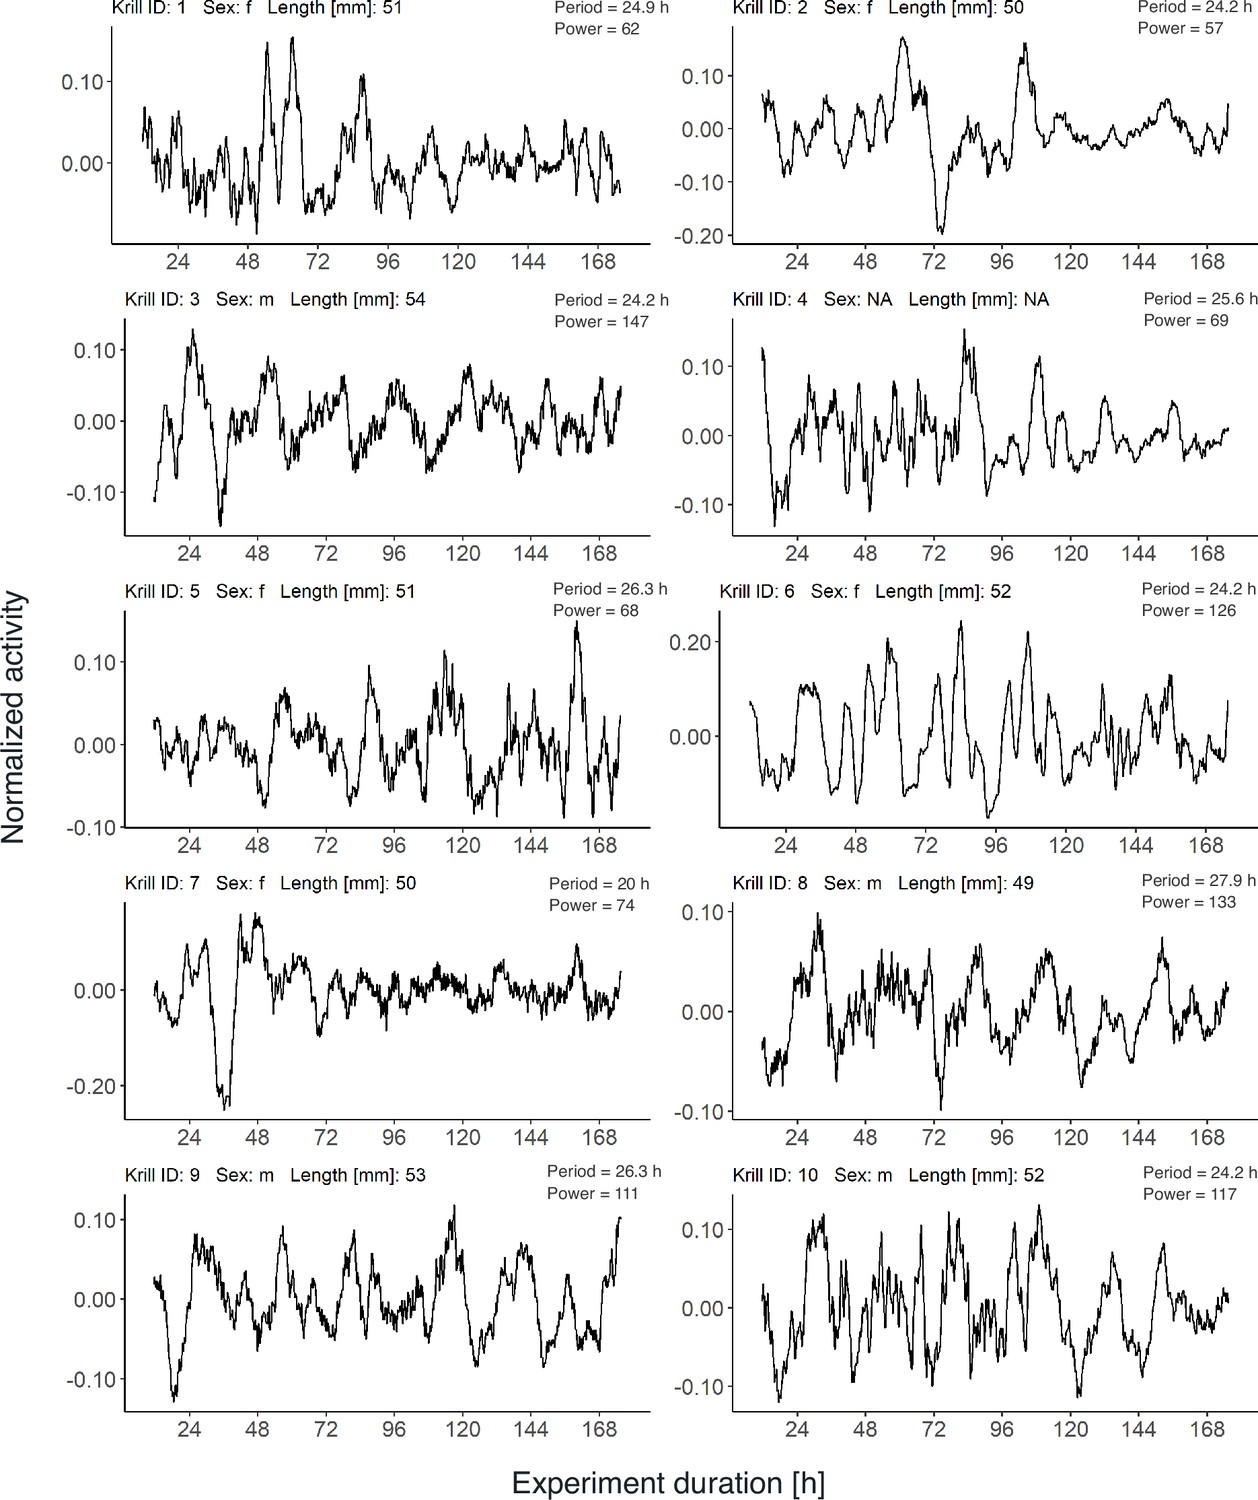
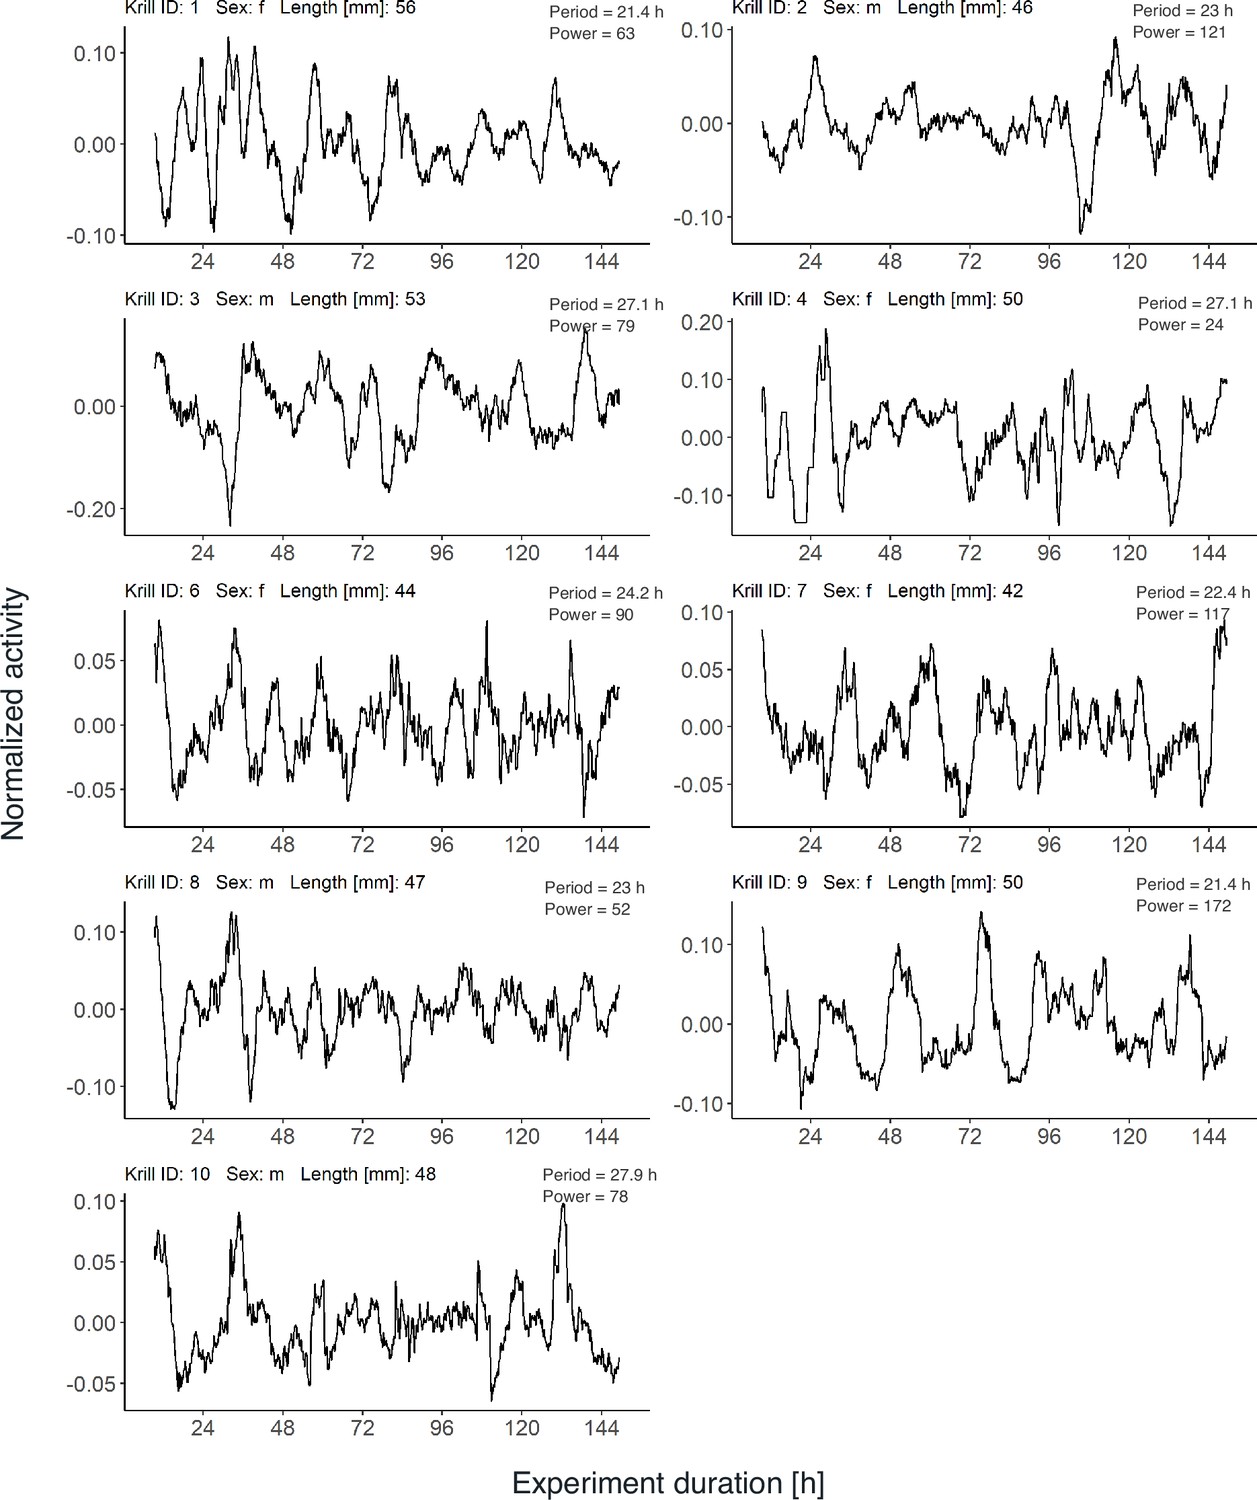
Individual swimming activity under DD conditions of krill sampled in autumn.
Normalized and detrended swimming activity under 7 days of constant darkness (DD) after individuals have been sampled from their natural environment during the autumn treatment of experiment 2 (photoperiod: 12.6 hr). Period and power estimates from Lomb-Scargle periodogram (LSP) analysis of the first 4 days under DD are detailed for each individual.
Figure 5—figure supplement 4
Individual swimming activity under DD conditions of krill sampled in winter.
Normalized and detrended swimming activity under 4 days of constant darkness (DD) after individuals have been sampled from their natural environment during the winter treatment of experiment 2 (photoperiod: 5.9 hr). Period and power estimates from Lomb-Scargle periodogram (LSP) analysis of the first 4 days under DD are detailed for each individual.
Figure 5—figure supplement 5
Group swimming activity under DD conditions across seasons.
Group mean swimming activity of rhythmic individuals under DD conditions after individuals have been sampled from their natural environment during summer (n = 5, a), late summer (n = 8, b), autumn (n = 10, c), and winter (n = 4, d) for experiment 2. Gray shading indicates the s.e.m.
Figure 5—figure supplement 6
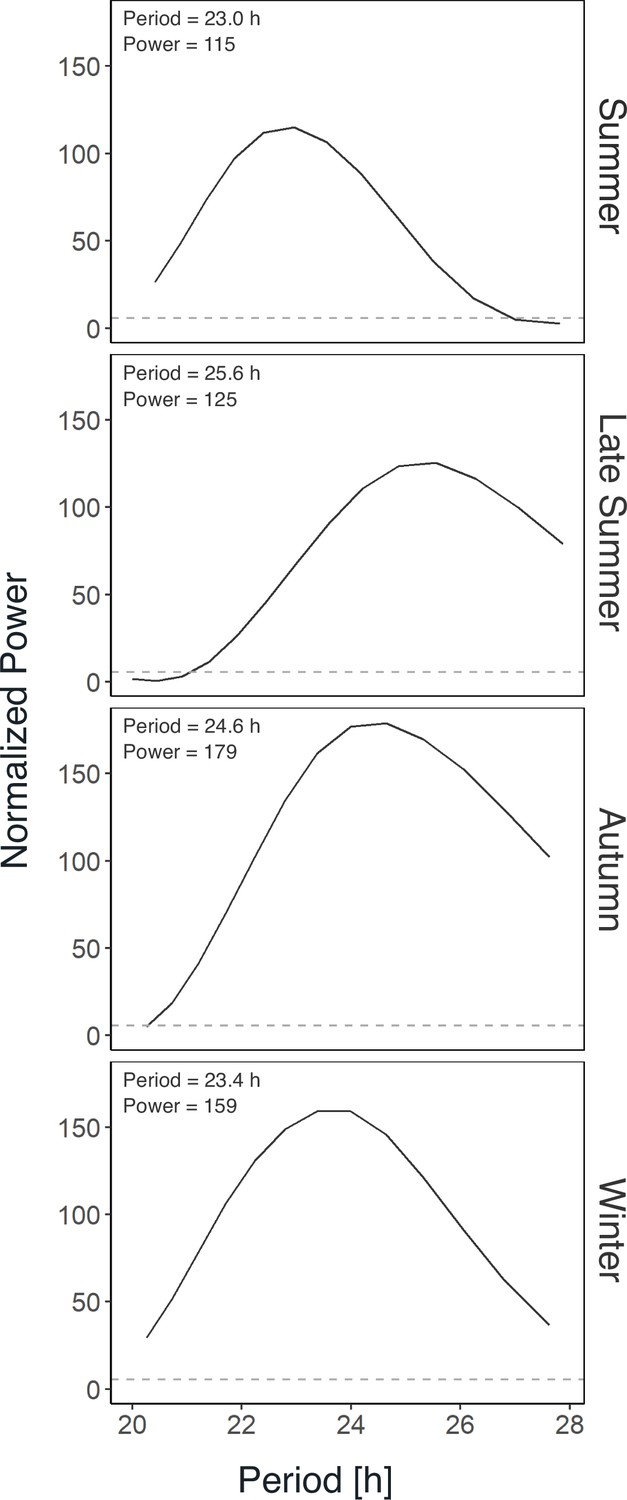
Rhythm analysis of group swimming activity under DD conditions across seasons.
Periodogram derived from Lomb-Scargle periodogram (LSP) analysis of group mean swimming activity under DD conditions after individuals have been sampled from their natural environment in different seasons for experiment 2 (see Figure 5—figure supplement 5).
Figure 6
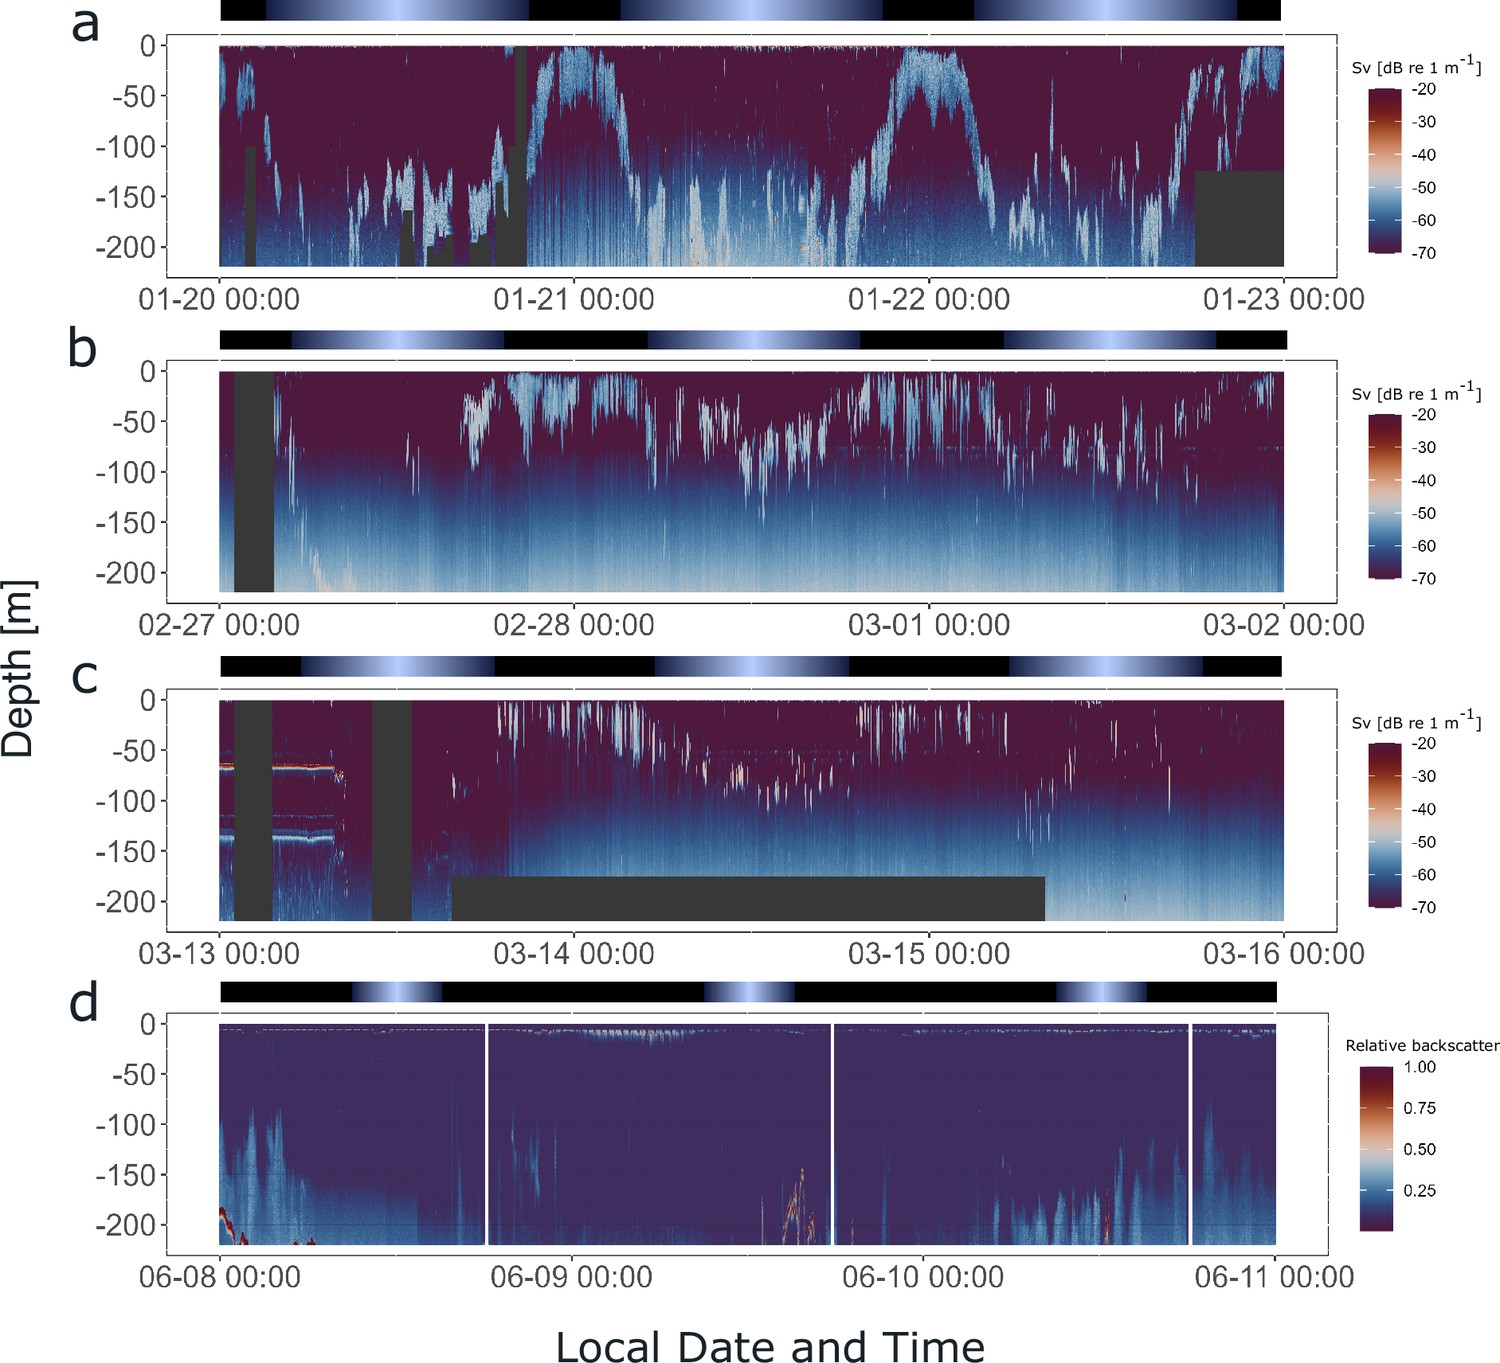
Krill display synchronized diel vertical migration (DVM) in the field across a wide range of photoperiods.
Hydroacoustic recordings showing the vertical distribution of krill swarms in the upper water column (<220 m) below the vessel, visualized by the mean volume backscattering signal (200 kHz), on the 3 days prior to krill sampling for experiment 2, in summer (a), late summer (b), autumn (c), and winter (d). Diffuse blue shading between ~100 and 220 m represents instrument noise. Gray areas depict missing data. Color bars at the top indicate the natural light regime.
Tables
Table 1
Metadata for behavioral experiments.
For each experiment (Experiment ID), the metadata show the light regime during the experiment in the activity monitor (LD: light-dark cycle, DD: constant darkness), the duration of the experiments under the respective light condition, the local date and time, region (BS: Bransfield Strait, SOI: South Orkney Islands), exact location, and depth for krill sampling, the local natural photoperiod at the time of krill sampling, the number of krill used for each experiment, and their mean length and standard deviation.
| Experiment ID | Experimental light regime | Experiment duration (days) | Sampling date (UTC-2) | Sampling time (UTC-2) | Sampling region | Sampling location (latitude °S/longitude °W) | Sampling depth (m) | Natural photoperiod (hr) | n Krill (total/male/ female) | Mean ±SD length (mm) |
|---|---|---|---|---|---|---|---|---|---|---|
| Experiment 1 (short-day treatment) | LD-DD | 3 (LD), 5 (DD) | 2021-05-31 | 13:02 | BS | 62.95/57.77 | 170 | 5.5 | 11/5/6 | 45±2.6 |
| Experiment 1 (long-day treatment) | LD-DD | 5 (LD), 5 (DD) | 2022-02-16 | 15:50 | SOI | 60.04/46.45 | 94 | 15.3 | 9/4/5 | 44.4±3.7 |
| Experiment 2 (summer treatment) | DD | 8 | 2022-01-22 | 17:03 | SOI | 60.08/46.46 | 157 | 17.5 | 9/8/1 | 42.4±1.5 |
| Experiment 2 (late summer treatment) | DD | 6 | 2022-03-01 | 11:00 | SOI | 60.0/44.73 | 86.5 | 14.0 | 9/4/5 | 48.9±4.4 |
| Experiment 2 (autumn treatment) | DD | 7 | 2022-03-15 | 08:40 | SOI | 60.28/46.43 | 119.2 | 12.6 | 10*/4/5 | 51.3±1.6* |
| Experiment 2 (winter treatment) | DD | 4 | 2021-06-10 | 12:56 | SOI | 60.5/46.11 | 185 | 5.9 | 9/2/7 | 49.2±3.9 |
-
*
Length and sex of one individual undetermined.
Additional files
Download links
A two-part list of links to download the article, or parts of the article, in various formats.
Downloads (link to download the article as PDF)
Open citations (links to open the citations from this article in various online reference manager services)
Cite this article (links to download the citations from this article in formats compatible with various reference manager tools)
A circadian clock drives behavioral activity in Antarctic krill (Euphausia superba) and provides a potential mechanism for seasonal timing
eLife 14:RP103096.
https://doi.org/10.7554/eLife.103096.3


