Research: Bias in the reporting of sex and age in biomedical research on mouse models
- The University of Manchester, United Kingdom
- University of Manchester, United Kingdom
Figures
Figure 1 with 1 supplement
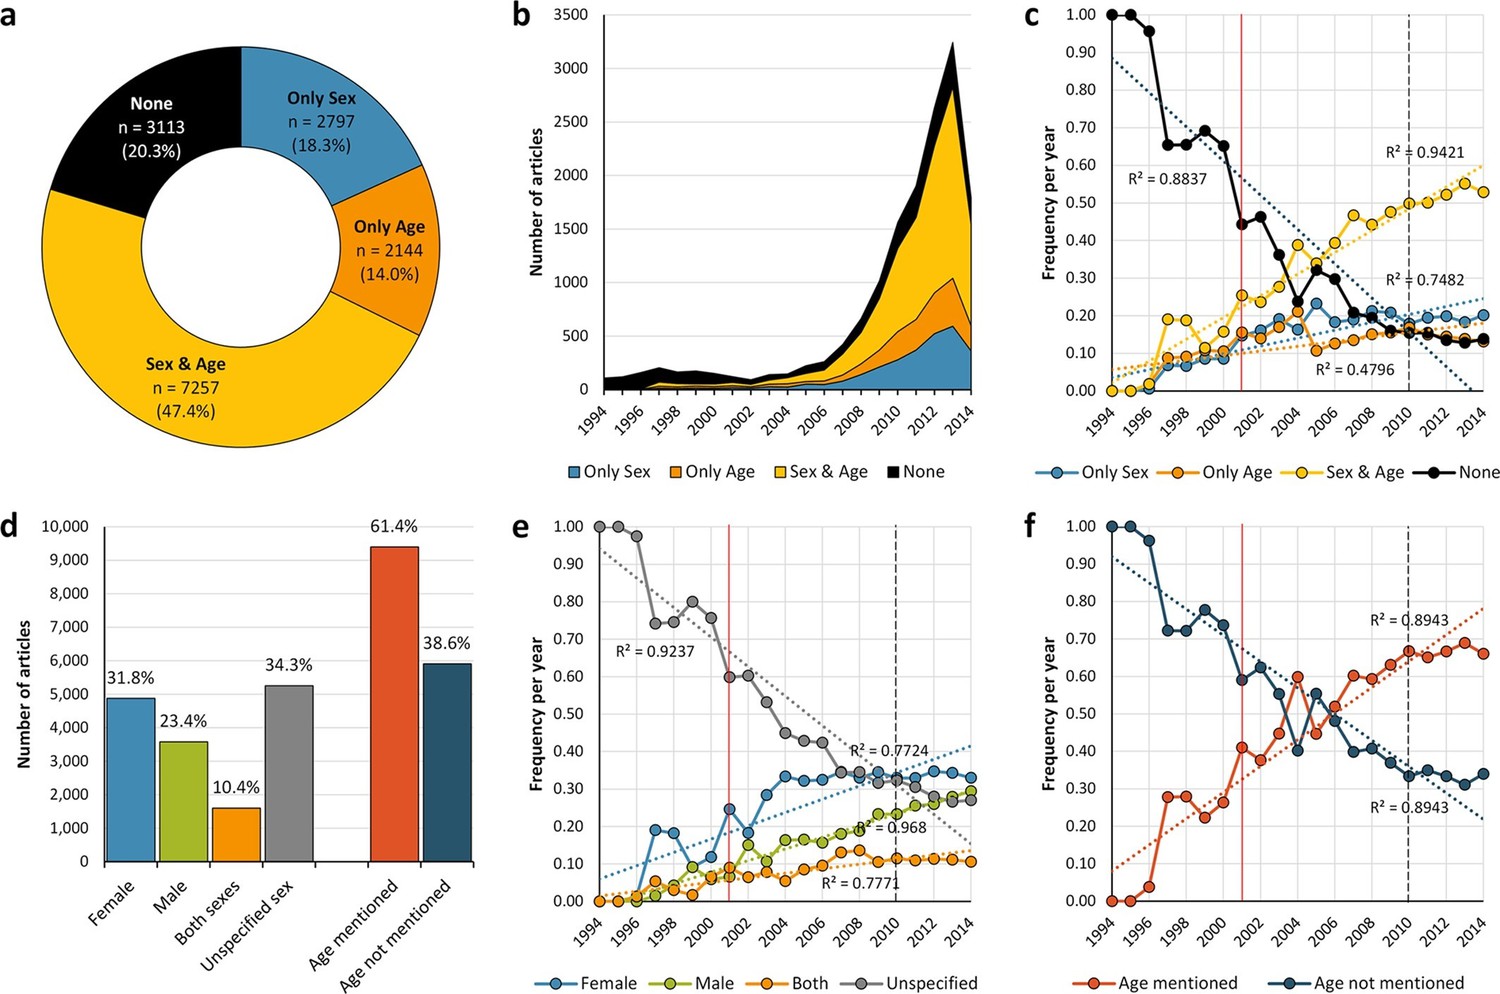
General distribution and historical change of reporting and non-reporting of sex and/or age in mouse-model experiments.
Pie-chart (a) showing an overview of the reporting and non-reporting (none) of sex only, age, or both sex and age in a set of 15,311 studies published between 1994 and 2014 by stating the number and percentage of articles in each portion. The chronological change of the reporting and non-reporting is displayed both in a stacked area plot (b) and a scatter plot after normalization [per articles/year] (c). The chronological changes show that most of the articles assessed were published during the last decade (b), and that the improvement of reporting of these two biological factors started before, and not after, the US Institute of Medicine report in 2001 (Wizemann and Pardue, 2001) [indicated with a vertical red line] or the introduction of ARRIVE guideline (Kilkenny et al., 2010) [indicated with a vertical black dashed line] (c). Bar-chart (d) showing the number and percentage of articles reporting/not reporting of sex by sex [females only, males only, or both sexes either by mixing or separating them] or age. The chronological change of the reporting and non-reporting of sex by sex (e), and age (f), is displayed in scatter plots after normalization [per articles/year].
-
Figure 1—source data 1
PubMed search terms used for each disease group and their approaches.
- https://doi.org/10.7554/eLife.13615.004
-
Figure 1—source data 2
Example rules for identification of sex and age.
- https://doi.org/10.7554/eLife.13615.005
Figure 1—figure supplement 1
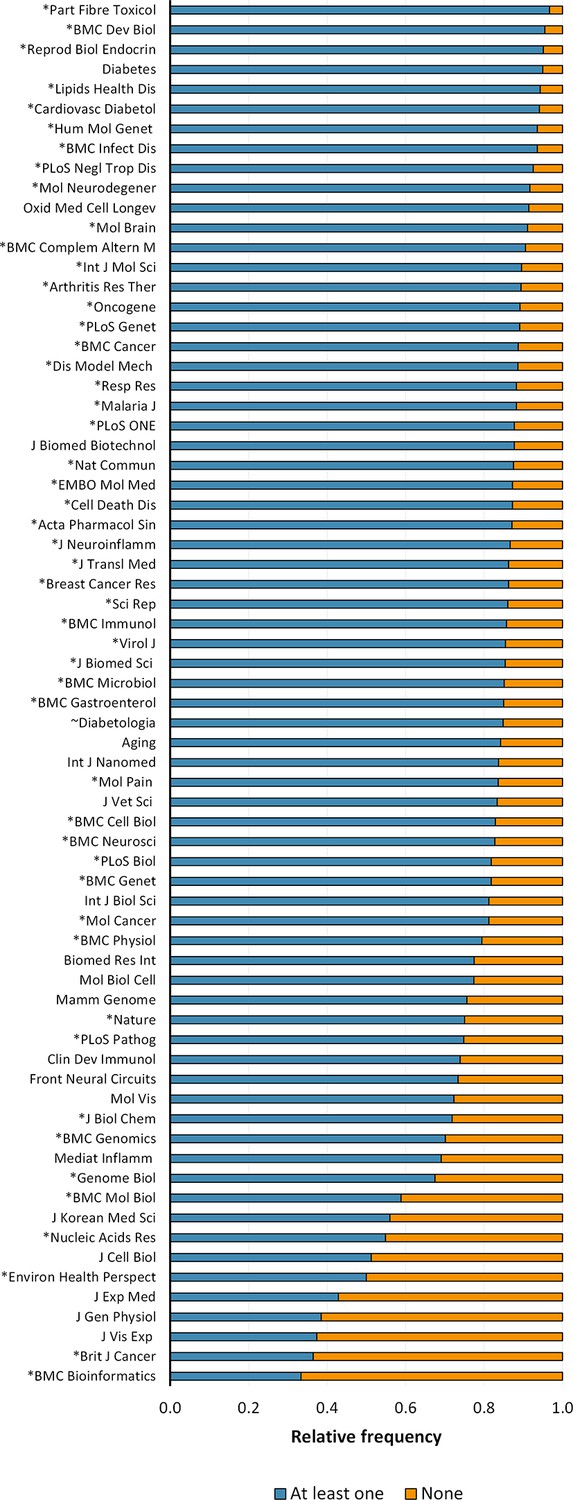
Reporting of sex or age in mouse-model experiments by journal.
The figure shows the top 70 journals from a total of 628 journals in which were published 30 or more articles of the corpus; corresponding to 81.05% of papers assessed. The journals are organised in descending order of the reporting of sex or age (i.e. at least one) as experimental variables. *Journals that endorsed ARRIVE and ~Journals that stated the reporting of sex and age in the author guidelines.
Figure 2
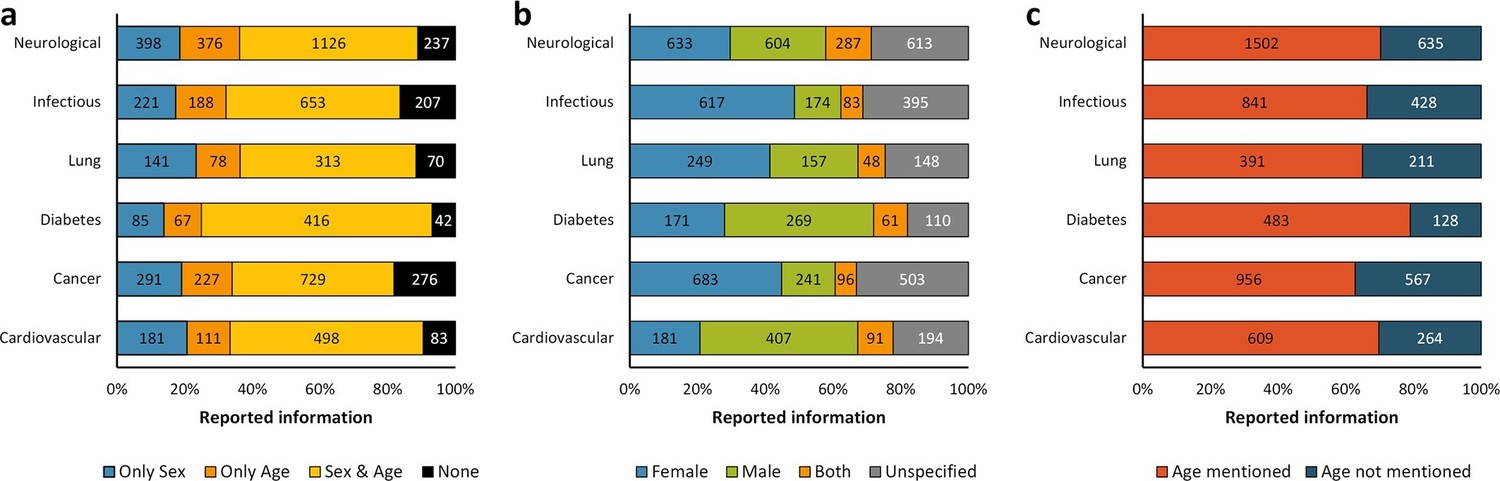
Distribution of reporting of the sex and age in mouse model of a group of diseases.
The reporting of these variables was assessed for six groups of diseases from the top 10 causes of death according to the W.H.O. This analysis was performed in the set of 14,225 articles published from 2001, when the US Institute of Medicine report was published (Wizemann and Pardue, 2001) and when the non-reporting of sex and age together dropped about 50% –avoiding misinterpretations [Figure 1c], to 2014. The distribution is presented in stacked bar charts that illustrate the percentage of the reporting and non-reporting for both biological variables overall (a) and discriminated by variable: sex (b) and age (c); stating the number of articles corresponding to each percentage inside the stacks. A two-way ANOVA without replication was performed to assess the difference in reporting of the sex [p = 0.005] and age [p = 0.028] for each disease, indicating that the reporting and non-reporting of these biological factors varies across these diseases.
Figure 3
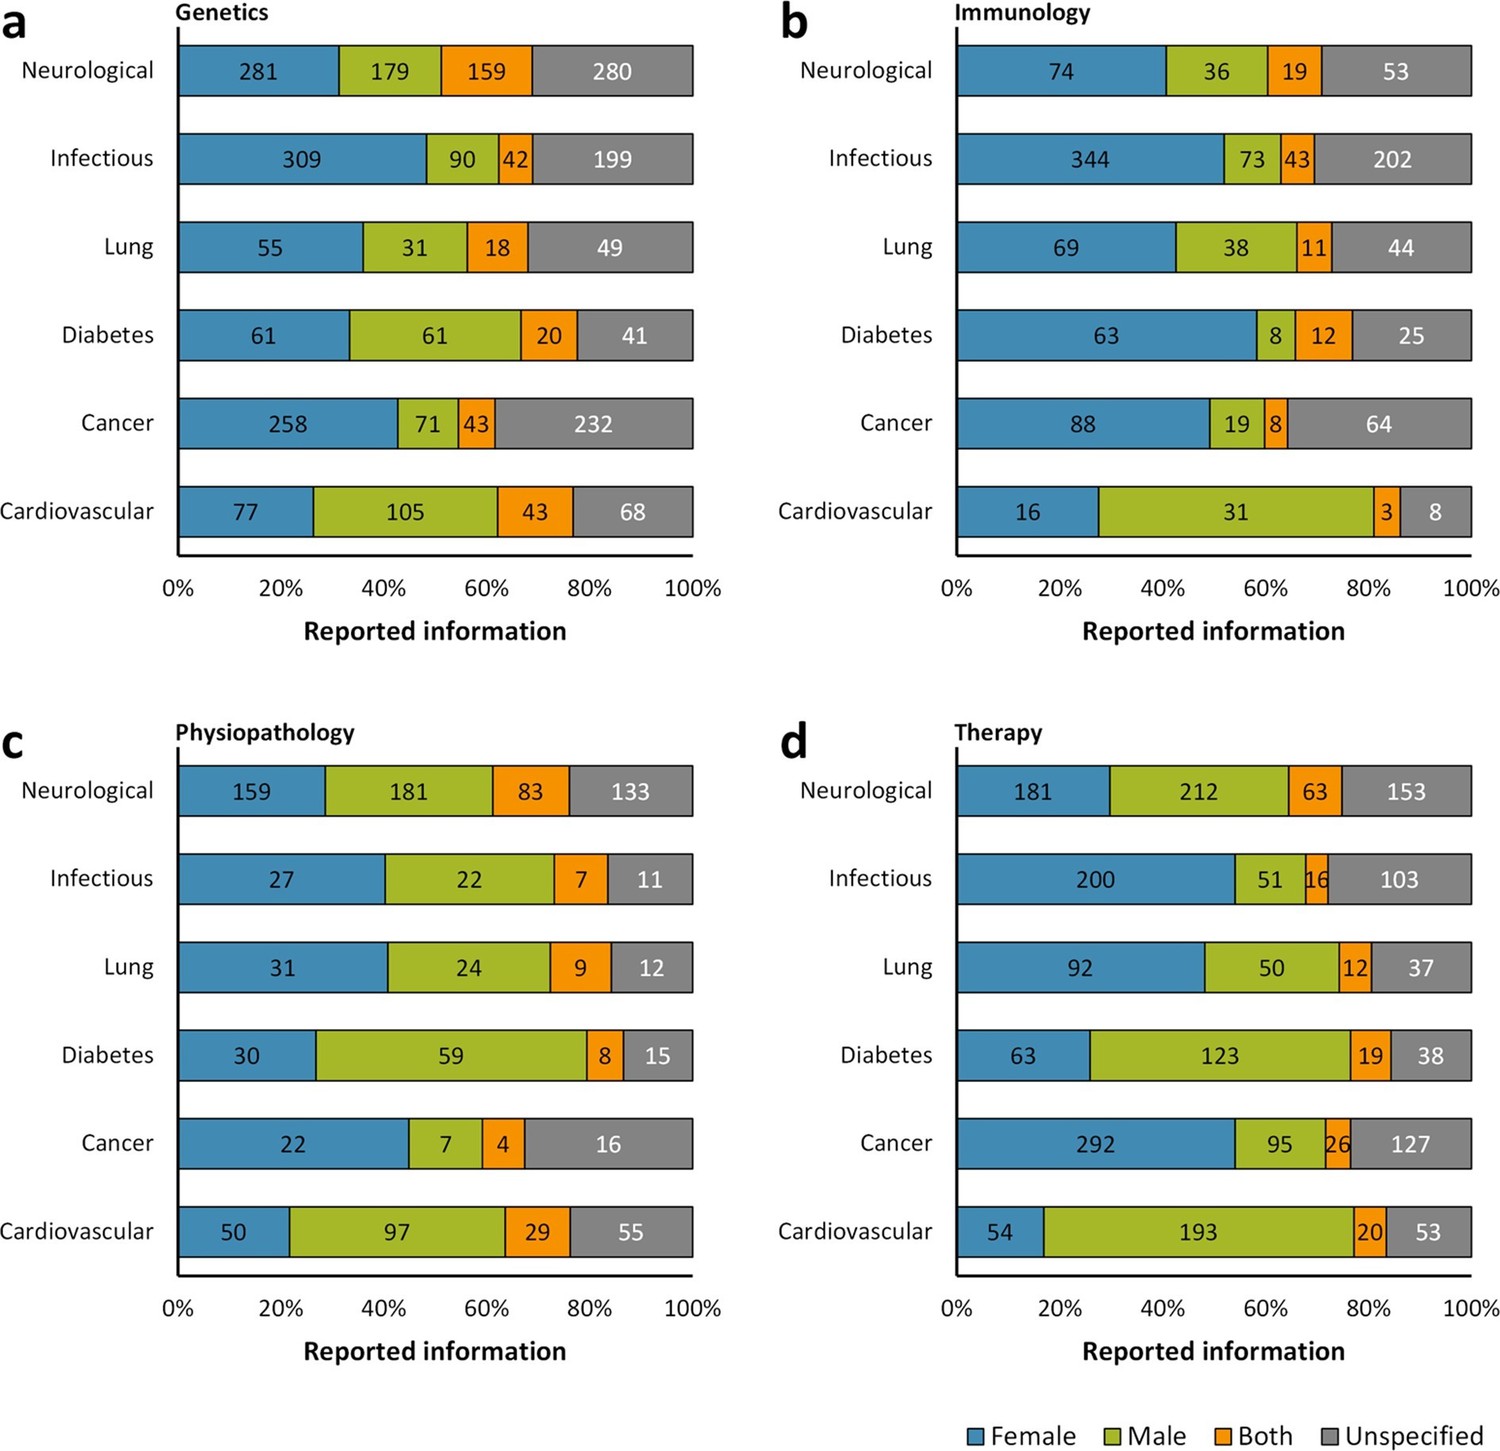
Distribution of reporting of the sex in mouse model of a group of diseases by research approach.
The reporting of sex was assessed for each disease by the topic of research whether genetics (a), immunology (b), physiopathology (c), or therapy (d). This analysis was performed in the set of 14,225 articles published from 2001, when the US Institute of Medicine report was published (Wizemann and Pardue, 2001) [Figure 1c], to 2014. The distribution is presented in stacked bar charts that illustrate the percentage of the reporting and non-reporting for the sex; stating the number of articles corresponding to each percentage inside the stacks. A two-way ANOVA without replication was performed to assess the difference in reporting of the sex for genetics [p = 0.0009], immunology [p = 0.0074], physiopathology [p < 0.0001], and therapy [p = 0.1165], indicating that the reporting and non-reporting of these biological factors varies across most of these biomedical approaches.
Figure 4
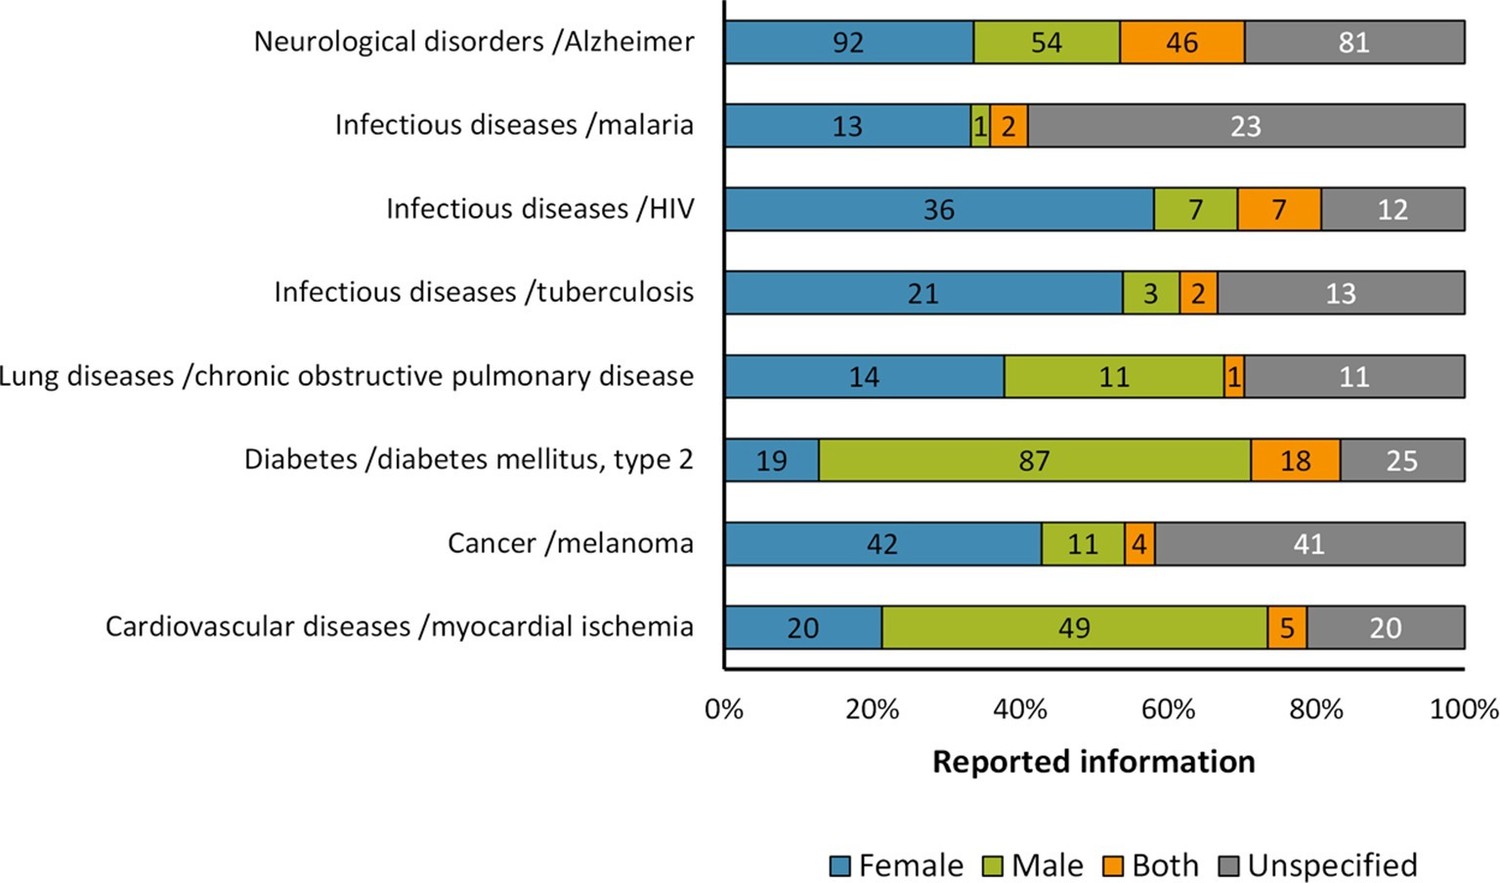
Distribution of reporting of the sex in mouse model of diseases.
The graph shows the reporting in particular diseases. All these diseases that are among the most frequently reported causes of death world-wide or commonly used models. The distribution is presented in stacked bar charts that illustrate the percentage of the reporting and non-reporting for the sex; stating the number of articles corresponding to each percentage inside the stacks. This analysis was performed in a set of 791 articles; see Figure 1—source data 1.
Figure 5
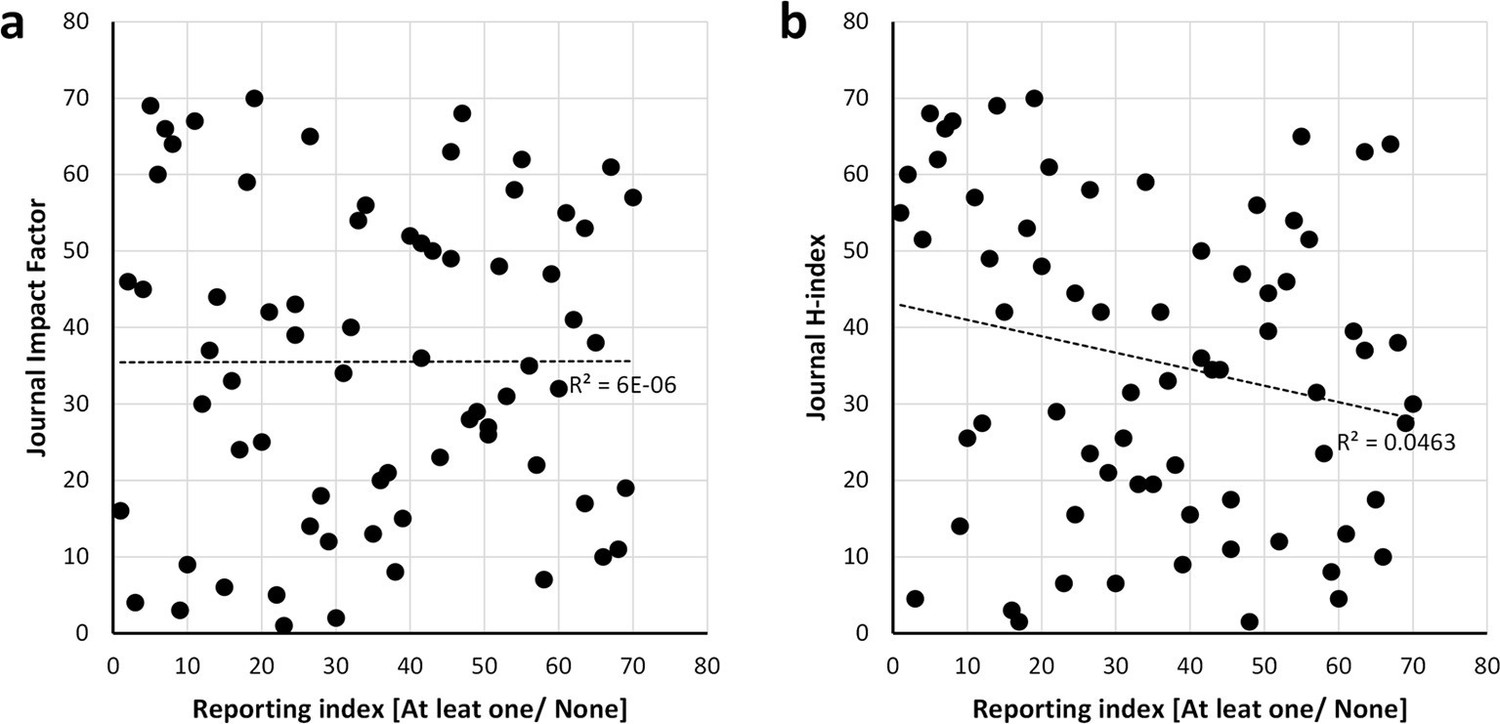
Scatter plots showing the relationship between the reporting and the bibliometric indices.
Journal impact factor in which the papers were published (a) and h-index of journals (b). Spearman’s rank correlation coefficient r square is shown alongside the regression lines. The scatter plots show that there is no correlation between the reporting and impact factor [r =0.002, p = 0.984] data from the Journal Citation Report (year 2014) and journal h-index [r =-0.215, p = 0.073] data from the SCImago Journal and Country Rank (year 2014). Analysis conducted on the 70 journals that published 30 or more articles of the 15,311 studies returned by searching the PubMed Central Open Access subset as of February 2015.
Tables
Table 1
Evaluation of the performance of the text mining system.
| Characteristics | True- positives | True- negatives | False- positives | False- negatives | Precision (%) | Recall (%) | F-score (%) |
|---|---|---|---|---|---|---|---|
| Sex | 29 | 16 | 3 | 2 | 90.6 | 93.5 | 92.0 |
| Age | 31 | 14 | 1 | 4 | 96.8 | 88.5 | 92.4 |
-
A total of 50 articles were used as the data set to evaluate the performance of the text mining system (Supplementary file 2D). The precision (P), calculated as TP/(TP+FP), determines the accuracy of the system in recognizing desirable terms. The recall (R), calculated as TP/(TP+FN), produces the coverage of the system. F-score is the harmonic mean of precision and recall and it is calculated as 2*P*R/(P+R).
Table 2
Summary of the data sets used in this study.
| Sets of articles | Number of articles | Task | File |
|---|---|---|---|
| Data 1 | 15,311 | Corpus for assessing reporting of the sex and age of the mice | Supplementary file 1* |
| Data 2 | 40 | Creating the text-mining rules | Supplementary file 2A |
| Data 3 | 40 | Manual inspection for finding the location of the mention of the sex and age of the mice | Supplementary file 2B |
| Data 4 | 70 | Enhancing the performance of the text-mining rules | Supplementary file 2C |
| Data 5 | 50 | Evaluating the text-mining system | Supplementary file 2D |
-
*Supplementary file 1 also contains data sets of the six groups of diseases analyzed (cardiovascular diseases; cancer; diabetes mellitus; lung diseases; infectious diseases; and neurological disorders), as well as of the different approaches to assess the disease models (i.e. genetics, immunology, physiopathology and therapy), and the disease example for each of the six disease groups.
Additional files
-
Supplementary file 1
Corpus for assessing reporting of the sex and age of the mice.
- https://doi.org/10.7554/eLife.13615.012
-
Supplementary file 2
(A) Set of articles for creating the text-mining rules.
(B) Set of articles for finding the location of the mention of the sex and age of the mice. (C) Set of articles for enhancing the performance of the text-mining rules. (D) Set of articles for evaluating the text-mining system.
- https://doi.org/10.7554/eLife.13615.013
-
Supplementary file 3
Rules used to identify the sex and age of experimental mouse models.
- https://doi.org/10.7554/eLife.13615.014
Download links
A two-part list of links to download the article, or parts of the article, in various formats.
Downloads (link to download the article as PDF)
Open citations (links to open the citations from this article in various online reference manager services)
Cite this article (links to download the citations from this article in formats compatible with various reference manager tools)
Research: Bias in the reporting of sex and age in biomedical research on mouse models
eLife 5:e13615.
https://doi.org/10.7554/eLife.13615


