Travel fosters tool use in wild chimpanzees
- University of Neuchâtel, Switzerland
- Budongo Conservation Field Station, Uganda
- University of Geneva, Switzerland
- University of St Andrews, United Kingdom
Figures
Figure 1
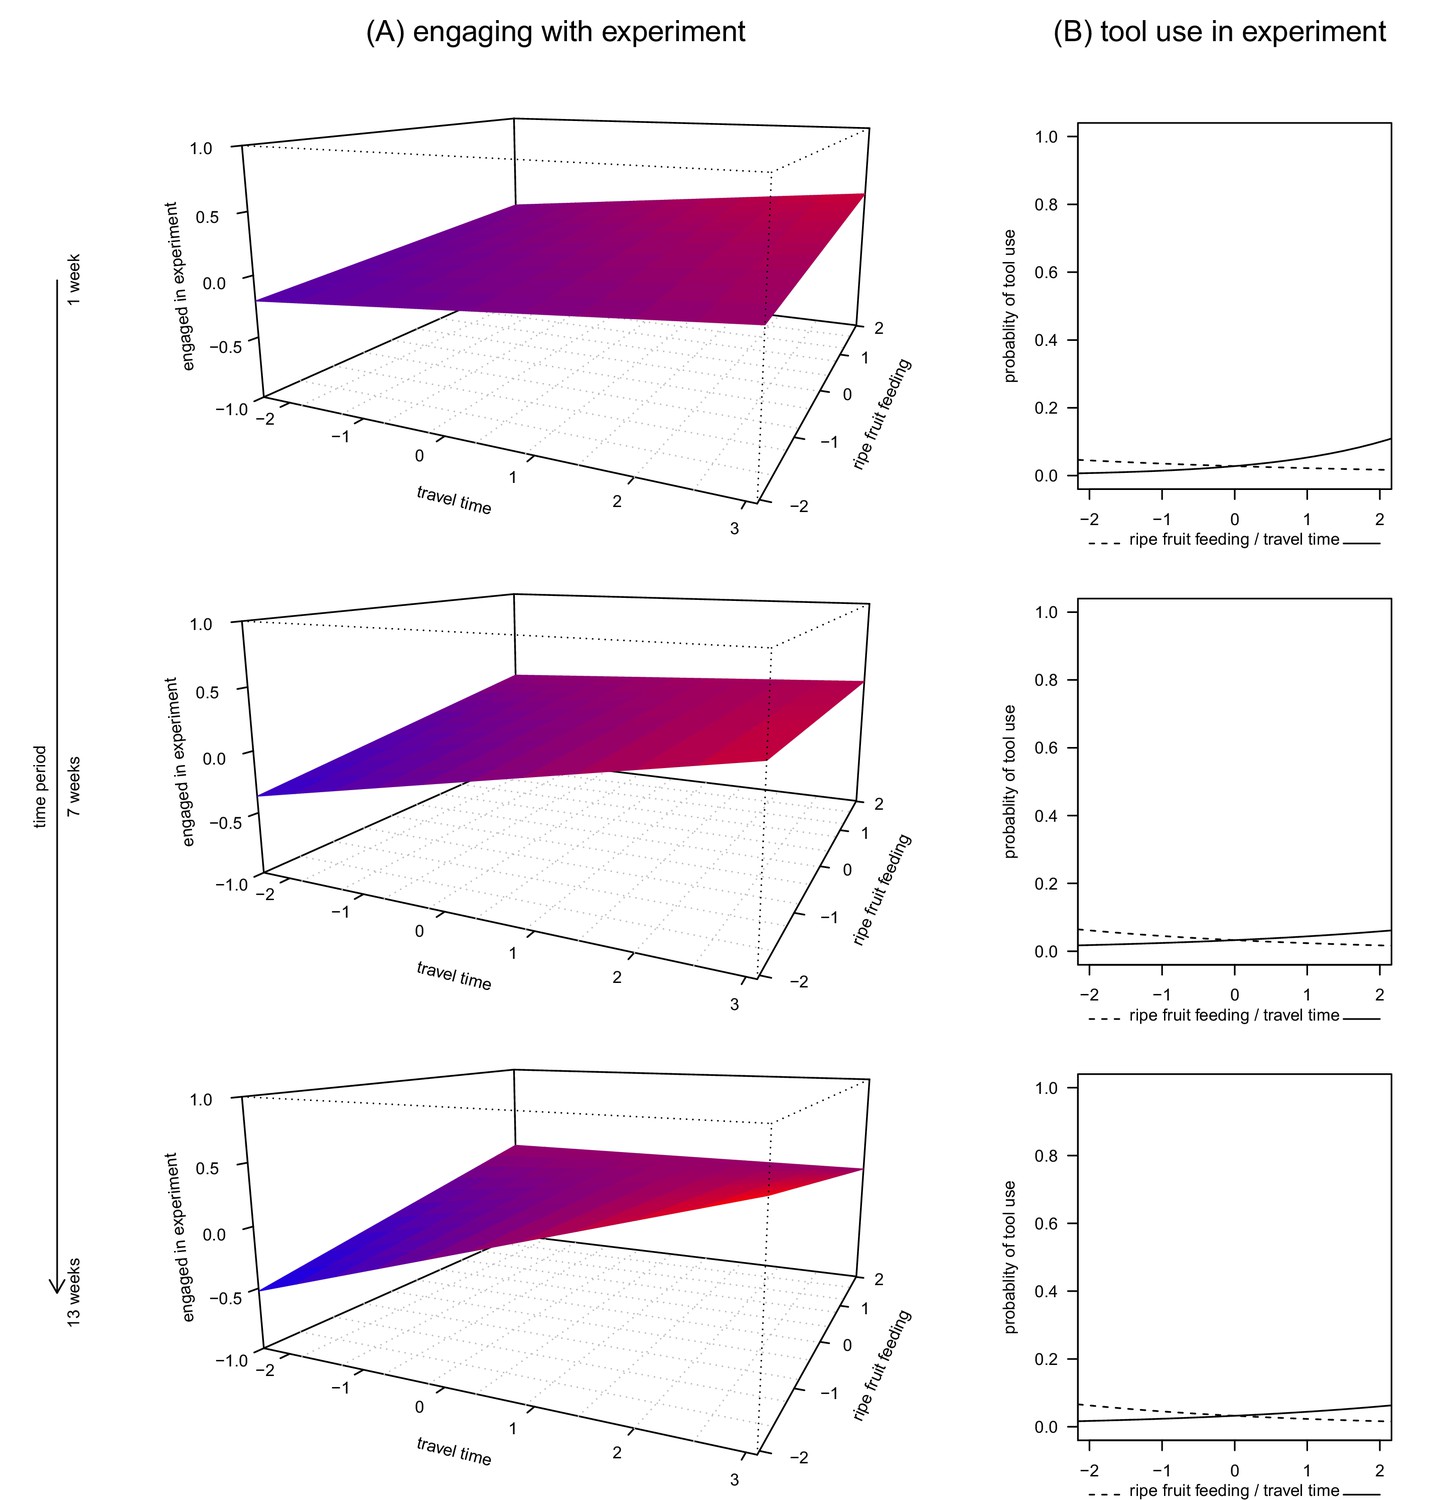
The relationship between ripe fruit feeding, travel time, time period and engagement in the honey experiment (A, Figure 1—source data 1) and ripe fruit feeding, travel time and tool use during the experiment (B, Figure 1—source data 2, 3 and 4).
Each panel shows the relationship between ripe fruit feeding, travel time and engagement, respectively use of tools, for time periods of 1, 7 and 13 weeks. All variables were standardized to a mean = 0 and SD = 1. For better readability, colour gradients along the model planes reflect predicted values along the vertical axis (engaged in experiment): larger values appear in red and smaller values in blue.
-
Figure 1—source data 1
Engagement data.
- https://doi.org/10.7554/eLife.16371.005
-
Figure 1—source data 2
Tool data 1 week.
- https://doi.org/10.7554/eLife.16371.006
-
Figure 1—source data 3
Tool data 7 weeks.
- https://doi.org/10.7554/eLife.16371.007
-
Figure 1—source data 4
Tool data 13 weeks.
- https://doi.org/10.7554/eLife.16371.008
Figure 2

Relationship between percentage of fruit in the diet (A), percentage of travel in the activity budget (B), daily travel path (km, C), and the number of feeding-related tools described in currently documented long-term habituated chimpanzee communities.
See Table 4 for details.
Figure 3

Range of engagement time of Sonso chimpanzees with the honey-trap experiment depending on the social context (alone, family-unit, or social).
https://doi.org/10.7554/eLife.16371.013
Figure 4

Temporal variation in climate in the Budongo Forest (A) and in feeding behaviour of the Sonso community (B, C) during the period covering the experimental trials.
Months during which experiments were conducted are highlighted in red. (A) To define the climate factor, we calculated monthly cumulative rainfall and mean temperatures, extracted from daily values for rainfall, minimum temperature and maximum temperature in Budongo Forest available from 2001 through 2015 (Budongo Conservation Field Station long-term data 2001–2015). These monthly values were subjected to a principal component analysis (function ‘princomp’ in the stats package R v. 3.1.1, R CoreTeam (2014)). The climate factor corresponds to the scores of the first component of this analysis, which explained 64% of variance. Larger values along this axis correspond to larger values of rainfall, higher minimum temperature and lower maximum temperature as compared to smaller values along the climate factor. For reference, monthly cumulative rainfall is also plotted in this panel (dashed line). Both variables were standardized to mean = 0 and SD = 1. As such, values of 0 indicate average climate/rainfall (horizontal grey line). Out of 19 months with experimental days, 10 were characterised by above-average climate/rainfall and 9 by below-average climate/rainfall. (B) Variation in ripe fruit feeding behaviour. Shown are monthly median values of the proportion of ripe fruit in the diet for individuals that were observed at least five times feeding during a given month. Grey bars indicate quartiles and the horizontal dashed line represents the mean value across all individual-months. (C) Variation in fig feeding. Shown are monthly median values of the proportion of figs in the diet for individuals that were observed at least five times feeding on ripe fruit during a given month. Grey bars indicate quartiles and the horizontal dashed line represents the mean value across all individual-months.
Figure 5
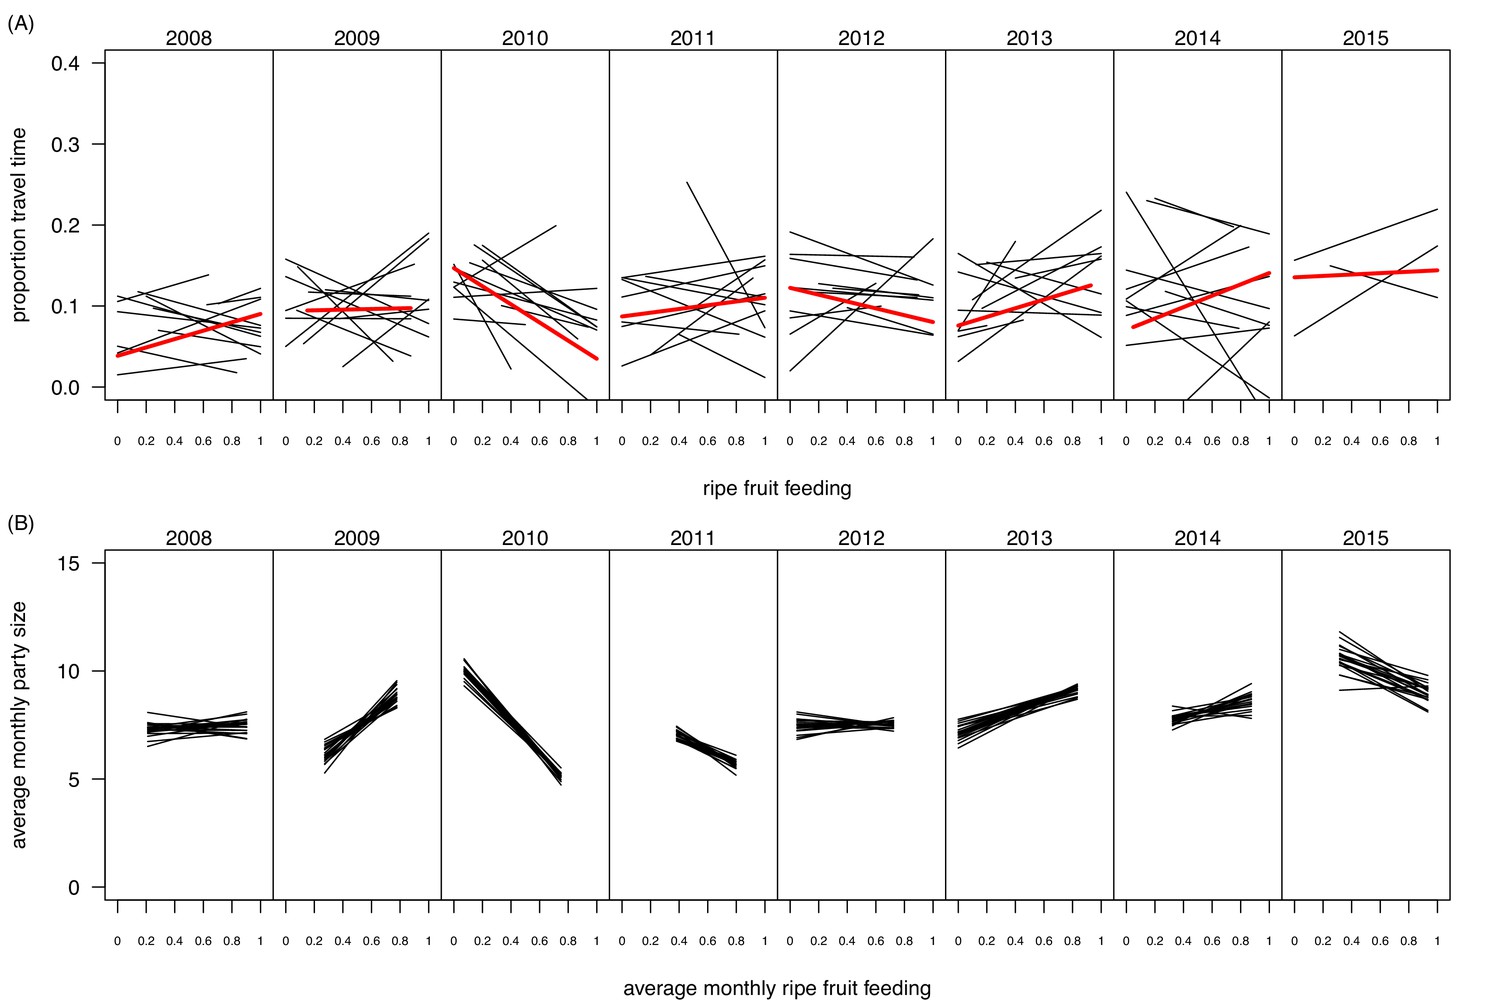
Within- and between-year variation in the relationships between ripe fruit feeding and (A) travel time and (B) mean monthly party size.
In (A), each black line represents the regression line of travel time on ripe fruit feeding within a month, based on data from focal individuals. Thus, per panel 12 lines are depicted, except for 2015 for which data were available only for the first three months. The red line depicts the average regression over the respective year. In (B), each line represents a regression line of monthly average party size on average monthly ripe fruit feeding proportion. Each line is based on data from a random selection of parties (limited to one party per day) to calculate the monthly average party size. The randomization was repeated 20 times, resulting in 20 regression lines per panel. The panel for 2015 is based on regressions with only three data points as data were only available for the first three months of 2015.
Tables
Table 1
Results of LMM for the engagement of the Sonso chimpanzees with the honey-trap experiment. p-values for intercept and terms comprised in the three-way interaction are omitted. Reference levels for categorical predictors are female (sex), and no (tool use). p-values resulted from likelihood ratio tests.
| β | ± se | t | p | 95% CI | |
|---|---|---|---|---|---|
| Intercept | 0.04 | 0.27 | 0.14 | ||
| Ripe fruit feeding | 0.04 | 0.05 | 0.80 | ||
| Time period | −0.00 | 0.01 | −0.11 | ||
| Travel time | 0.08 | 0.05 | 1.73 | ||
| Sex (male) | −0.31 | 0.40 | −0.78 | 0.4517 | −1.100, 0.473 |
| Age | 1.21 | 0.09 | 13.18 | 0.0000 | 1.028, 1.387 |
| Tool use (yes) | 1.25 | 0.12 | 10.66 | 0.0000 | 1.021, 1.481 |
| Auto correlation | −0.30 | 0.01 | −36.13 | 0.0000 | −0.313, −0.281 |
| Ripe fruit : Time period | −0.00 | 0.01 | −0.54 | ||
| Ripe fruit : Travel time | −0.02 | 0.02 | −1.32 | ||
| Time period : Travel time | 0.01 | 0.01 | 1.44 | ||
| Ripe fruit : Time period : Travel time | −0.02 | 0.01 | −2.40 | 0.0163 | −0.030, −0.003 |
Table 2
Likelihood ratio tests for full model and the interaction between ripe fruit feeding and proportion of travel time for the tool use models. Null models contained the random effects structure and the auto-correlation term.
| Full vs. null model (df = 5) | Interaction Ripe fruit : Travel time (df = 1) | |||
|---|---|---|---|---|
| Time period | X2 | p | X2 | p |
| 1 week | 11.99 | 0.0349 | 0.25 | 0.6169 |
| 7 weeks | 7.58 | 0.1810 | 0.02 | 0.8931 |
| 13 weeks | 8.52 | 0.1299 | 0.43 | 0.5116 |
Table 3
Model results for GLMMs testing the occurrence of tool use. p-values are presented only for the first model as the two other models were not significant (see Table 2). All numeric predictor variables were standardized to mean = 0 and SD = 1. For sex, ‘female’ is the reference level.
| 1 week | 7 weeks | 13 weeks | ||||||||||
|---|---|---|---|---|---|---|---|---|---|---|---|---|
| β | ± se | z | p | β | ± se | z | p | β | ± se | z | p | |
| Intercept | −3.55 | 0.42 | −8.47 | 0.0000 | −3.39 | 0.37 | – | – | −3.40 | 0.37 | – | – |
| Ripe fruit feeding | −0.24 | 0.26 | −0.93 | 0.3525 | −0.33 | 0.24 | – | – | −0.35 | 0.24 | – | – |
| Travel time | 0.67 | 0.30 | 2.25 | 0.0242 | 0.30 | 0.27 | – | – | 0.32 | 0.26 | – | – |
| Sex (male) | −0.07 | 0.58 | −0.12 | 0.9062 | 0.04 | 0.54 | – | – | 0.04 | 0.55 | – | – |
| Age | −0.56 | 0.33 | −1.72 | 0.0855 | −0.56 | 0.29 | – | – | −0.55 | 0.29 | – | – |
| Auto-correlation | 0.80 | 0.18 | 4.44 | 0.0000 | 0.52 | 0.16 | – | – | 0.50 | 0.16 | – | – |
Table 4
Data set for the cross-community comparison of nine wild chimpanzee study sites. Number of tools used were taken from Sanz and Morgan (2007), except for Fongoli.
| Subspecies | Site/ group | Number of tools | % fruit in diet | % travel | Daily travel distance (km) | Reference |
|---|---|---|---|---|---|---|
| verus | Bossou | 13 | 60.3 | 19.5 | – | Hockings et al. (2009, 2012) |
| Fongoli | 10* | 60.8 | 11.0 | 3.3* | Bogart and Pruetz (2011); Pruetz and Bertolani (2009) | |
| Tai/North | 11 | 85.0 | 22.0 | 3.7§ | Boesch and Boesch-Achermann (2000); Boesch et al. (2006); Herbinger et al. (2001) | |
| troglodytes | Goualougo | 11 | 56.0 | 12.8† | – | Morgan and Sanz (2006); Sanz† (2004) |
| schweinfurthii | Gombe | 12 | 43.0 | 13.6 | 3.9§ | Wrangham (1977) |
| Kanyawara | 2 | 66.6 | 11.0 | 2.1§ | Pontzer and Wrangham (2004); Potts et al. (2011) | |
| Mahale/M | 5 | 31.0 | 18.6‡ | 4.8¶ | Huffman‡ (1990); Matsumoto-Oda¶ (2002); Nishida and Uehara, (1983) | |
| Ngogo | 4 | 91.5 | 14.0 | 3.0# | Amsler# (2010); Potts et al. (2011) | |
| Sonso | 1 | 65.5 | 7.5 | 2.1** | Bates and Byrne** (2009); Fawcett (2000); Newton-Fisher (1999) |
-
* Jill Pruetz, personal communication; travel estimate based on data from rainy season;
-
percentage of travel in daily budget:
-
† from her table 6.2, taking the highest value (range: 7.6−12.8) as travel activity was likely underestimated because of low habituation (Sanz, 2004, p.169);
-
‡ from his table 12.2, mean over individuals of both sex in the year 1985;
-
daily travel values:
-
§ average calculated across sex following Pontzer and Wrangham (2004);
-
# from her table I, calculated as sum of hourly averages over a 10-hr activity day, based on males only;
-
¶ from her figure 4, calculated across seasons and sex;
-
** calculated from the average provided for each sex.
Additional files
-
Source code 1
Datasets and model specifications.
- https://doi.org/10.7554/eLife.16371.016
Download links
A two-part list of links to download the article, or parts of the article, in various formats.
Downloads (link to download the article as PDF)
Open citations (links to open the citations from this article in various online reference manager services)
Cite this article (links to download the citations from this article in formats compatible with various reference manager tools)
Travel fosters tool use in wild chimpanzees
eLife 5:e16371.
https://doi.org/10.7554/eLife.16371


