Research: Decoupling of the minority PhD talent pool and assistant professor hiring in medical school basic science departments in the US
- National Institute of General Medical Sciences, United States
- Association of American Medical Colleges, United States
- The George Washington University, United States
Figures
Figure 1

Temporal trends in the populations of biomedical Underrepresented Minority (URM) and Well-Represented (WR) PhD graduates and assistant professors, 1980-2014.
Line charts showing the (i) annual population, (ii) population growth relative to 1980, and (iii) percentage representation of PhD graduates and assistant professors in basic science departments in medical schools for scientists from (A) URM and (B) WR racial-ethnic backgrounds. Data on the populations of PhD graduates and assistant professors in medical school basic science departments were obtained from the National Science Foundation Survey of Earned Doctorates (as compiled by Federation of American Societies for Experimental Biology), and the AAMC Faculty Roster, respectively (please see methods section for more information). Grey lines represent PhD graduates, and black lines represent assistant professors. In panels Aiii and Biii, solid grey lines represent the percentages of URM and WR PhD graduates among all students who receive PhDs in the U.S. (U.S. citizen, permanent resident, and international), and dotted lines show percentages among PhD graduates who are U.S. citizens and permanent residents. The relative growth of PhD graduates from URM backgrounds to assistant professors is greater than the same comparison among scientists from WR backgrounds (i.e., there was a significant interaction between the URM status and position, β=1.60; p=3.6*10−7; panels Aii and Bii). Data are available in Figure 1—source data 1.
-
Figure 1—source data 1
PhD graduates and assistant professors (Total, URM and WR): 1980-2014.
- https://doi.org/10.7554/eLife.21393.003
Figure 2 with 1 supplement
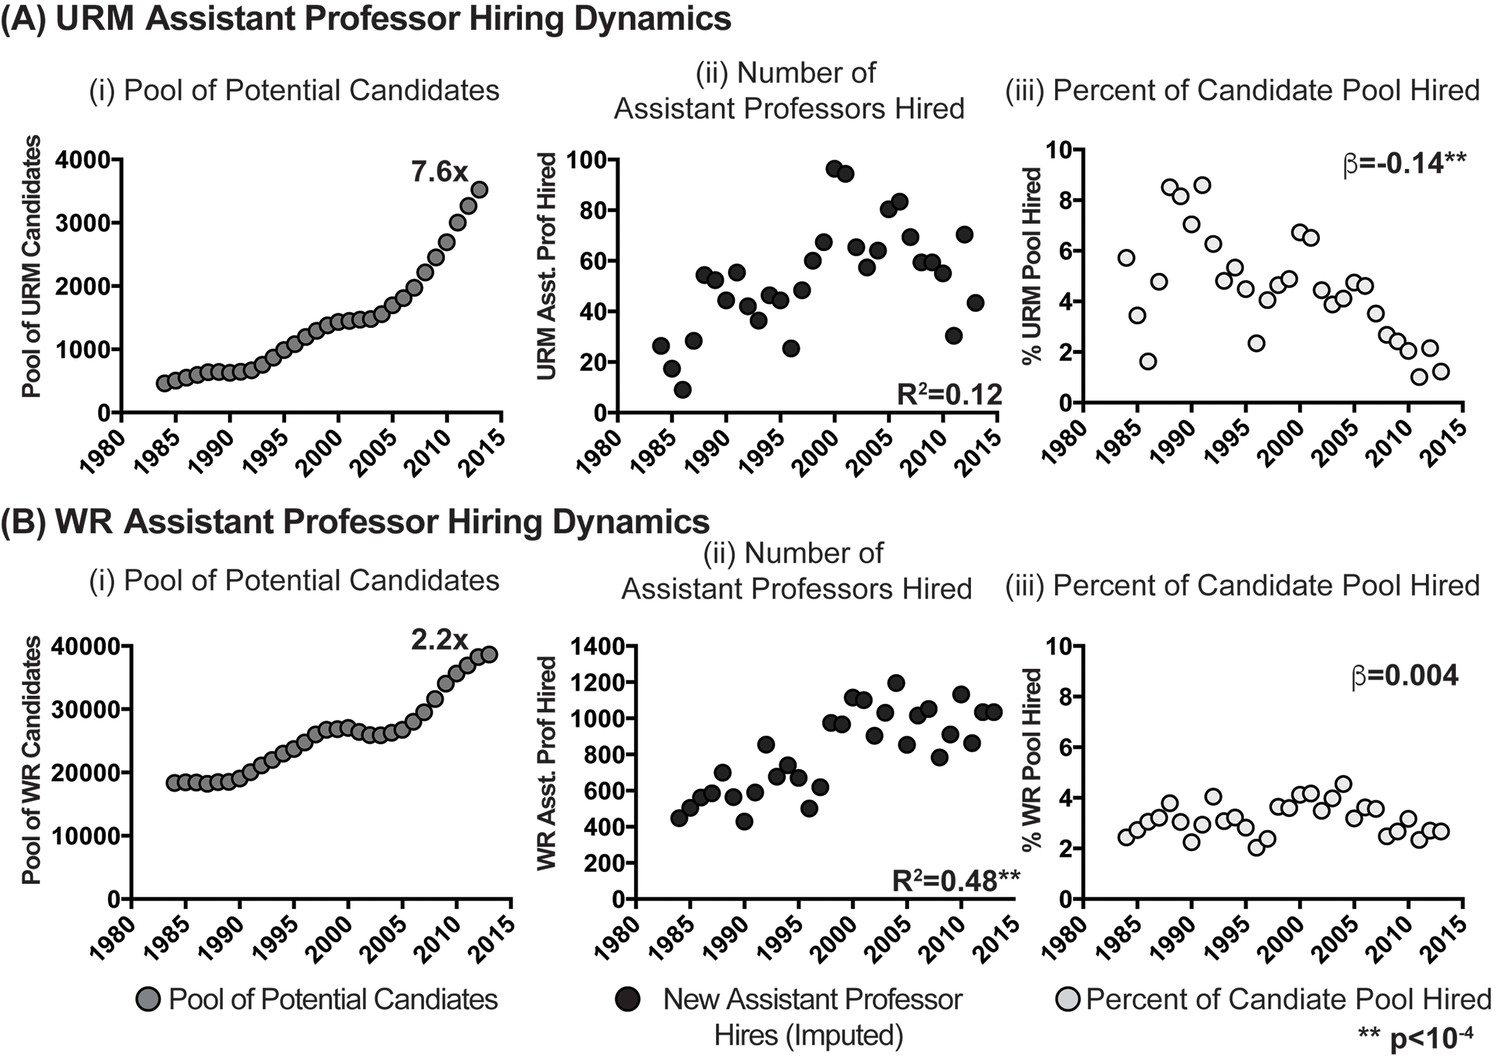
Candidate pool size, hiring and utilization of URM and WR assistant professors in basic biomedical science departments.
Scatter plots showing the (i) pool of potential candidates for assistant professor positions, (ii) annual number of assistant professors hired, and (iii) percentage of the potential candidate pool hired annually for scientists from (A) URM and (B) WR backgrounds. R2 values in panels Aii and Bii are derived from correlating number of URM or WR assistant professors hired with the size of their respective pool of potential candidates. β in panels Aiii and Biii reflect the yearly percentage change in the fraction of the pools of URM and WR scientists hired into assistant professor positions. Asterisks represent significant values (p<10−4). Data are available in Figure 2—source data 1 and 2.
-
Figure 2—source data 1
Assistant professor hiring and leaving (total, URM and WR): 1980-2014.
- https://doi.org/10.7554/eLife.21393.005
-
Figure 2—source data 2
Candidate pool and fraction hired (URM and WR): 1980-2014.
- https://doi.org/10.7554/eLife.21393.006
Figure 2—figure supplement 1
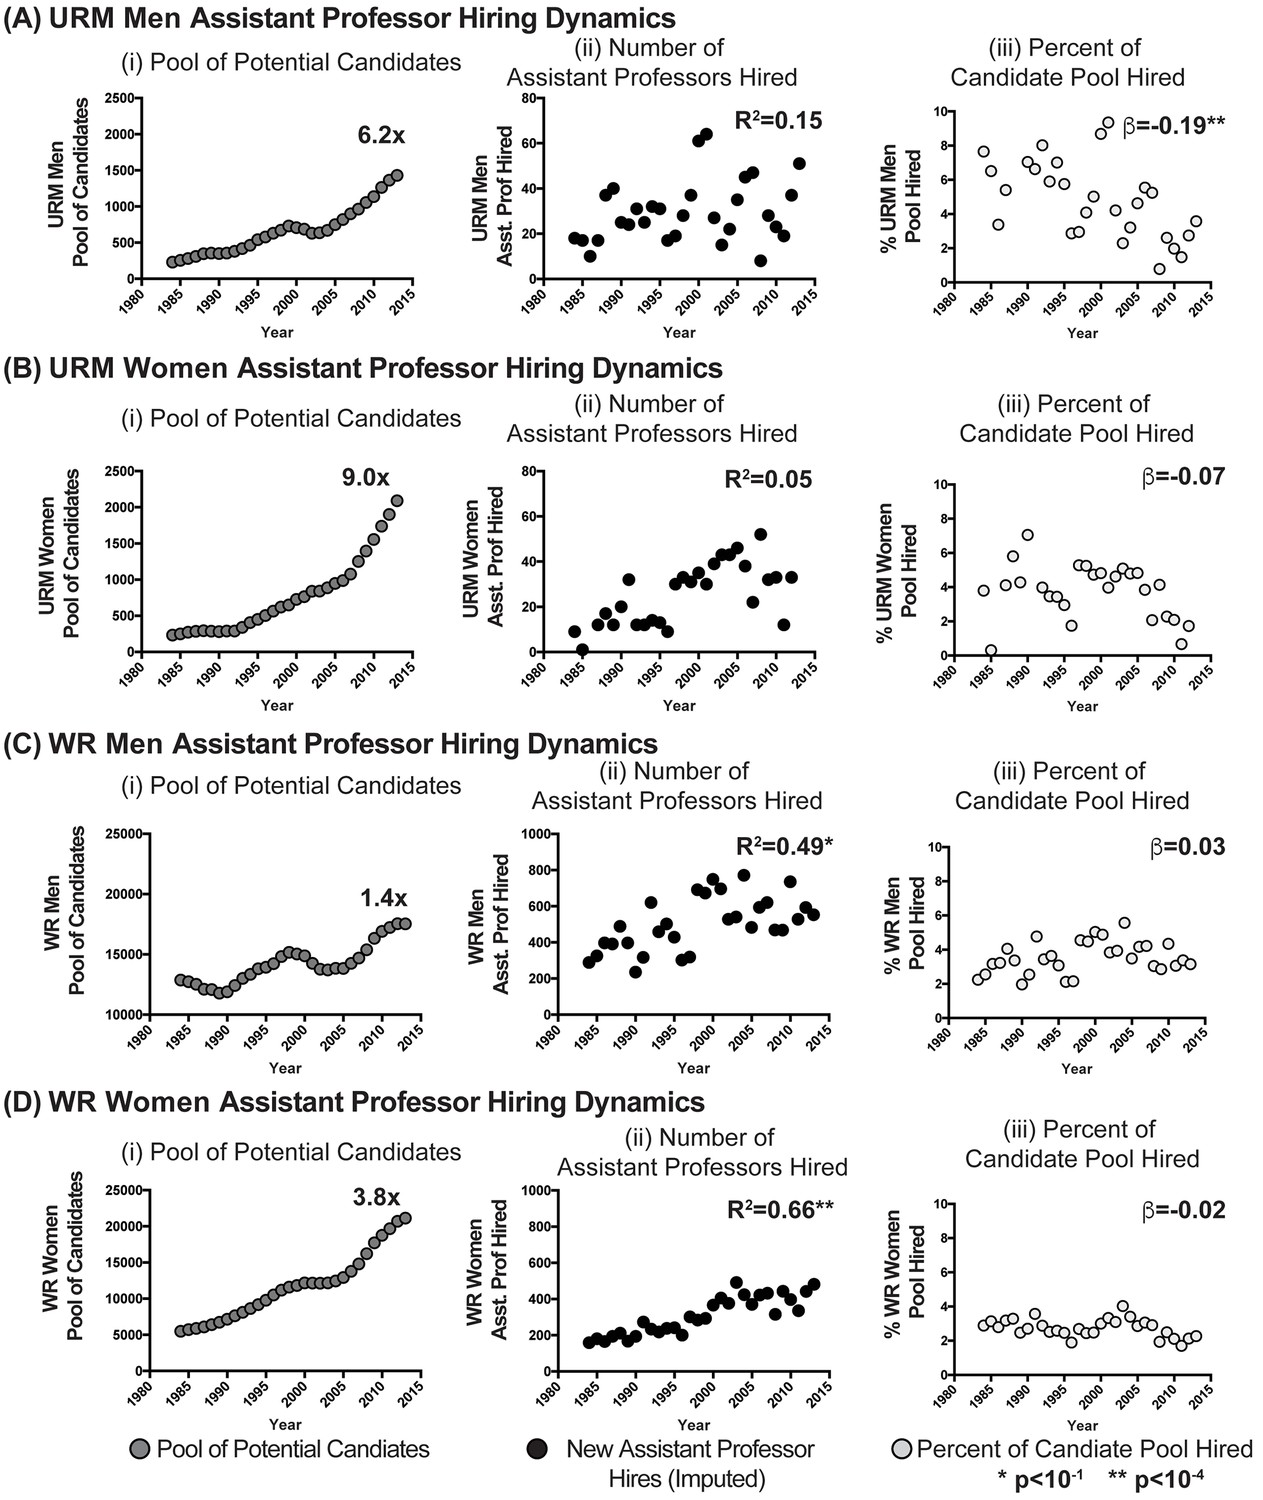
Candidate pool size, hiring and utilization of URM and WR assistant professors in basic biomedical science departments: by gender.
Scatter plots showing the (i) pool of potential candidates for assistant professor positions, (ii) annual number of assistant professors hired, and (iii) percentage of the potential candidate pool hired annually for (A) URM Men, (B) URM Women, (C) WR Men, and (D) WR women. R2 values in panels A-Dii were derived from correlating number of URM or WR assistant professors hired with the size of their respective pool of potential candidates. β in panels A-Diii reflect the yearly percentage change in the fraction of the pools of URM and WR scientists hired into assistant professor positions. Asterisks represent significant values (p<10−4). Data are available in Figure 2—source data 1 and 2.
Figure 3
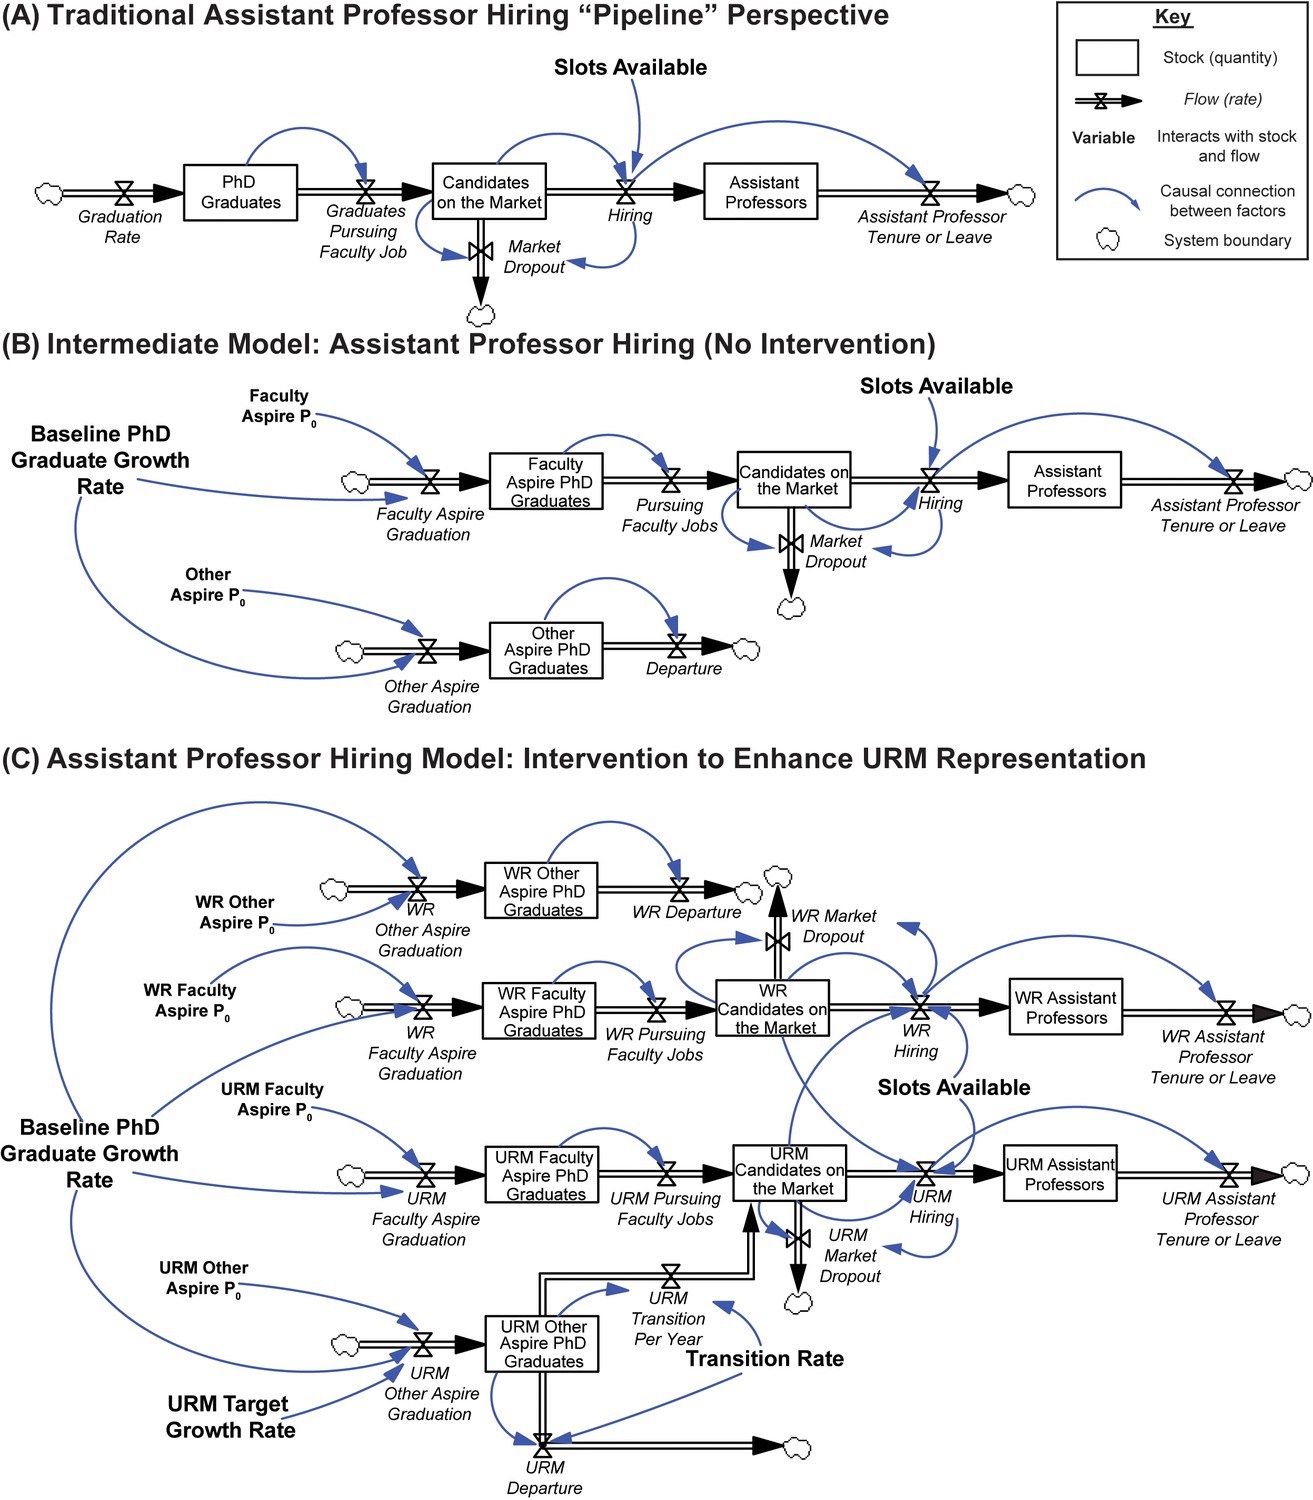
System dynamics model of assistant professor hiring.
(A) A traditional “pipeline” view of faculty hiring. A fraction of the total stock of PhD graduates pursues faculty positions, and thus become candidates on the market. Candidates on the market are composed primarily of the subset of postdoctoral scientists pursuing faculty careers in medical school basic science departments but can include those who have non-traditional career paths such as the rare PhD student who proceeds directly to the faculty job market. Each year, candidates on the market are hired into the stock of assistant professors at a rate equal to the total number of slots available (“slots available”), and candidates who are not hired remain in the pool conditional on hiring probability (“market dropout”). After six years, assistant professors leave the system (either via promotion or contract termination, “Assistant Professor Tenure or Leave”). Boxes represent stocks (quantities), hourglasses represent flows (rates; writing italicized), variables are bolded, blue arrows represent causal connections between factors, and clouds represent system boundaries (B) Intermediate conceptual model. The pool of PhD graduates is separated into two groups: those who will pursue and enter faculty positions in research-intensive environments (“Faculty Aspire”), and those who will pursue other career interests (“Other Aspire”). All “Faculty Aspire” graduates enter the academic job market (“Candidates on the Market”) and remain based on hiring probability, while the “Other Aspire” scientists depart the system. As the total number of PhD graduates grows (“Baseline PhD Graduate Growth Rate”), the populations of “Faculty Aspire” and “Other Aspire” graduates are expected to grow equally (i.e. they maintain the same, fixed proportions with respect to one another). Initial populations (P0) of “Faculty Aspire” and “Other Aspire” candidates represent scaling factors that, together with the baseline growth rate, produce the number of PhD graduates in each stock. Candidates on the market are hired into the stock of assistant professors at a rate equal to the total number of slots available, and then depart the system six years later. (C) Elaborated model of faculty hiring for PhD scientists from WR and URM backgrounds with intervention to enhance workforce diversity. The career pathways of URM and WR scientists are conceptualized as independent, but are linked with respect to assistant professor hiring by the number of assistant professor slots available. URM and WR candidates are hired based on the number of slots available, and in proportion to their representation on the market (hence the influence of WR candidates on the URM hiring rate and vice versa). That is, the model posits no bias in hiring. In addition to baseline growth, the variable “URM Target Growth Rate” represents efforts from the scientific community to enhance workforce diversity. These additional URM scientists are initially added to the “URM other aspire” stock. The “transition rate” represents the percentage of URM other aspire scientists that enter the faculty market. As this rate increases, more URM candidates enter the academic job market. Candidates hired leave the system after six years, and the initial populations (P0) are derived from empirical data as described in methods.
Figure 4
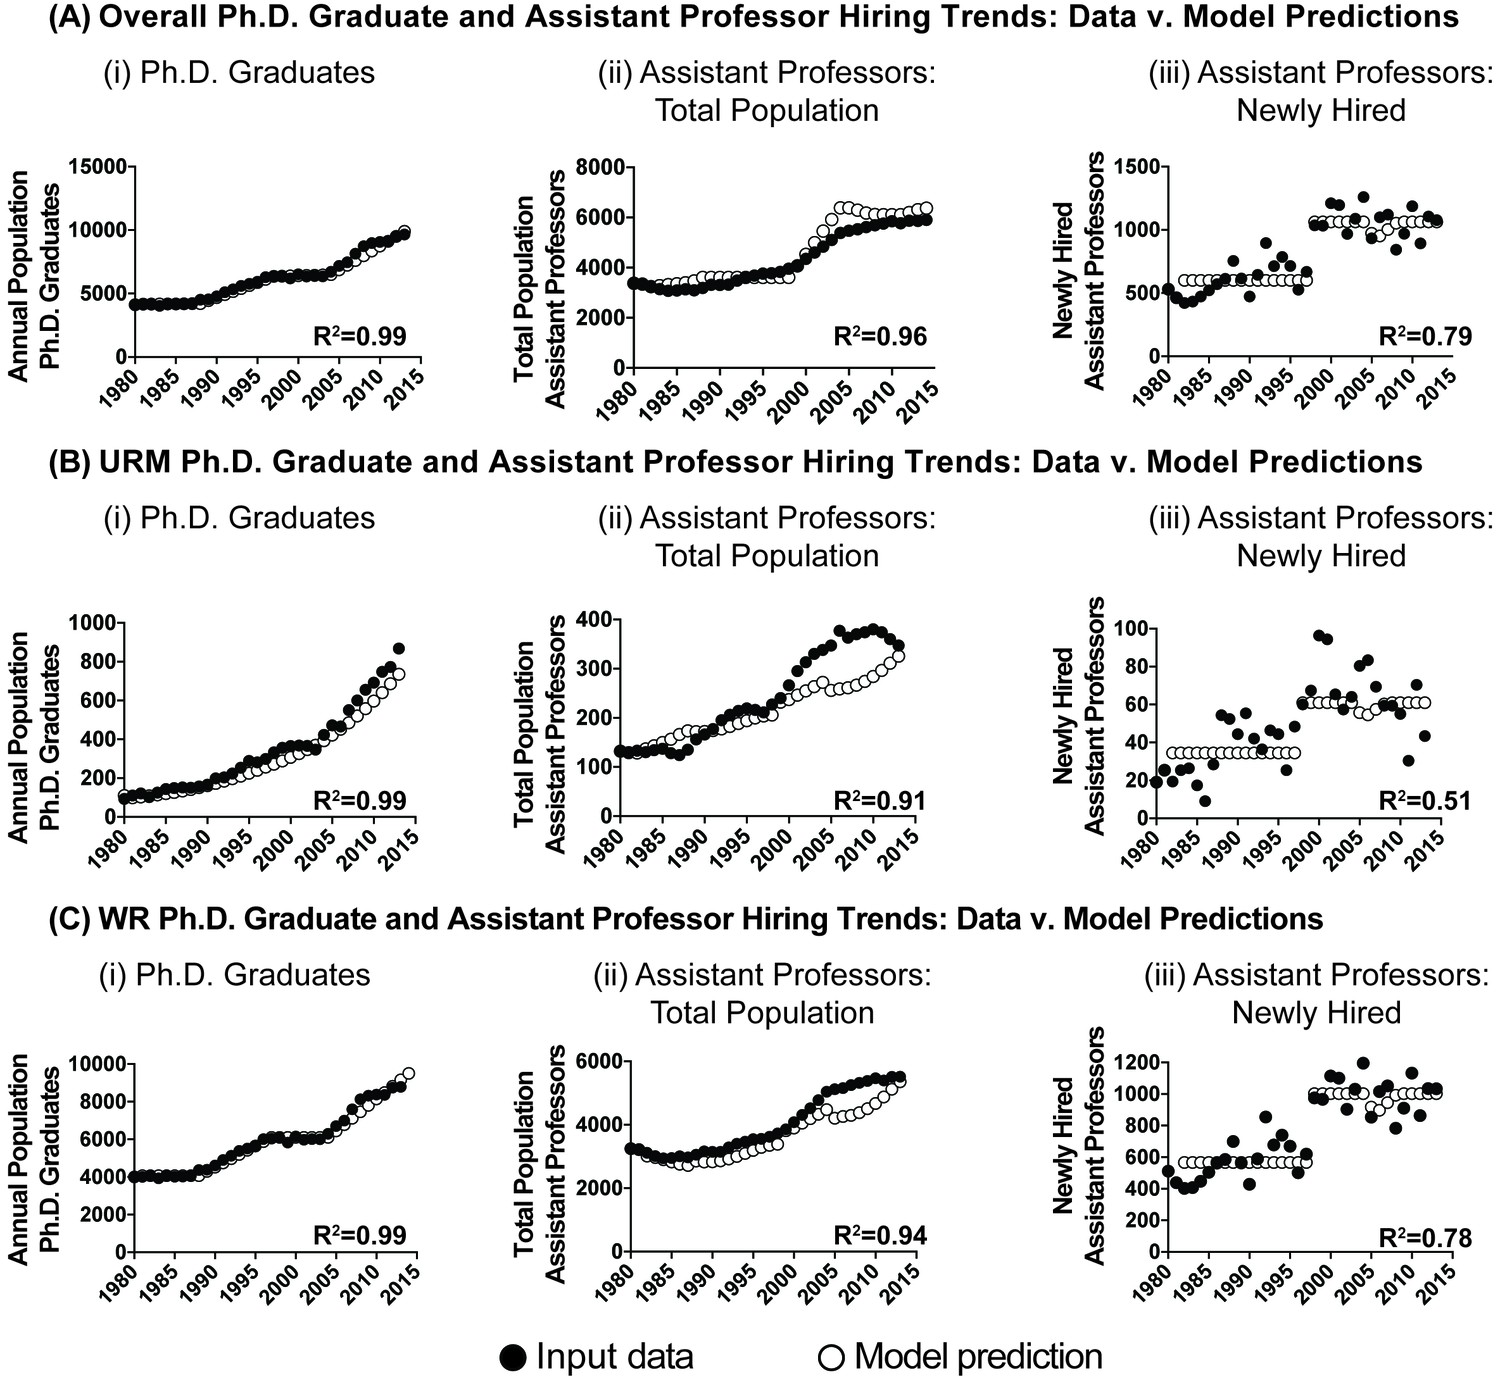
Model simulation: 1980-2013.
Scatter plots showing the performance of the model (open circles) compared to input data (filled circles) for the populations of (i) PhD graduates, (ii) assistant professors, and (iii) newly hired assistant professors for the (A) overall pool, (B) pool of URM scientists, and (C) pool of WR scientists. All R2 values are significant at the p<0.0001 level.
Figure 5
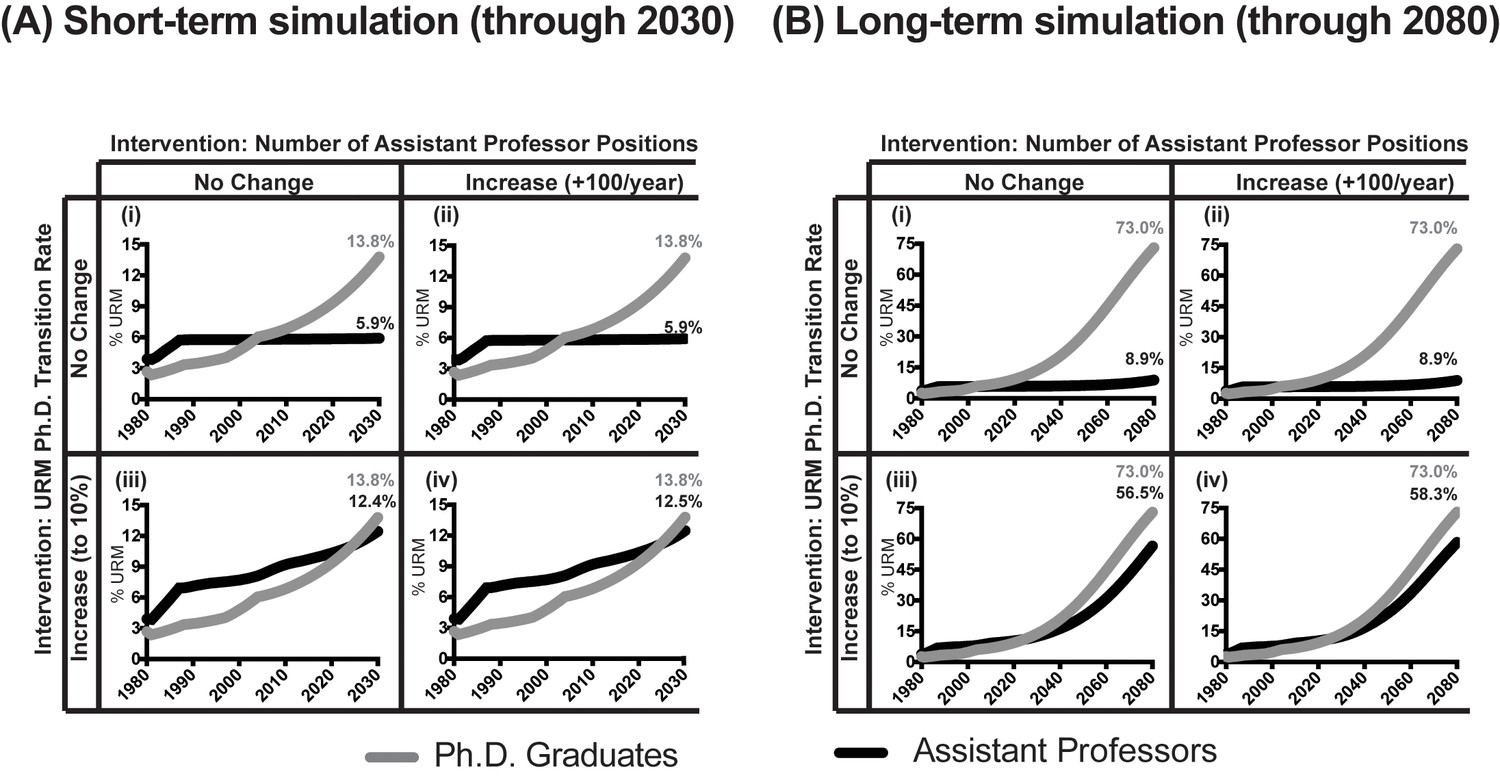
Model predictions of URM assistant professor attainment.
Line graph showing model predictions for the percentage of URM PhD graduates (grey), and the corresponding percentages of URM assistant professors (black) as a function of various intervention strategies to increase faculty diversity in (A) short-term, through 2030, and (B) long-term, through 2080. All model runs assume an exponential increase in the number of PhDs from URM backgrounds. Thus, in all runs, the percentage of PhD scientists from URM backgrounds is 13.8% in 2030 and 73% in 2080. Simulations: (i) No change in transition rate (0.25%) or number of assistant professor positions. (ii) No change in transition rate (0.25%), increase the number of assistant professor positions by 100 per year, beginning in 2015. (iii) Increase transition rate to 10%, and no change in the number of assistant professor positions. (iv) Increase transition rate to 10% and increase the number of assistant professor positions by 100 per year, beginning in 2015.
-
Figure 5—source data 1
Model predictions: percentage URM assistant professors by transition rate: 1980-2080 (current number of assistant professor positions)
- https://doi.org/10.7554/eLife.21393.011
-
Figure 5—source data 2
Model predictions: percentage URM assistant professors by transition rate: 1980-2080 (100 new assistant professor positions, annually, beginning in 2015)
- https://doi.org/10.7554/eLife.21393.012
Tables
Appendix 1—table 1
Model formulation.
| Notation | Description | Formulation |
|---|---|---|
UTG | URM Target Growth Rate | |
GRWR,Other | WR Non-Faculty Student Growth Rate | BSG * P0,WR,Other |
GRWR,Faculty | WR Faculty Student Growth Rate | BSG * P0,WR,Faculty |
GRURM,Other | URM Non-Faculty Student Growth Rate | BSG * P0,URM,Other |
GRURM,Faculty | URM Faculty Student Growth Rate | MAX(BSG * P0,URM,Faculty, UTG * P0,URM,Faculty) |
PHDWR,Other | WR Non-Faculty PHD Graduates | PHDWR,Other,0 |
PHDWR,Faculty | WR Faculty Student PHD Graduates | PHDWR,Faculty,0 |
PHDURM,Other | URM Non-Faculty PHD Graduates | PHDURM,Other,0 |
PHDURM,Faculty | URM Faculty PHD Graduates | PHDURM,Faculty,0 |
DRWR,Other | WR Non-Faculty Student Departure Rate | PHDWR.Other |
MRWR,Faculty | WR Faculty Student Market Entrance Rate | PHDWR.Faculty |
DRURM,Other | WR Non-Faculty Student Market Entrance Rate | PHDWR.Other |
MRURM,Faculty | WR Faculty Student Market Transition Rate | CUTR*PHDURM.Faculty |
TRURM,Faculty | WR Faculty Student Departure Rate | (1-CUTR)*PHDURM.Faculty |
PDWR | WR Candidates on the Market (e.g., Postdocs) | PDWR, 0 |
PDURM | URM Candidates on the Market (e.g., Postdocs) | PDURM,0 |
πURM | Proportion of URM candidates on the market | PDURM/(PDURM+ PDWR) |
HRWR | Hiring rate of WR candidates | MIN[PDWR,S*(1- πURM)] |
HRURM | Hiring rate of URM candidates | MIN(PDURM,S*πURM) |
DRWR,Faculty | WR Faculty Student Departure Rate | |
DRURM,Faculty | URM Faculty Student Departure Rate | |
APWR | WR Assistant Professors | APWR, 0 |
APURM | URM Assistant Professors | APURM,0 |
-
Note: denotes hiring rate of assistant professors delayed by six time steps (i.e., the length of a tenure cycle). For timesteps <7, is calculated by amortization of the initial value of assistant professors AP., 0.
Appendix 1—table 2
Parameters and exogenous variables.
| Notation | Description | Value | Source |
|---|---|---|---|
P0,URM,Faculty | URM Faculty Student Growth Rate Multiplier | 34.44 | AAMC Faculty Roster (Imputed values, URM hiring 1980-1997) |
P0,URM,Other | URM Non-Faculty Student Growth Rate Multiplier | 64 | AAMC Faculty Roster (Exponential fit of URM PhD graduate growth and imputed URM hiring 1980-1997) |
P0,WR,Faculty | WR Faculty Student Growth Rate Multiplier | 566.67 | AAMC Faculty Roster (Imputed values, WR hiring 1980-1997) |
P0,WR,Other | WR Non-Faculty Student Growth Rate Multiplier | 3500 | AAMC Faculty Roster (Linear fit of WR PhD graduate growth and imputed WR hiring 1980-1997) |
CUTG | URM Target Growth Constant | 0.0728 | FASEB (Author estimation based on exponential fit to URM PhD graduation rate 1980-2013) |
PHDWR,Other,0 | Initial WR Non-Faculty PhD Graduates | 3570 | FASEB (Author estimation based on number of WR PhD graduates) |
PHDWR,Other,0 | Initial WR Faculty PhD Graduates | 438 | FASEB (Author estimation based on number of WR PhD graduates) |
PHDWR,Other,0 | Initial URM Non-Faculty PhD Graduates | 84.6 | FASEB (Author estimation based on number of URM PhD graduates) |
PHDWR,Other,0 | Initial URM Faculty PhD Graduates | 25.4 | FASEB (Author estimation based on number of URM PhD graduates) |
CUTR | URM Transition Rate Constant | 0.0025 | AAMC Faculty Roster (Author estimation based on % URM Assistant Professor 2014) |
PDWR, 0 | Initial WR Candidates on the Market | 511 | AAMC Faculty Roster (Imputed Hiring Value) |
PDURM,0 | Initial URM Candidates on the Market | 19 | AAMC Faculty Roster (Imputed Hiring Value) |
S | Faculty Slots Available per Year | Step function time series: | AAMC Faculty Roster (average of imputed hiring values: 1980-1997; 1998-2013) |
APWR, 0 | Initial WR Assistant Professors | 3246 | AAMC Faculty Roster |
APURM,0 | Initial URM Assistant Professors | 132 | AAMC Faculty Roster |
Additional files
-
Source code 1
Vensim file containing the final system dynamics model of assistant professor hiring in basic science departments of medical schools.
- https://doi.org/10.7554/eLife.21393.013
Download links
A two-part list of links to download the article, or parts of the article, in various formats.
Downloads (link to download the article as PDF)
Open citations (links to open the citations from this article in various online reference manager services)
Cite this article (links to download the citations from this article in formats compatible with various reference manager tools)
Research: Decoupling of the minority PhD talent pool and assistant professor hiring in medical school basic science departments in the US
eLife 5:e21393.
https://doi.org/10.7554/eLife.21393


