Research: Publication bias and the canonization of false facts
- University of Copenhagen, Denmark
- University of Washington, United States
- North Carolina State University, United States
Figures
Figure 1

Conducting and reporting the test of a claim.
In our model, a scientific claim is either true or false. Researchers conduct an experiment which either supports or fails to the support the claim. True claims are correctly supported with probability while false claims are incorrectly supported with probability . Next, the researchers may attempt to publish their results. Positive results that support the claim are published with probability whereas negative results that fail to support the claim are published with probability . This process then repeats, with additional experiments conducted until the claim is canonized as fact or rejected as false.
Figure 2
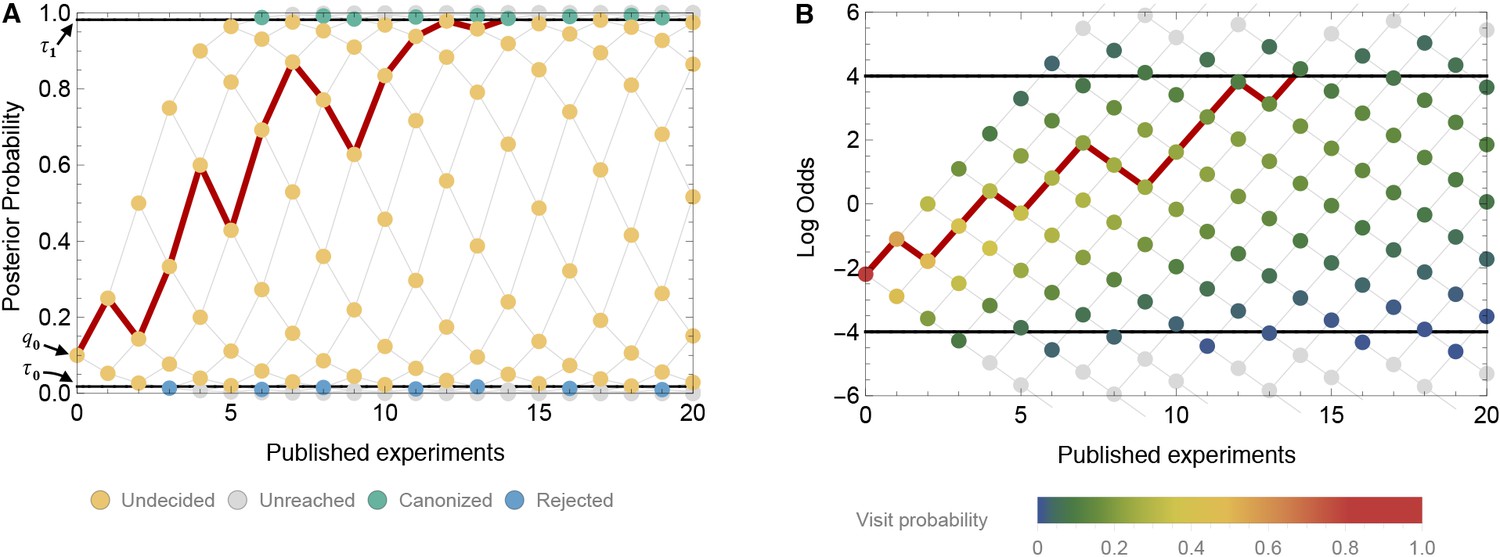
A time-directed graph represents the evolution of belief over time.
In panel A, the horizontal axis indicates the number of experiments published and the vertical axis reflects the observer’s belief, quantified as the probability that the claim is true. The process begins at the single point at far left with an initial belief . Each subsequent experiment either supports the claim, moving to the next node up and right, or contradicts the claim, moving to the next node down and right. At yellow nodes, the status of the claim is as yet undecided. At green nodes, it is canonized as fact, and at blue nodes, it is rejected as false. The black horizontal lines show the evidentiary standards ( and ). The red path shows one possible trajectory, in which a positive experiment is followed by a negative, then two positives, then a negative, etc., ultimately becoming canonized as fact when it reaches the upper boundary. Panel B shows the same network, but with the vertical axis representing log odds and using color to indicate the probability that the process visits each node. In log-odds space, each published positive result shifts belief by the constant distance and each negative result by a different distance . Shown here (in both panel A and B) is a false claim with false positive rate , false negative rate , publication probabilities and , and initial belief . In this case, the claim is likely to be canonized as fact, despite being false.
Figure 3

ROC curves reveal that true claims are almost always canonized as fact.
In the receiver operating characteristic (ROC) curves shown here, the vertical axis represents the probability that a true claim is correctly canonized as fact, and the horizontal axis represents the probability that a false one is incorrectly canonized as fact. Panel A: lax evidentiary standards and . Panel B: strict evidentiary standards and . Error rates and initial belief are , , and . Each point along the ROC curve corresponds to a different value of the negative publication rate, , as indicated by color. Grey regions of the curve correspond to the unlikely situations in which , i.e., negative results are more likely to be published than positive ones. The figures reveal two important points. First, when negative results are published at any rate , the vast majority of true claims are canonized as fact. Second, when negative results are published at a low rate ( less than 0.3 or 0.2 depending on evidentiary standards), many false claims will also be canonized as true.
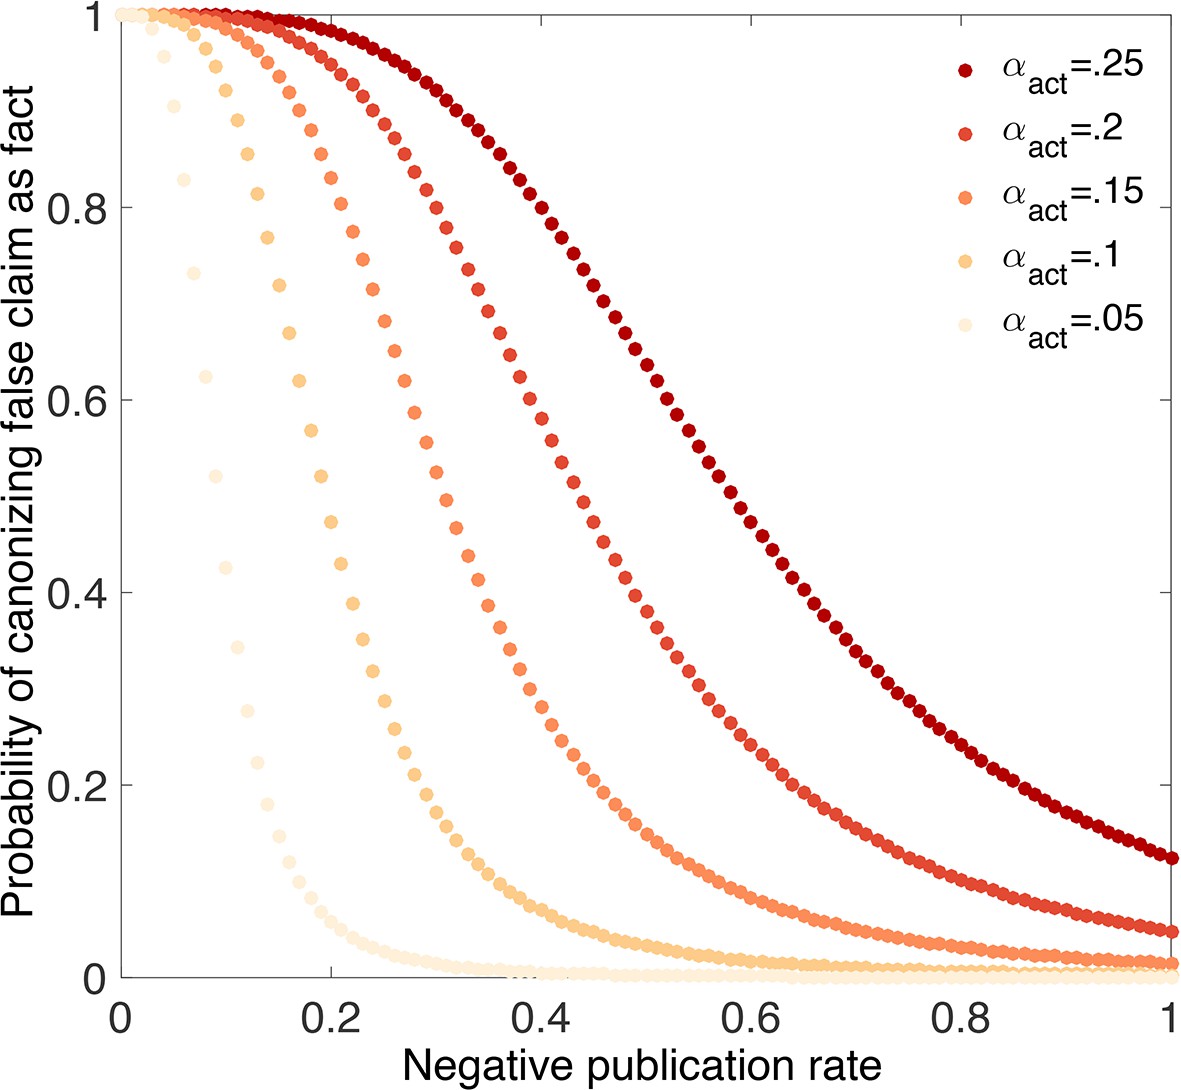
Figure 4
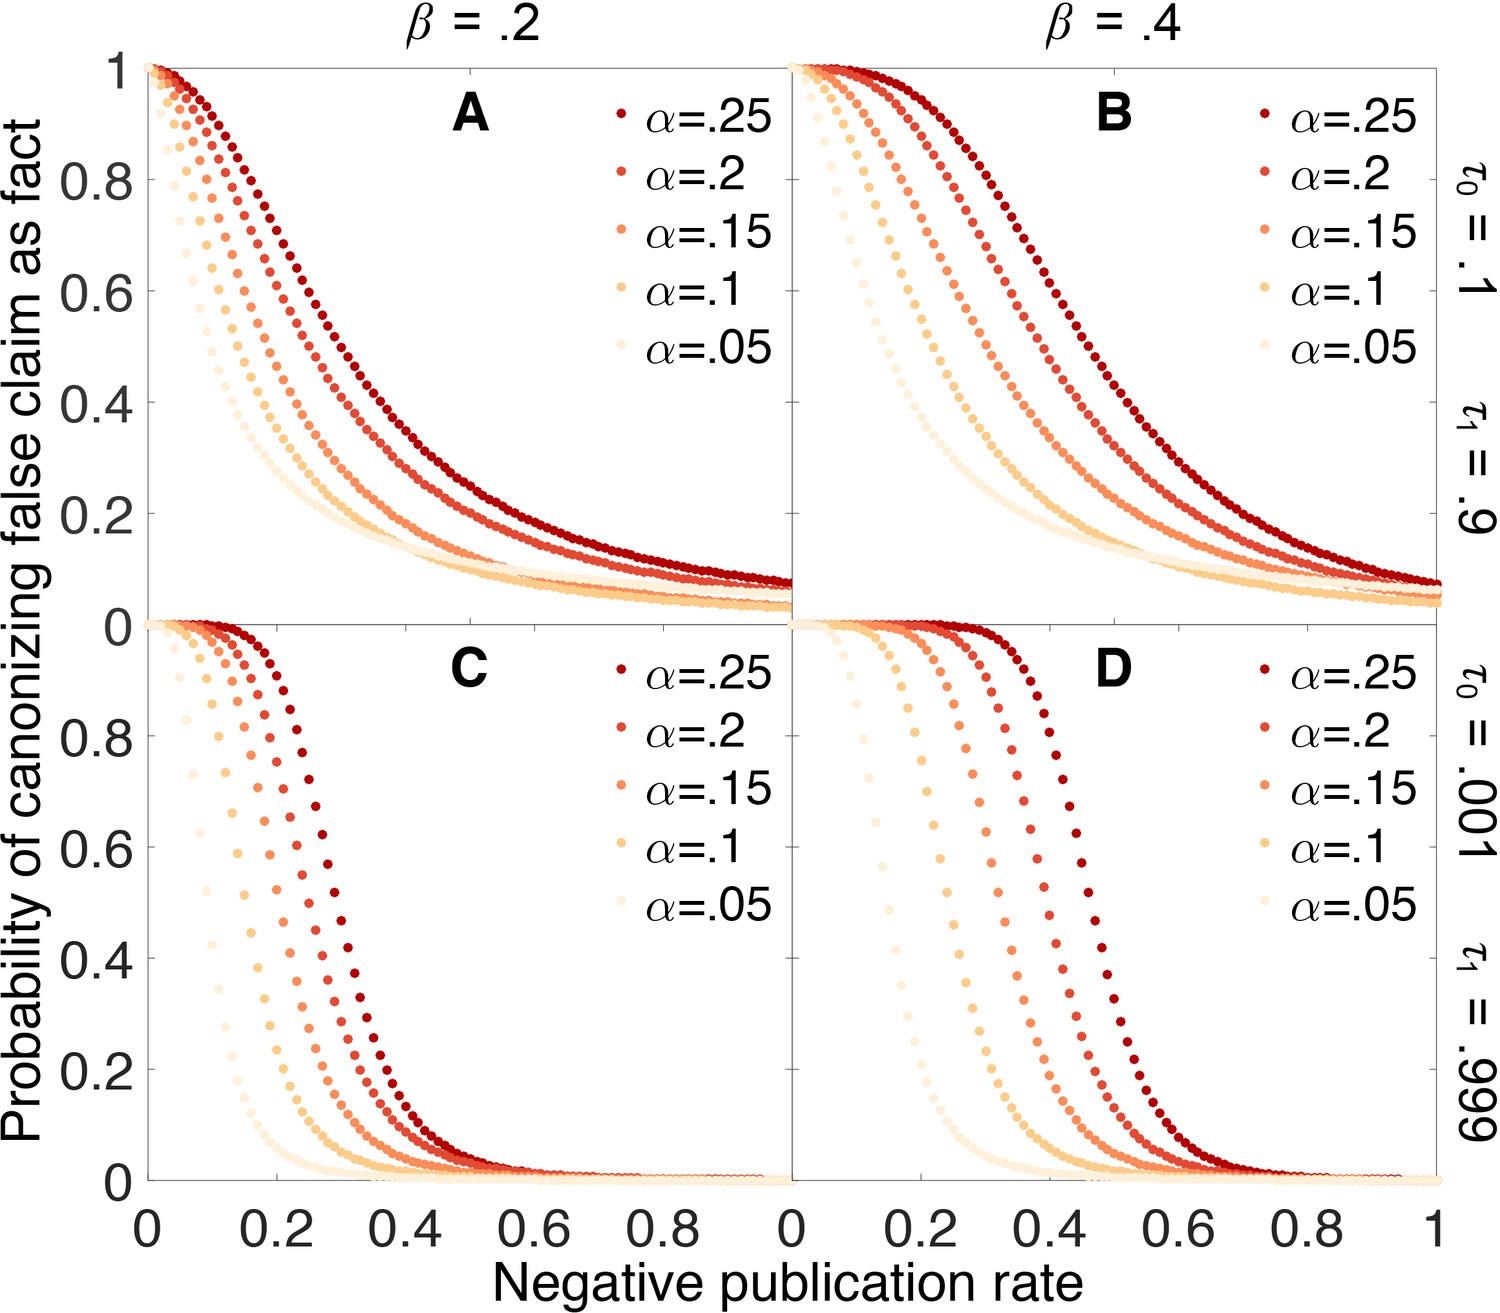
Publishing negative outcomes is essential for rejecting false claims.
Probability that a false claim is incorrectly canonized, as a function of the negative publication rate. Throughout, initial belief is , and individual data series show false positive rates (yellow), (red). Top row: weak evidentiary standards and . Panel A: false negative rate . Panel B: . Panels C–D: similar to panels A–B, with more demanding evidentiary standards and .
Figure 5
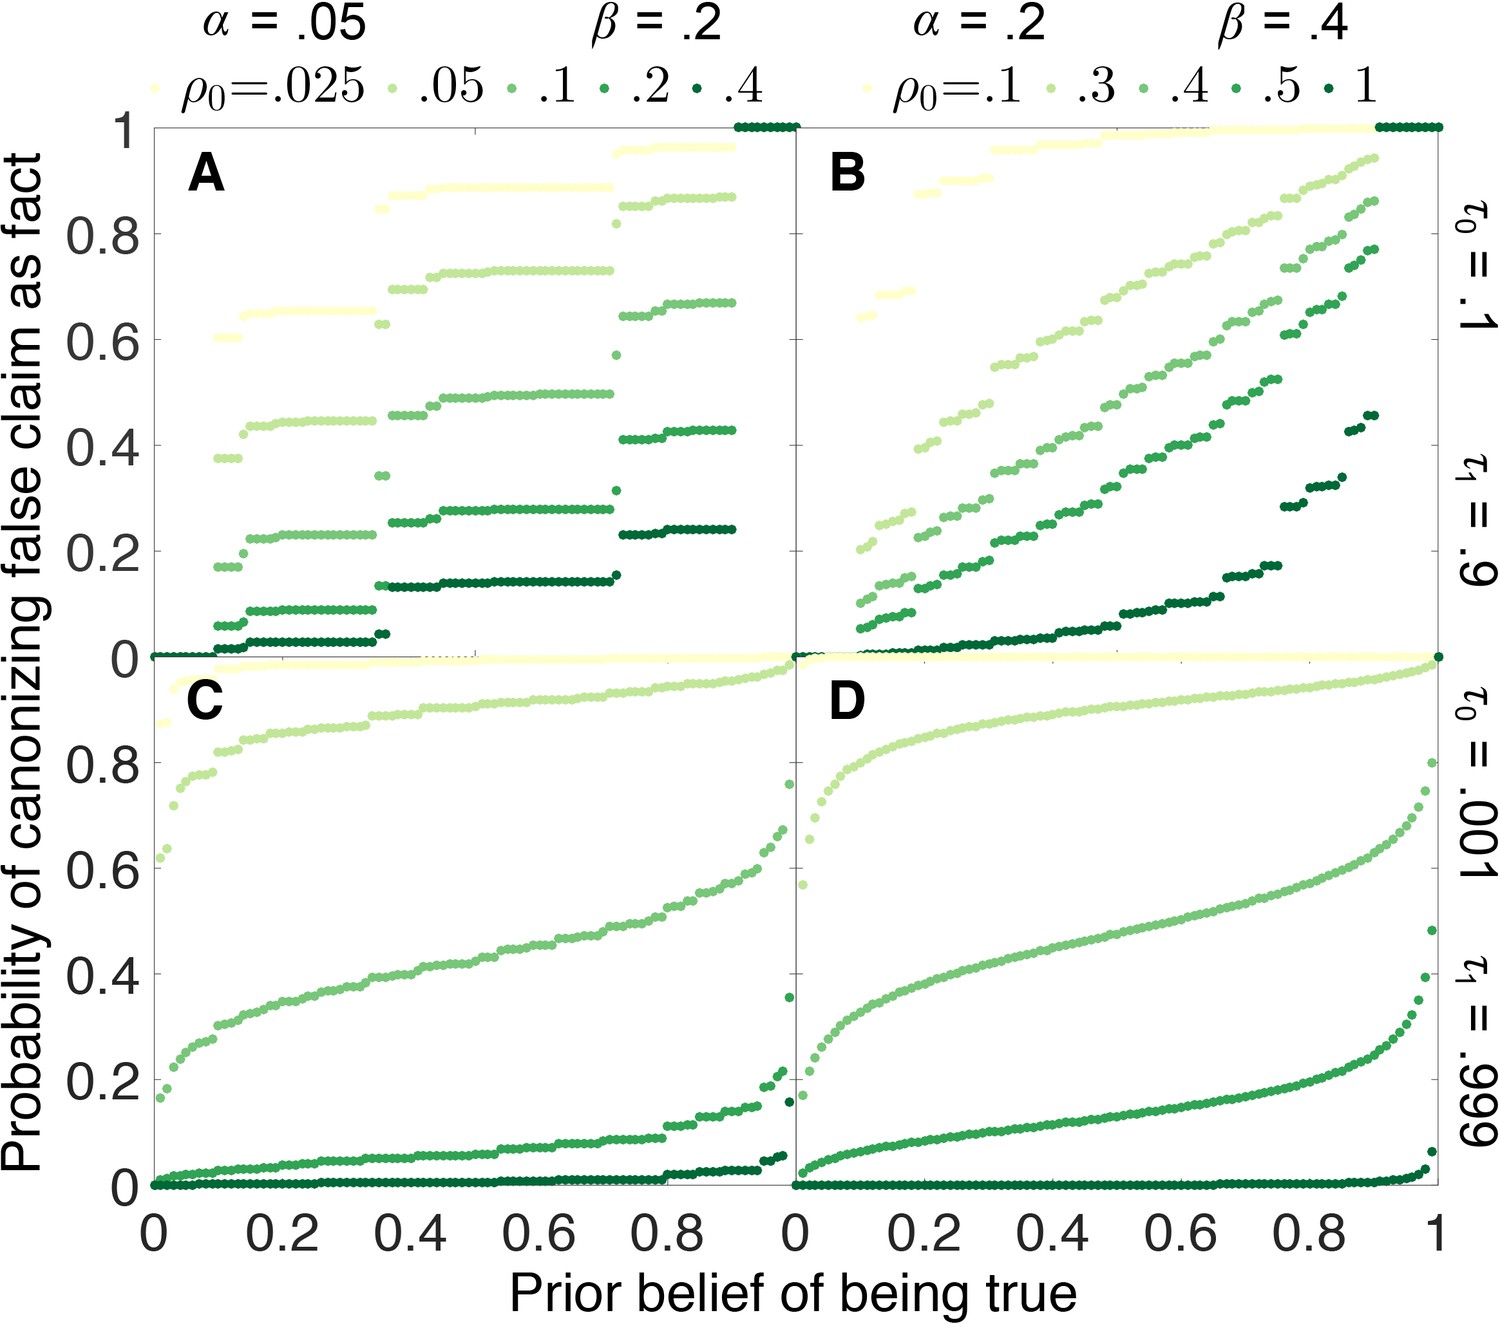
False canonization rates are relatively insensitive to initial belief, unless experimental tests are inaccurate and evidentiary standards are weak.
Probability that a false claim is mistakenly canonized as a true fact vs. prior belief for various negative publication rates. Top row: weak evidentiary standards and . Panel A: false positive rate , false negative rate , and publication rate of negative results (light green), (dark green). Panel B: , , and (light green), (dark green). Panels C–D: similar to panels A–B, with more demanding evidentiary standards and .
Figure 6

Strengthening evidentiary requirements does not necessarily decrease canonization of false facts.
In panel A, the false positive rate is , the false negative rate is , the original belief in the claim is , and the evidentiary standards are symmetric . In panel B, the false positive rate is increased to while the other parameters remain unchanged. Particularly in this latter case, increasing evidentiary standards does not necessarily decrease the rate at which false claims are canonized as facts.
Figure 7
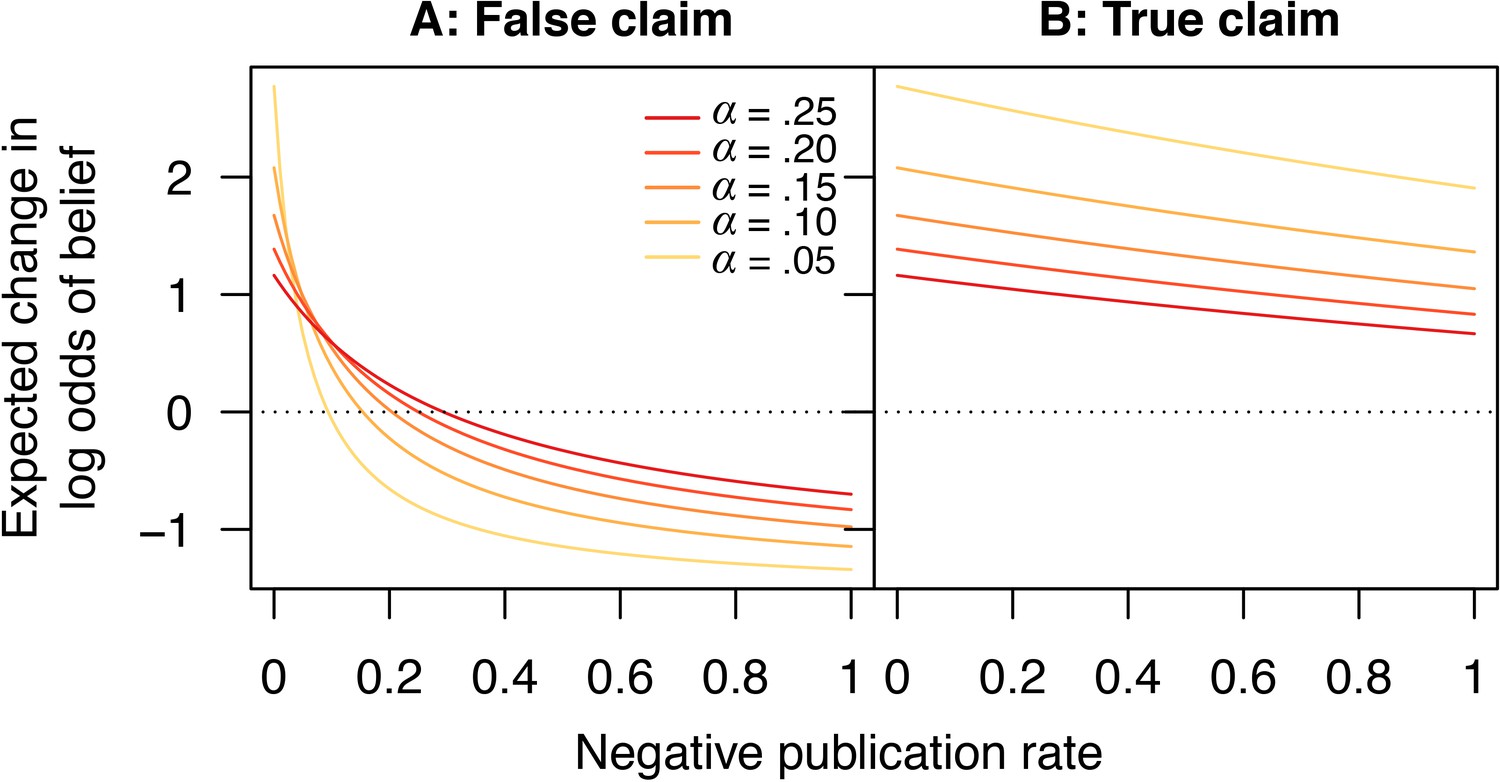
Scientific activity will tend to increase belief in false claims if too few negative outcomes are published.
Expected change in log odds of belief vs. negative publication rate for (A) false and (B) true claims. Lines show false positive rates (yellow), (red). Other parameter values are false negative rate and positive publication rate .
Figure 8
-hacking dramatically increases the chances of canonizing false claims.
Probability that a false claim is canonized as fact vs. fraction of negative outcomes. Throughout, all positive outcomes are published (), and the nominal false positive rate is , the false negative rate is , and evidentiary standards are strong ( and ). Curves show actual false positive rates (yellow), (red). Compared with Figure 4C, in which the nominal rates are equal to the actual rates, the probability of canonizing a false claim as fact is substantially higher.
Figure 9
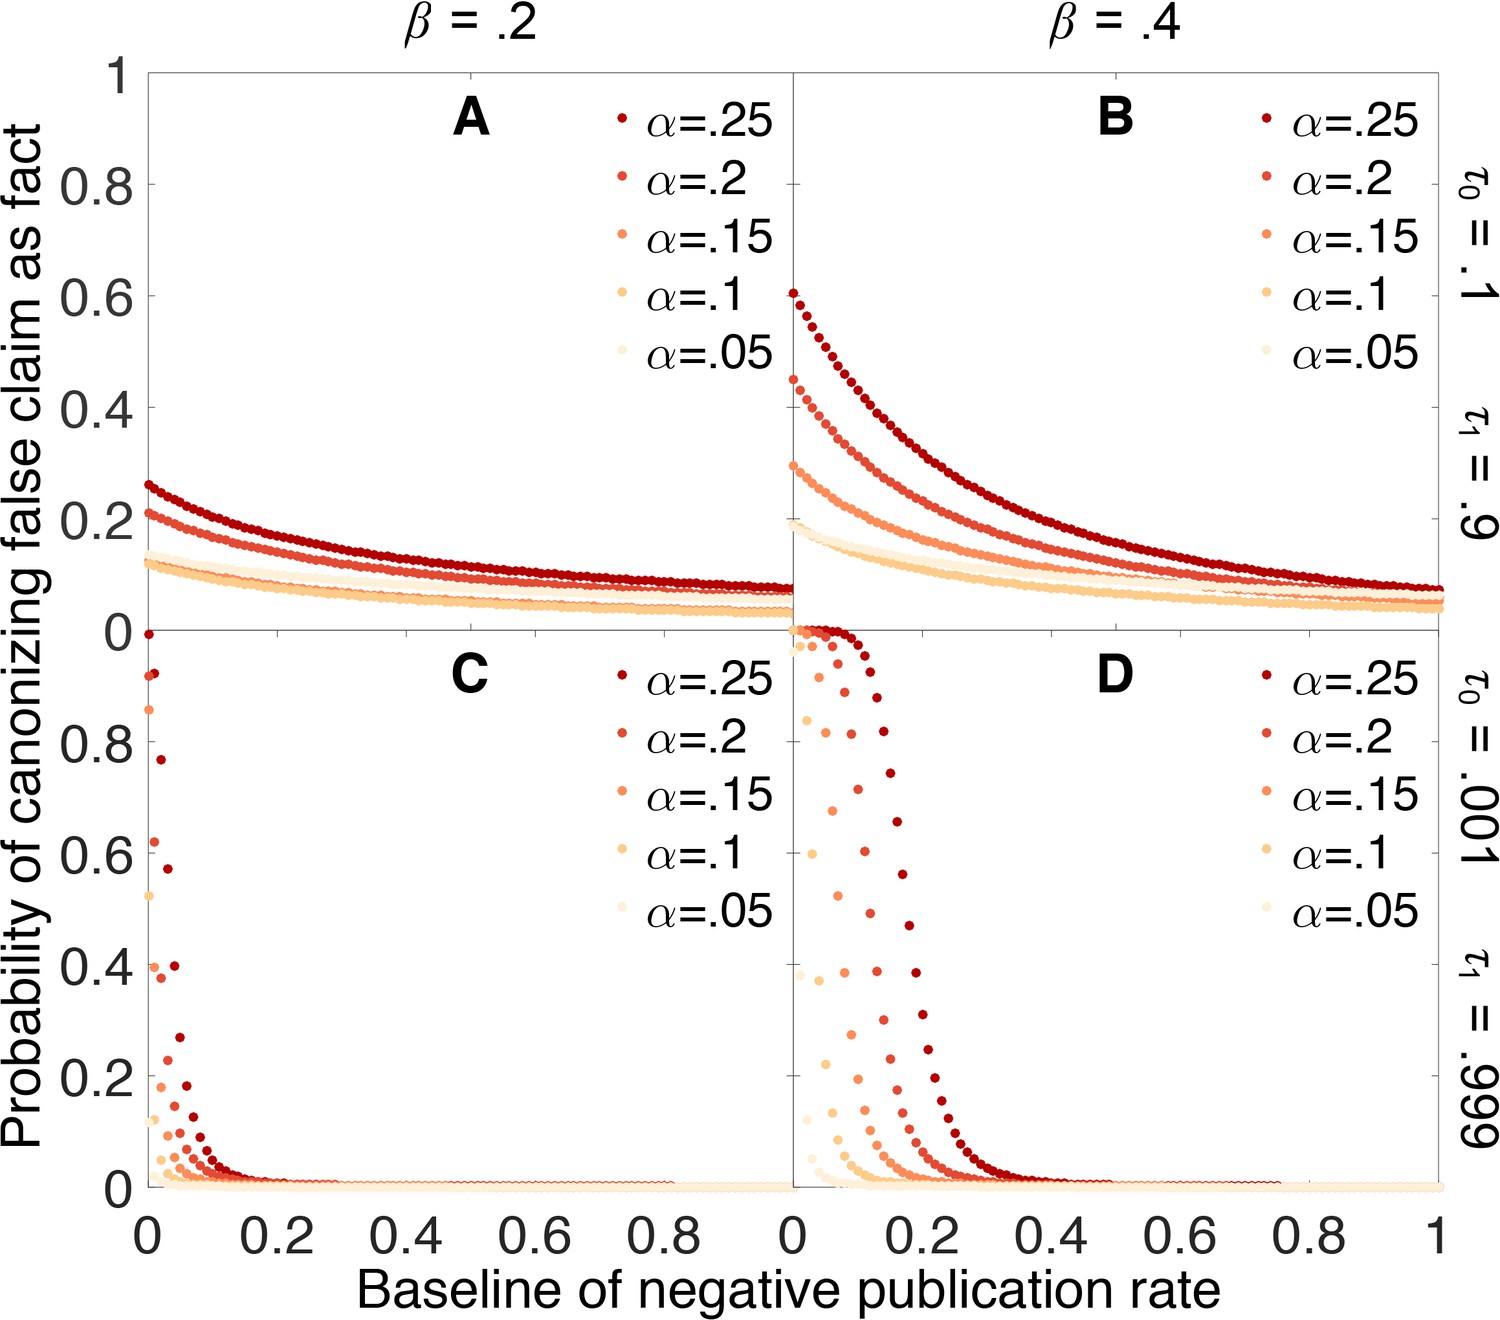
Publishing a larger fraction of negative outcomes as belief increases lessens the chances of canonizing false claims.
Probability that a false claim is mistakenly canonized as a true fact vs. baseline probability of publishing a negative outcome. The baseline probability of publishing a negative outcome is the probability that prevails when belief in the claim is weak. The actual probability of publishing a negative outcome increases linearly from the baseline rate when belief is 0 to a value of 1 when belief is 1. All other parameters are the same as in Figure 4.
Download links
A two-part list of links to download the article, or parts of the article, in various formats.
Downloads (link to download the article as PDF)
Open citations (links to open the citations from this article in various online reference manager services)
Cite this article (links to download the citations from this article in formats compatible with various reference manager tools)
Research: Publication bias and the canonization of false facts
eLife 5:e21451.
https://doi.org/10.7554/eLife.21451


