Transcriptome analysis illuminates the nature of the intracellular interaction in a vertebrate-algal symbiosis
- American Museum of Natural History, United States
- Gettysburg College, United States
Figures
Figure 1 with 5 supplements
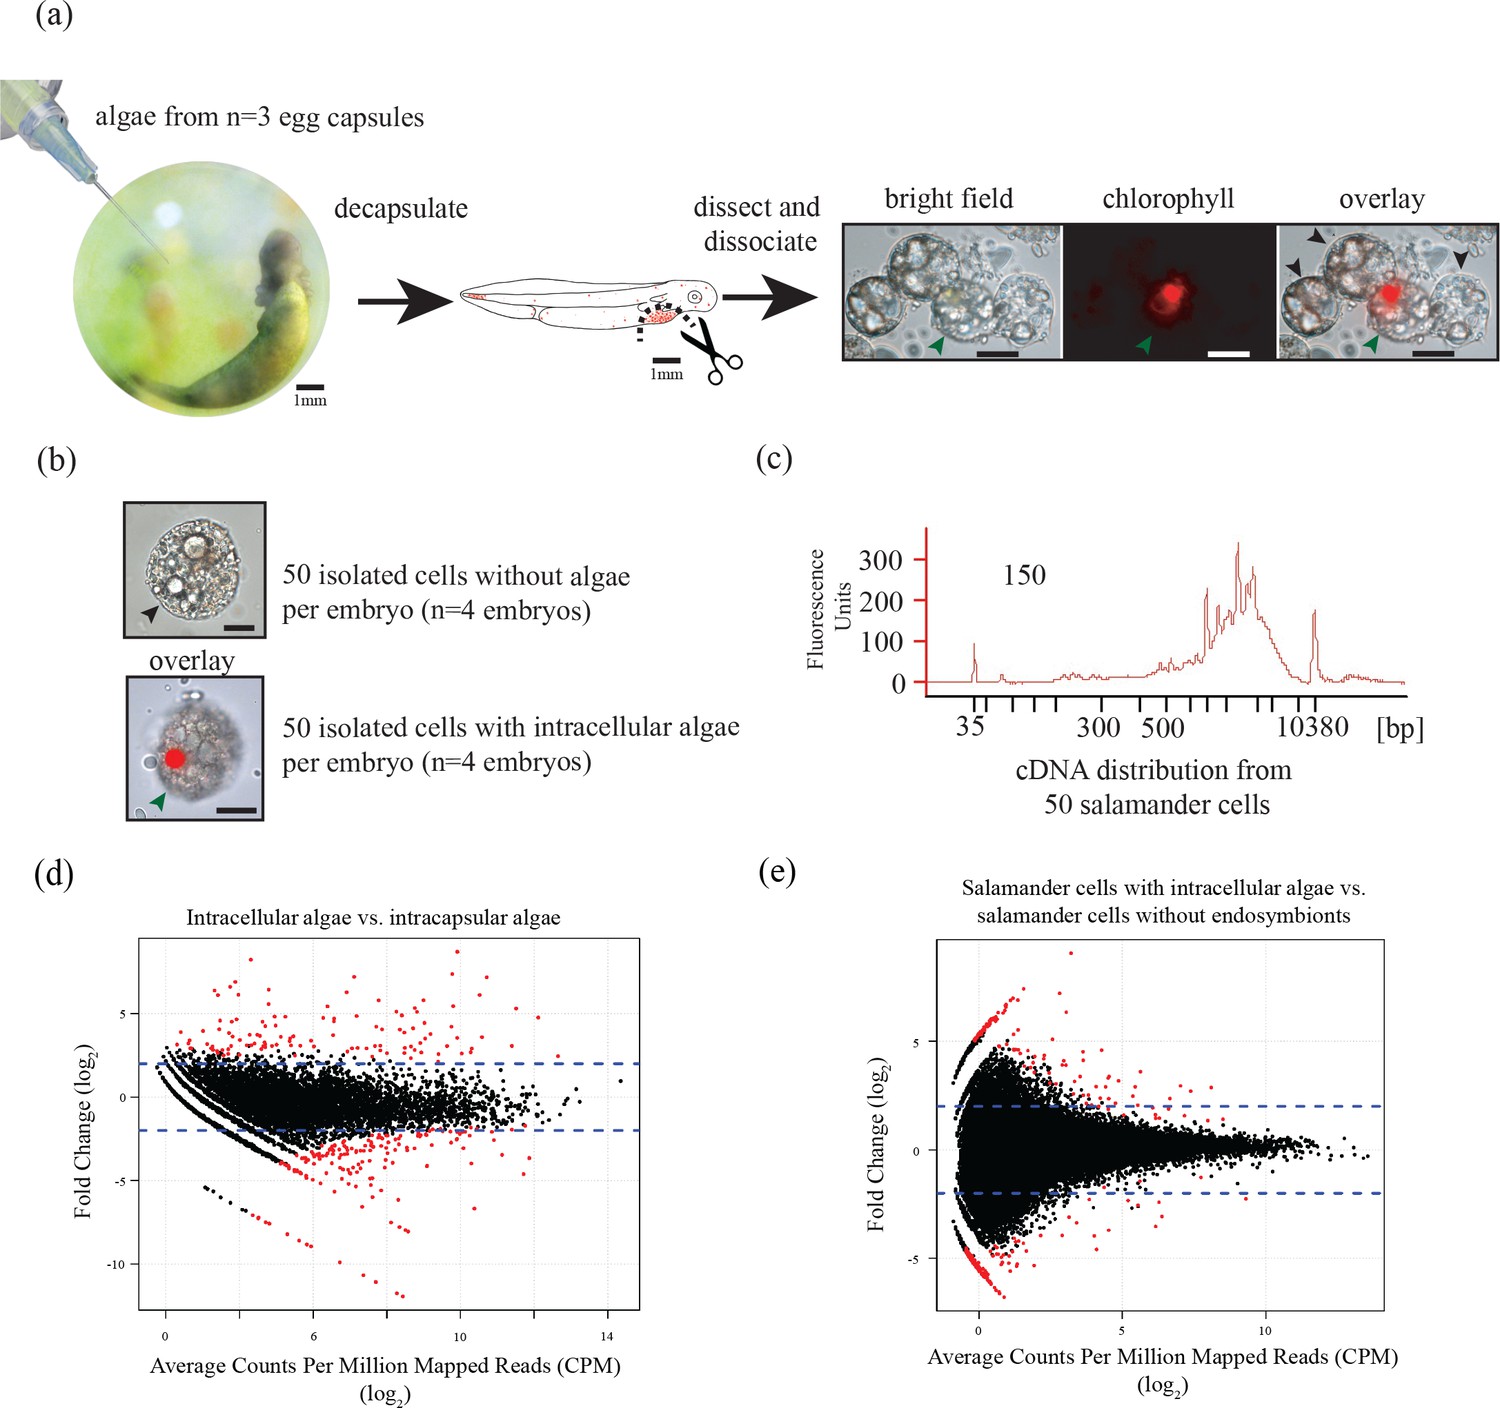
Three populations of cells from A. maculatum egg capsules containing stage 39 embryos were collected and prepared for mRNA extraction, cDNA sequencing, and differential expression analysis revealing several hundred significantly differentially expressed genes detected for the salamander and alga.
(a) Intracapsular algae (Population 1) were removed from intact eggs using a syringe and hypodermic needle (photo credit: Roger Hangarter). Embryos were decapsulated and washed, and the liver diverticulum region (dashed line), containing high concentrations of algae (red dots), was isolated and dissociated into a single cell suspension (illustration adapted from Harrison, 1969). The dissociated cells were screened for A. maculatum endoderm cells without alga (black arrowheads) and endoderm cells with intracellular alga (green arrowhead). Scale bars on microscope images are 20 µm. (b) Isolated endoderm cell, and isolated endoderm cell with intracellular alga. Scale bars on microscope images are 20 µm. (c) Representative cDNA distribution (bioanalyzer trace) from a population of 50 manually isolated A. maculatum endoderm cells. Peaks at 35 bp and 10380 bp are markers. Due to evidence of lysed A. maculatum cells observed in the cell suspension fluid after dissociation of A. maculatum embryos (debris seen in dissociated A. maculatum microscope images in (a) and (b)), that fluid was tested for the presence of contaminating mRNA. mRNA was not detected in the surrounding fluid, Figure 1—figure supplement 1. Lower limit abundance thresholds (Figure 1—figure supplement 2), and correction for low sequencing depth in intracelluar algal samples (Figure 1—figure supplement 3) were implemented to obtain the final gene sets used for differential expression analysis. Depth of sequencing was not biased for A. maculatum cell with and without alga samples (Figure 1—figure supplement 4). Library preparation GC bias affected the completeness of the algal transcriptome obtained from intracapsular and intracellular O. amblystomatis (Figure 1—figure supplement 5). (d and e) Dotplots of log2 fold change vs. expression level. The blue horizontal lines are plus and minus 4-fold change in expression between samples. The red dots are genes with FDR adjusted p-values<0.05, indicating a significant difference in expression level between conditions. (d) Differentially expressed algal transcripts. (e) Differentially expressed salamander transcripts.
-
Figure 1—source data 1
Raw counts matrix with counts for all reads mapped to the total evidence assembly (the assembly of all salamander and algal reads from wild-collected samples).
The data in this file (after filtering and normalization) was used to generate the dotplots in Figure 1D and E, Figure 1—figure supplements 2–4, and Figure 3. This is the raw data that was used for differential expression analysis. Rows are genes. Column names are as follows: S2a-S5a are counts for salamander cells without algae. S2b-S5b are counts for salamander cells with intracellular algae (samples are paired from the same individuals, such that S2a and S2b came from the same salamander). A1-A3 are intracapsular algae samples. RK_* are cultured algal samples.
- https://doi.org/10.7554/eLife.22054.004
-
Figure 1—source data 2
List of 6,726 algal gene IDs used in differential expression analysis.
Use to filter raw counts matrix to get final algal gene list.
- https://doi.org/10.7554/eLife.22054.005
-
Figure 1—source data 3
List of 46,549 salamander gene IDs used in differential expression analysis.
Use to filter raw counts matrix to get final salamander gene list.
- https://doi.org/10.7554/eLife.22054.006
Figure 1—figure supplement 1
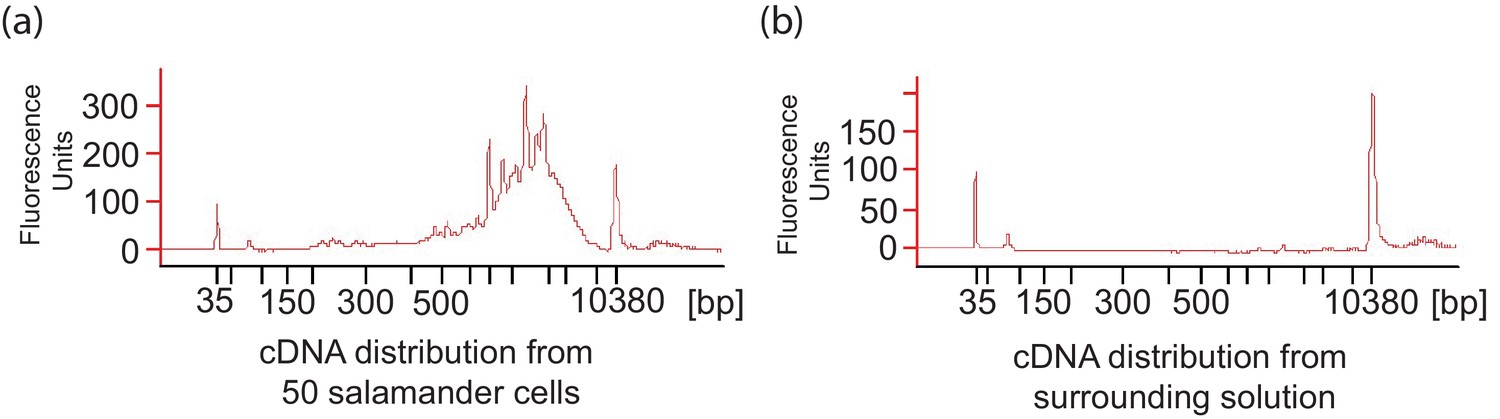
A. maculatum cell lysis during embryo dissociation did not contaminate the cell suspension fluid with significant quantities of mRNA.
(a) Representative cDNA distribution (bioanalyzer trace) from a population of 50 manually isolated A. maculatum endoderm cells. (b) No cDNA was produced when the fluid the cells were suspended in was tested indicating that the cDNA populations from manually isolated A. maculatum endoderm cells was specific and not contaminated with cDNAs derived from randomly lysed cells. In both (a) and (b), the peaks at 35 bp and 10380 bp are markers.
Figure 1—figure supplement 2
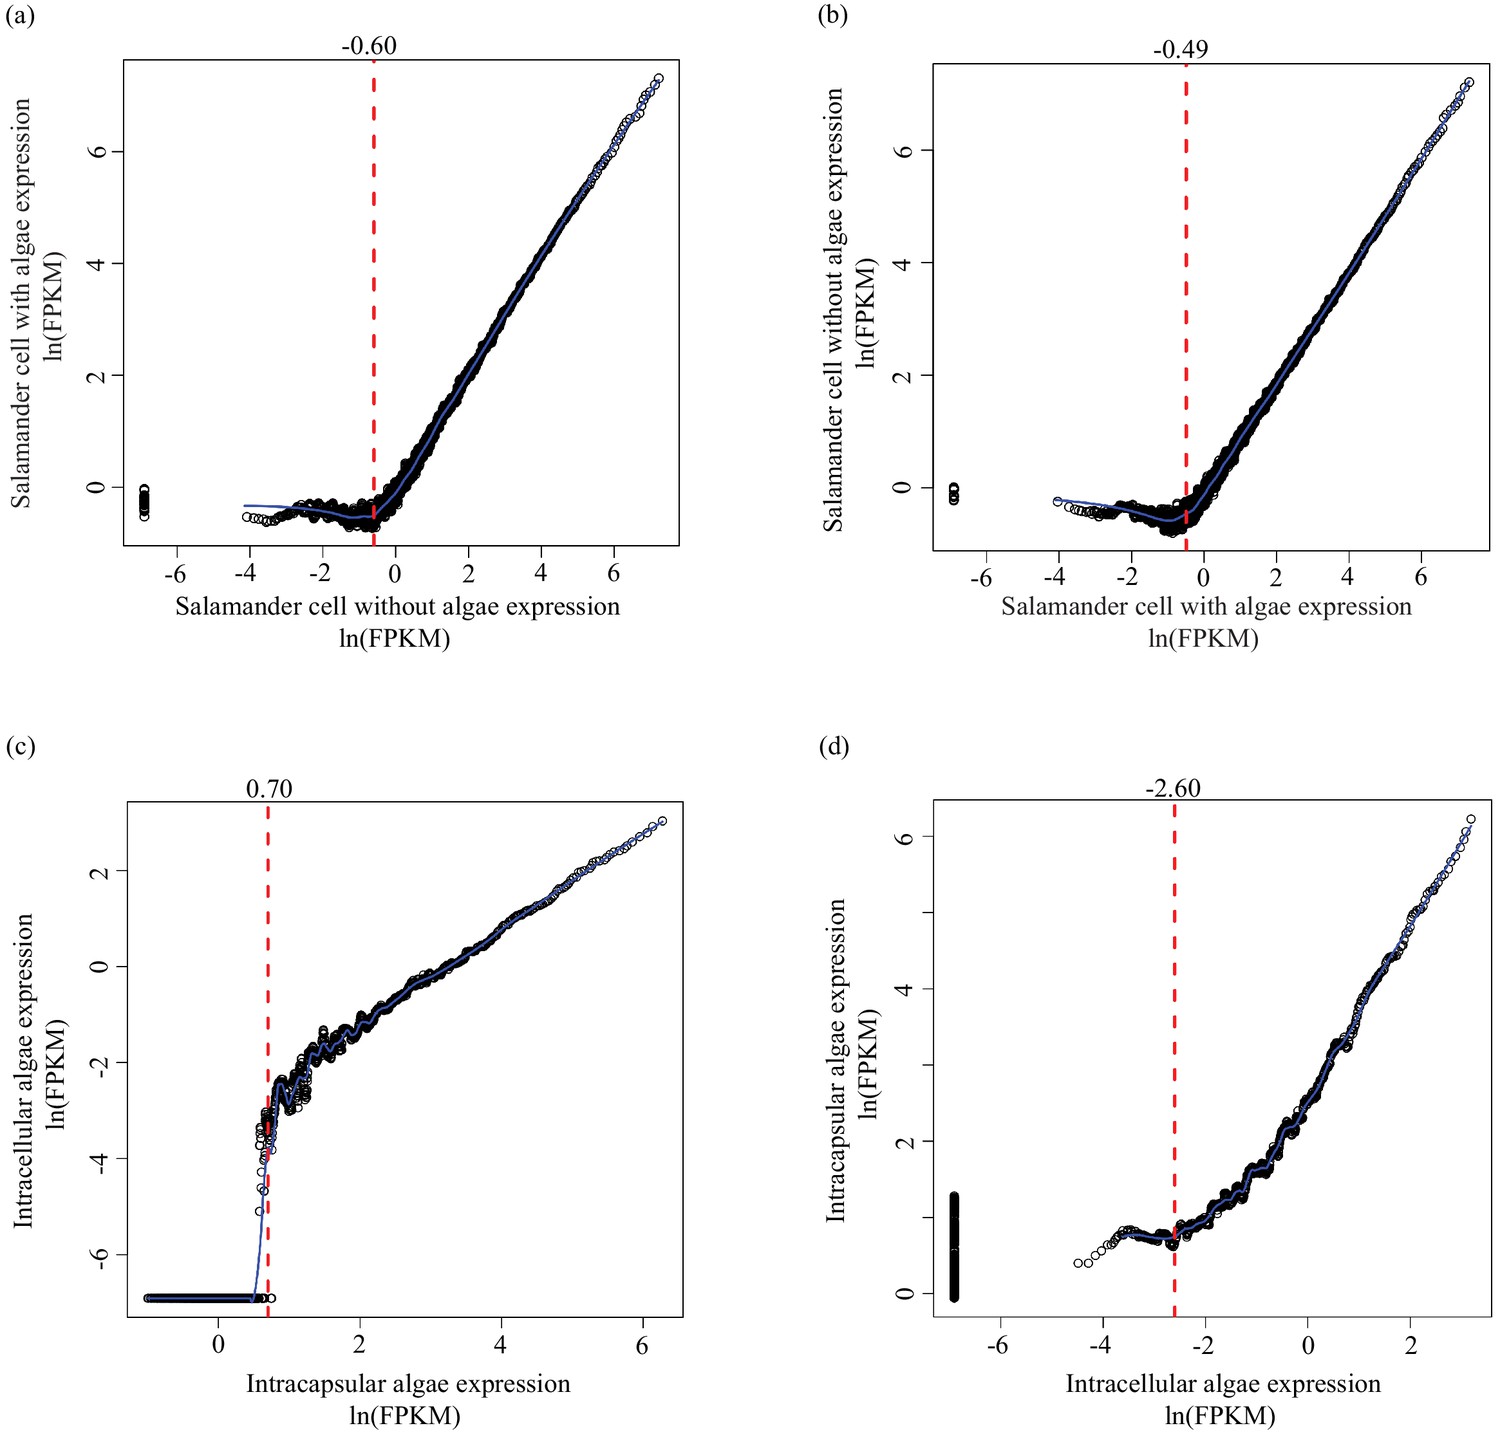
Determining lower limit FPKM thresholds for inclusion in differential expression analysis.
For pairs of experimental conditions (i.e. n = 4 A. maculatum samples without intracellular algae, and n = 4 A. maculatum samples with intracellular algae), gene expression levels were sorted by the mean FPKM value (expression level) in one set of samples (i.e. in (a) expression levels of A. maculatum genes from samples with and without intracellular algae were sorted by mean expression per gene for n = 4 A. maculatum samples without intracellular algae). Using a sliding window of 100 genes, starting with the 100 most lowly expressed genes of the sorted set, median expression levels of the 100 gene bins were calculated for both experimental conditions. Those binned values were plotted with the expectation that on average, gene expression from one experimental condition should be positively correlated with gene expression from the other experimental condition. Vertical red dashed lines indicate the level of expression along the x-axis (in the sorted sample, determined by visual inspection of the plots) where positively correlated expression between the experimental conditions begins. Those values were used as lower limit thresholds in data pre-filtering steps. (a) Salamander cells with endosymbionts vs. salamander cells without endosymbionts; sorted by salamander cells without endosymbionts expression levels. (b) Salamander cells without endosymbionts vs. salamander cells with endosymbionts; sorted by salamander cells with endosymbionts expression levels. (c) Intracellular algae vs. intracapsular algae; sorted by intracapsular algae expression levels. (d) Intracapsular algae vs. intracellular algae; sorted by intracellular algae expression levels.
Figure 1—figure supplement 3
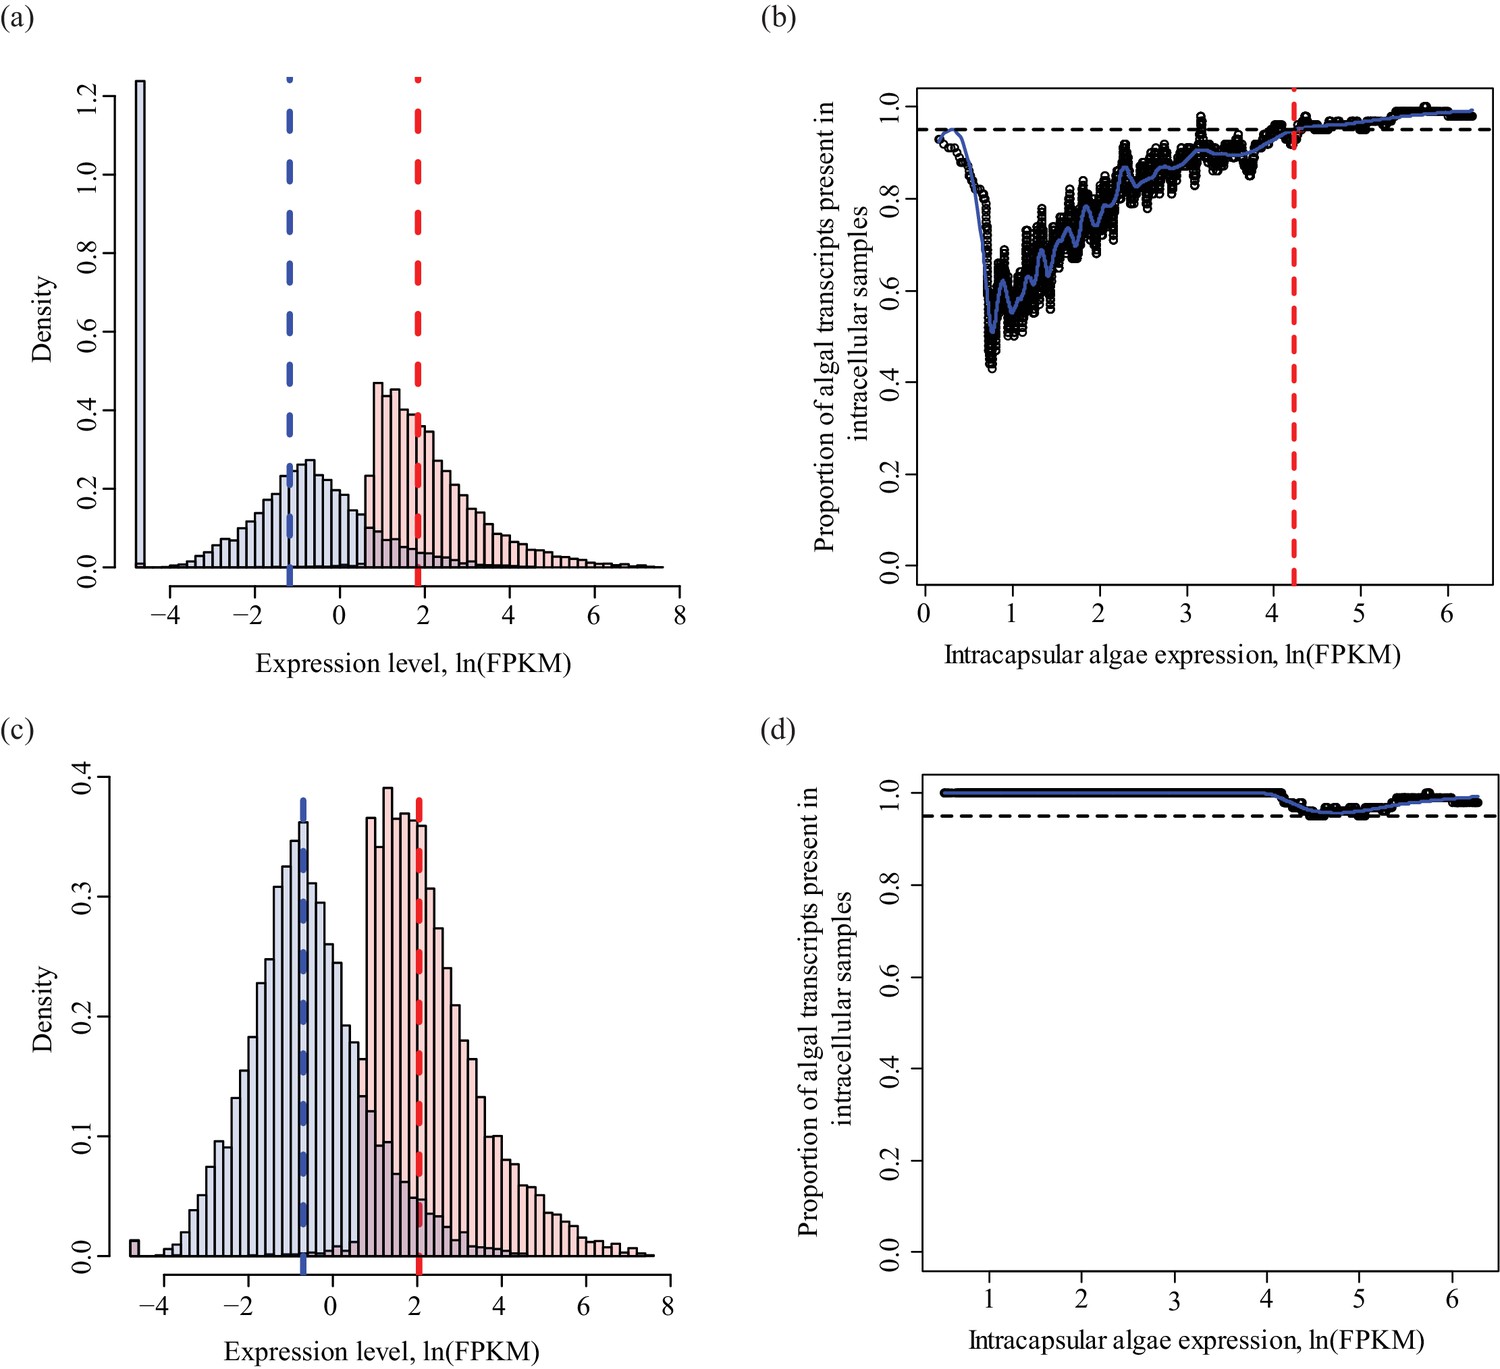
Determining a threshold for absence calls in intracellular algal data.
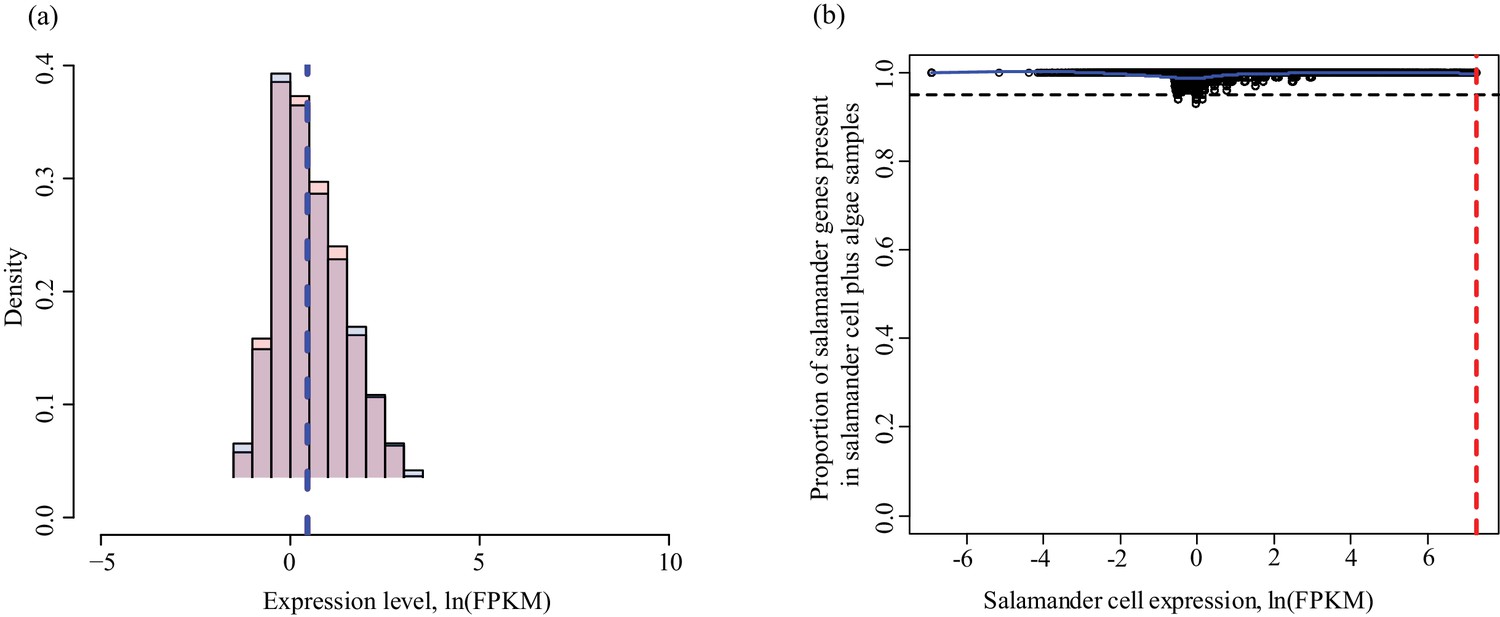
Intracapsular algae samples had a higher sequencing depth than the intracellular algae. This filtering determined the lower FPKM limit of expression in intracapsular algae for inclusion in differential expression analysis. (a) Algal gene expression levels in intracapsular (red) and intracellular (blue) algae. The vertical dashed lines represent the median expression level of the respective populations. The large blue bar at −5 ln(FPKM) is the overrepresented proportion of genes with no expression in intracellular algal samples due to the low depth of sequencing. (b) Genes with low levels of intracapsular algal expression are detected in 100% of the intracellular algal samples due to pre-filtering inclusion of genes that were detected in all four intracellular algal samples. However, as the expression level of genes in intracapsular algal samples increases, the proportion of genes detected in intracellular algae decreases sharply with a minimum of 40%. Following this minimum, the proportion of genes detected in intracellular samples increase proportionally with the intracapsular expression. The red dashed vertical line is the FPKM value in intracapsular algae where 95% or more of the intracellular genes are detected. Below this threshold, a gene’s absence in intracellular genes is possibly due to the low sequencing depth, above this threshold, a gene’s absence in intracellular algae is interpreted as potential under-expression. (c) The same plot as in (a), after filtering to remove genes absent in intracellular algae with expression levels in intracapsular algae below threshold. (d) The same plot as in (b), after the dependence of detection on expression level was removed.
Figure 1—figure supplement 4
Determining threshold for absence calls in salamander data.
The algal filtering described in Figure 1—figure supplement 3 was not required for salamander transcripts. (a) Salamander gene expression levels in salamander cells without algae (red) and salamander cells with algal endosymbionts (blue). Data is plotted on a natural log scale. The vertical dashed lines represent the median expression level of the respective populations (overlapping in this case). (b) The proportion of salamander mRNA’s detected in alga-containing cells does not depend on the mRNA expression level in salamander cells without algae. Greater than 95% of all genes are detected in salamander cells plus algal samples for all values of expression in salamander cells without alga samples.
Figure 1—figure supplement 5
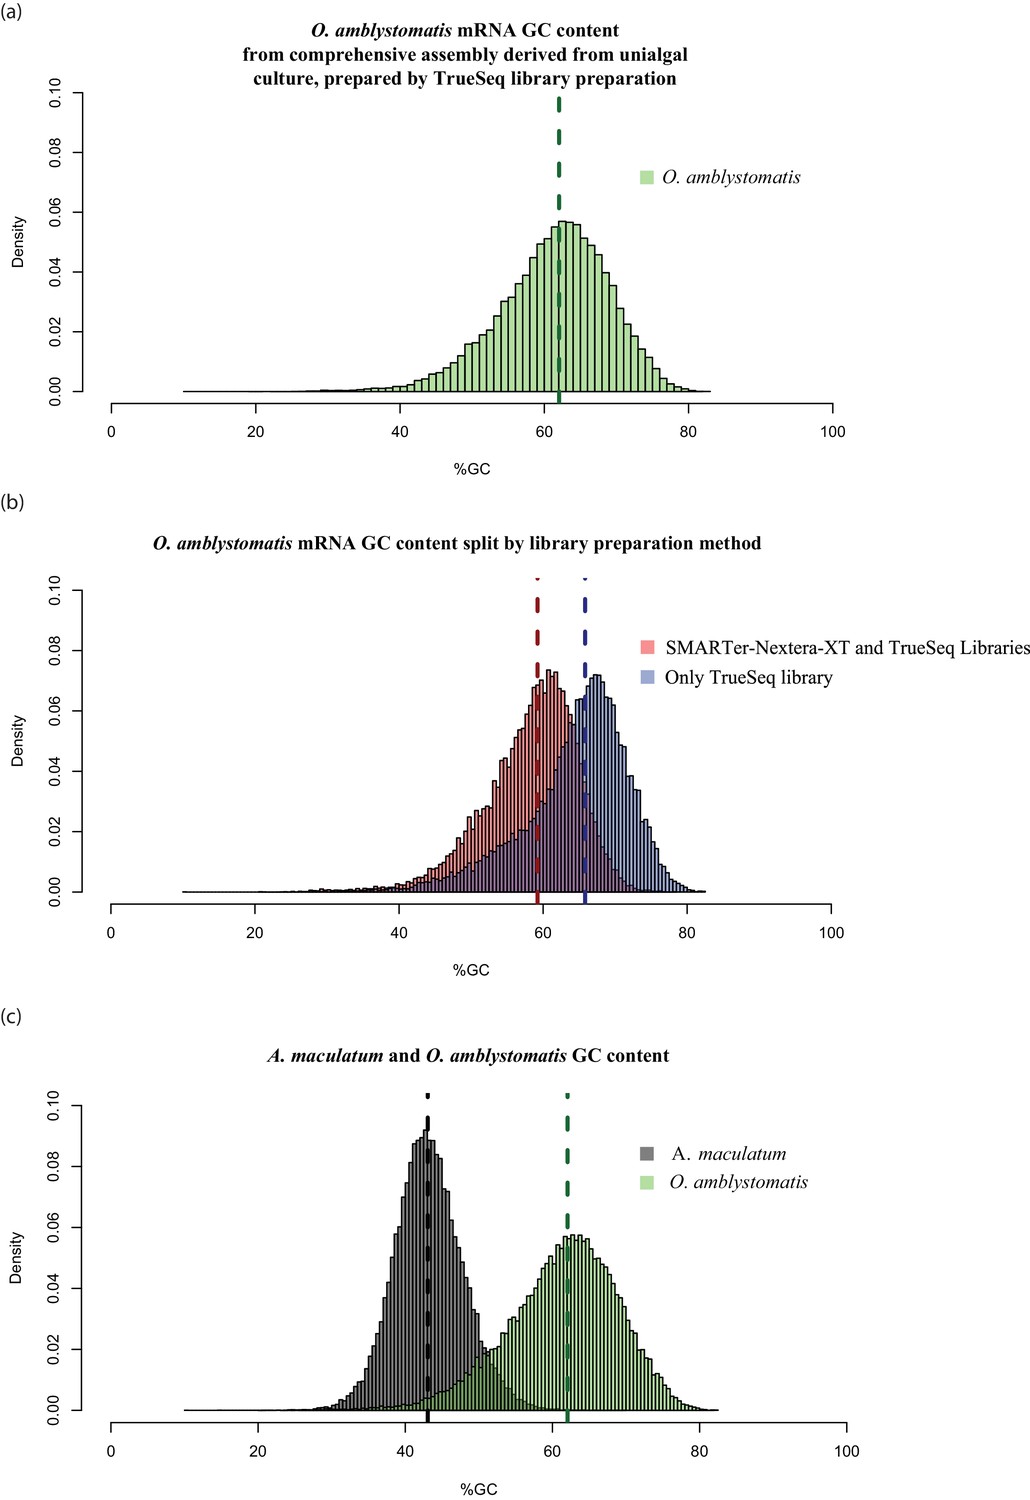
High GC content algal genes were not detected by the combination of SMARTer cDNA synthesis and Nextera-XT library preparation.
(a) The GC content distribution of algal transcripts generated using TrueSeq library preparation of total RNA, sequenced on the MySeq platform with approximately 30 million 75 bp paired end reads. 79% of eukaryote BUSCOs were detected in this assembly. The median GC content (green dashed line) is 62%. (b) The GC content distribution from (a), split by library preparation method. Red bars represent algal transcripts found in transcriptomes generated by both library preparation methods (SMARTer-Netxtera-XT and TruSeq). Blue bars represent transcripts found only in the transcriptome assembly from the TrueSeq library preparation method, that are absent from the transcriptome generated using the SMARTer cDNA synthesis-Nextera-XT library preparation method. There is an apparent bias against high GC content algal transcripts in library prepared using the SMARTer cDNA synthesis-Nextera-XT protocol (Kolgomorov-Smirnov test, p<2.2 × 10⁻¹⁶). Both libraries were sequenced to a similar depth of approximately 30 million reads for the alga-only samples in the total-evidence assembly from the SMARTer-cDNA synthesis-Nextera-XT library and 30 million reads for the TrueSeq library from unialgal cultures. Since sequencing depth was equivalent and GC bias is apparent, the data suggests that GC bias in the SMARTer-cDNA synthesis-Nextera-XT library is what accounts for the low number of detected BUSCOs (49%) in the algal transcriptome generated from wild-collected algal samples associated with salamander eggs and cells. (C.) The distribution of GC content in A. maculatum transcripts (gray bars) is centered around much lower GC content transcripts (median GC content of 43%) compared to that of O. amblystomatis (green bars, median GC content of 62%). The A. maculatum assembly contained 88% of eukaryote BUSCOs. Our evidence points to bias against high GC content transcripts in the SMARTer cDNA synthesis and Nextera-XT library prep method, that becomes significant above 60% GC content. Transcripts with GC content of 60% or greater are in the tail of the salamander GC content distribution, but near the median of the algal GC content distribution. This offers an explanation for the BUSCO results, where the salamander transcriptome from the wild-collected samples is comprehensive, while the algal transcriptome from the same samples and library prep methods is missing around 40% of the algal transcriptome.
Figure 2
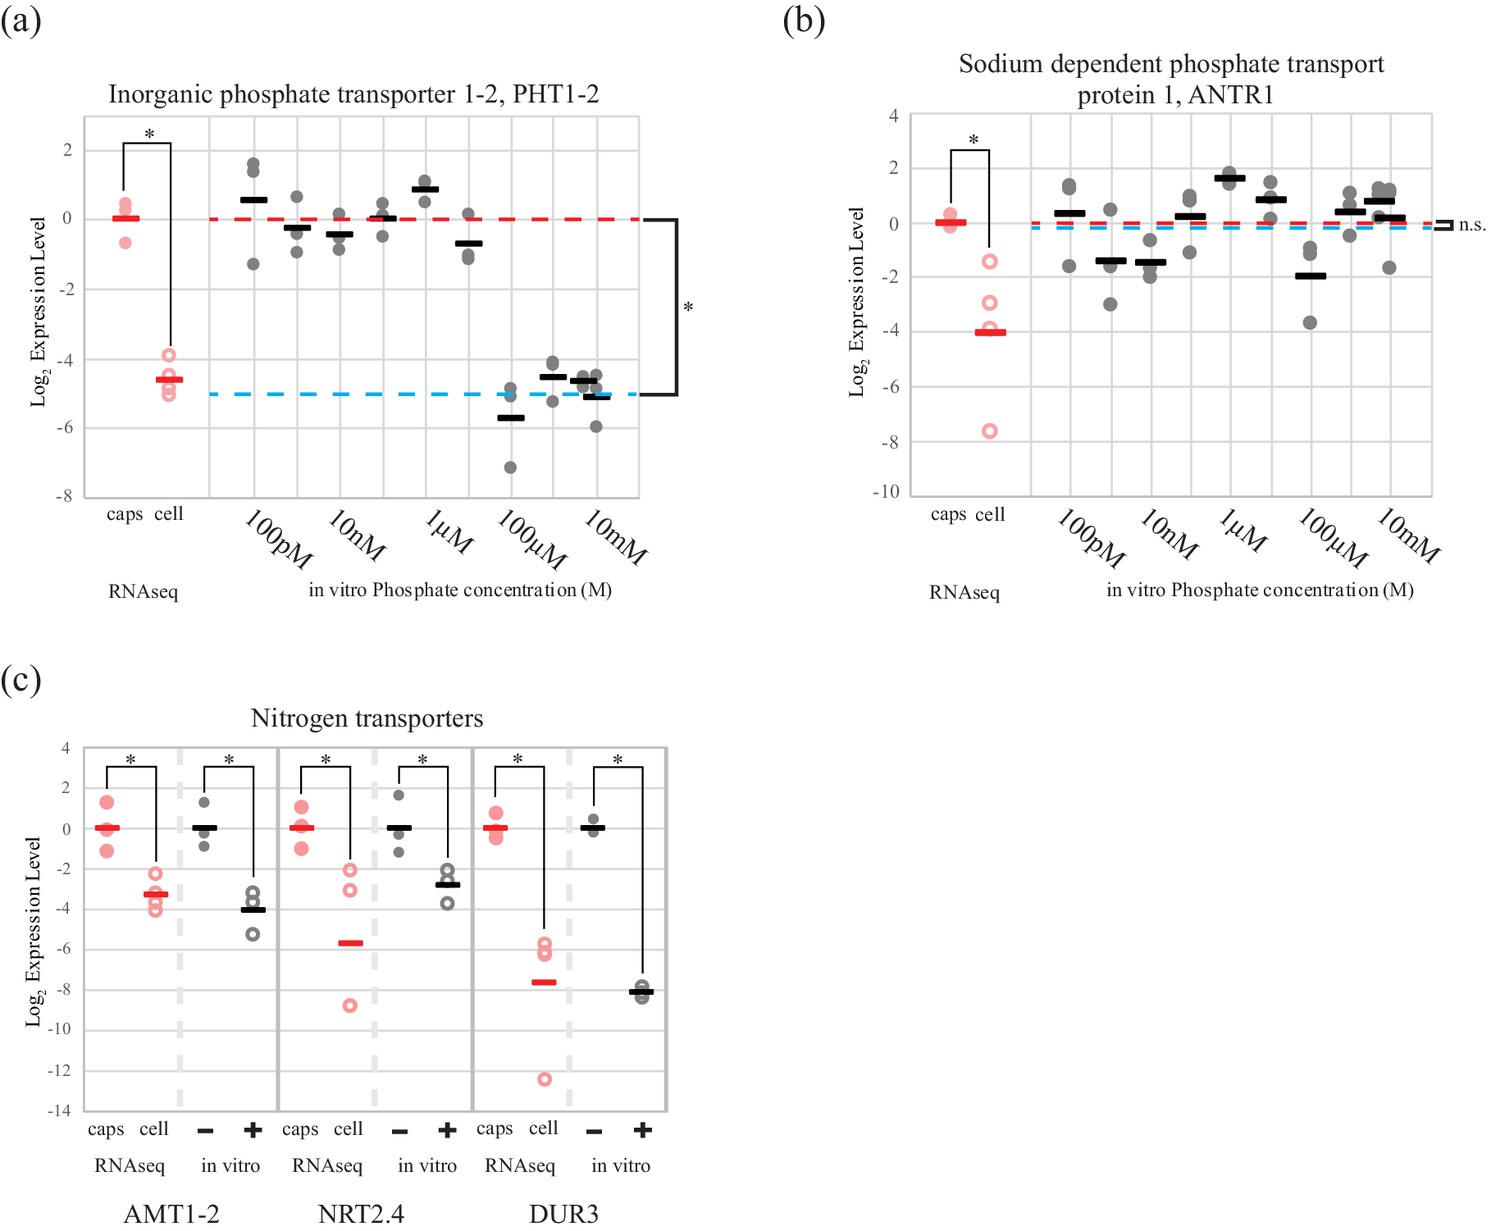
An algal phosphate transporter is modulated by inorganic phosphate levels, while nitrogen source transporters are modulated by an organic nitrogen source, glutamine.
Normalized measurements from RNAseq data are provided for direct visual comparison of effect sizes in intracellular algae compared to in vitro experiments. Intracapsular alga measurements are ‘caps’ (filled red circles); intracellular alga measurements are ‘cell’ (empty red circles). (a) Expression of high affinity phosphate transporter PhT1-2 mRNA across a range of phosphate concentrations. (b) Expression of chloroplast sodium dependent phosphate transporter ANTR1 mRNA across a range of phosphate concentrations. In (a) and (b) The red dashed line indicates the average expression of the phosphate transporter in the low phosphate range (100 pM to 1 µM); the blue dashed line indicates the average expression in the high phosphate range (10 µM to 10 mM). (c) Expression of three algal nitrogen transporters in the absence (-) and presence (+) of 2 mM L-glutamine. Data is plotted on a log2 scale on the y axis, where more negative values indicate lower expression levels. Circles are individual replicates; bars are the average for each experiment. *p<0.05; n.s. indicates no significant difference; the statistical test performed was an ANOVA with contrasts.
-
Figure 2—source data 1
Normalized expression levels of algal phosphate transporters.
- https://doi.org/10.7554/eLife.22054.017
-
Figure 2—source data 2
Normalized expression levels of algal nitrogen transporters.
- https://doi.org/10.7554/eLife.22054.018
Figure 3 with 2 supplements
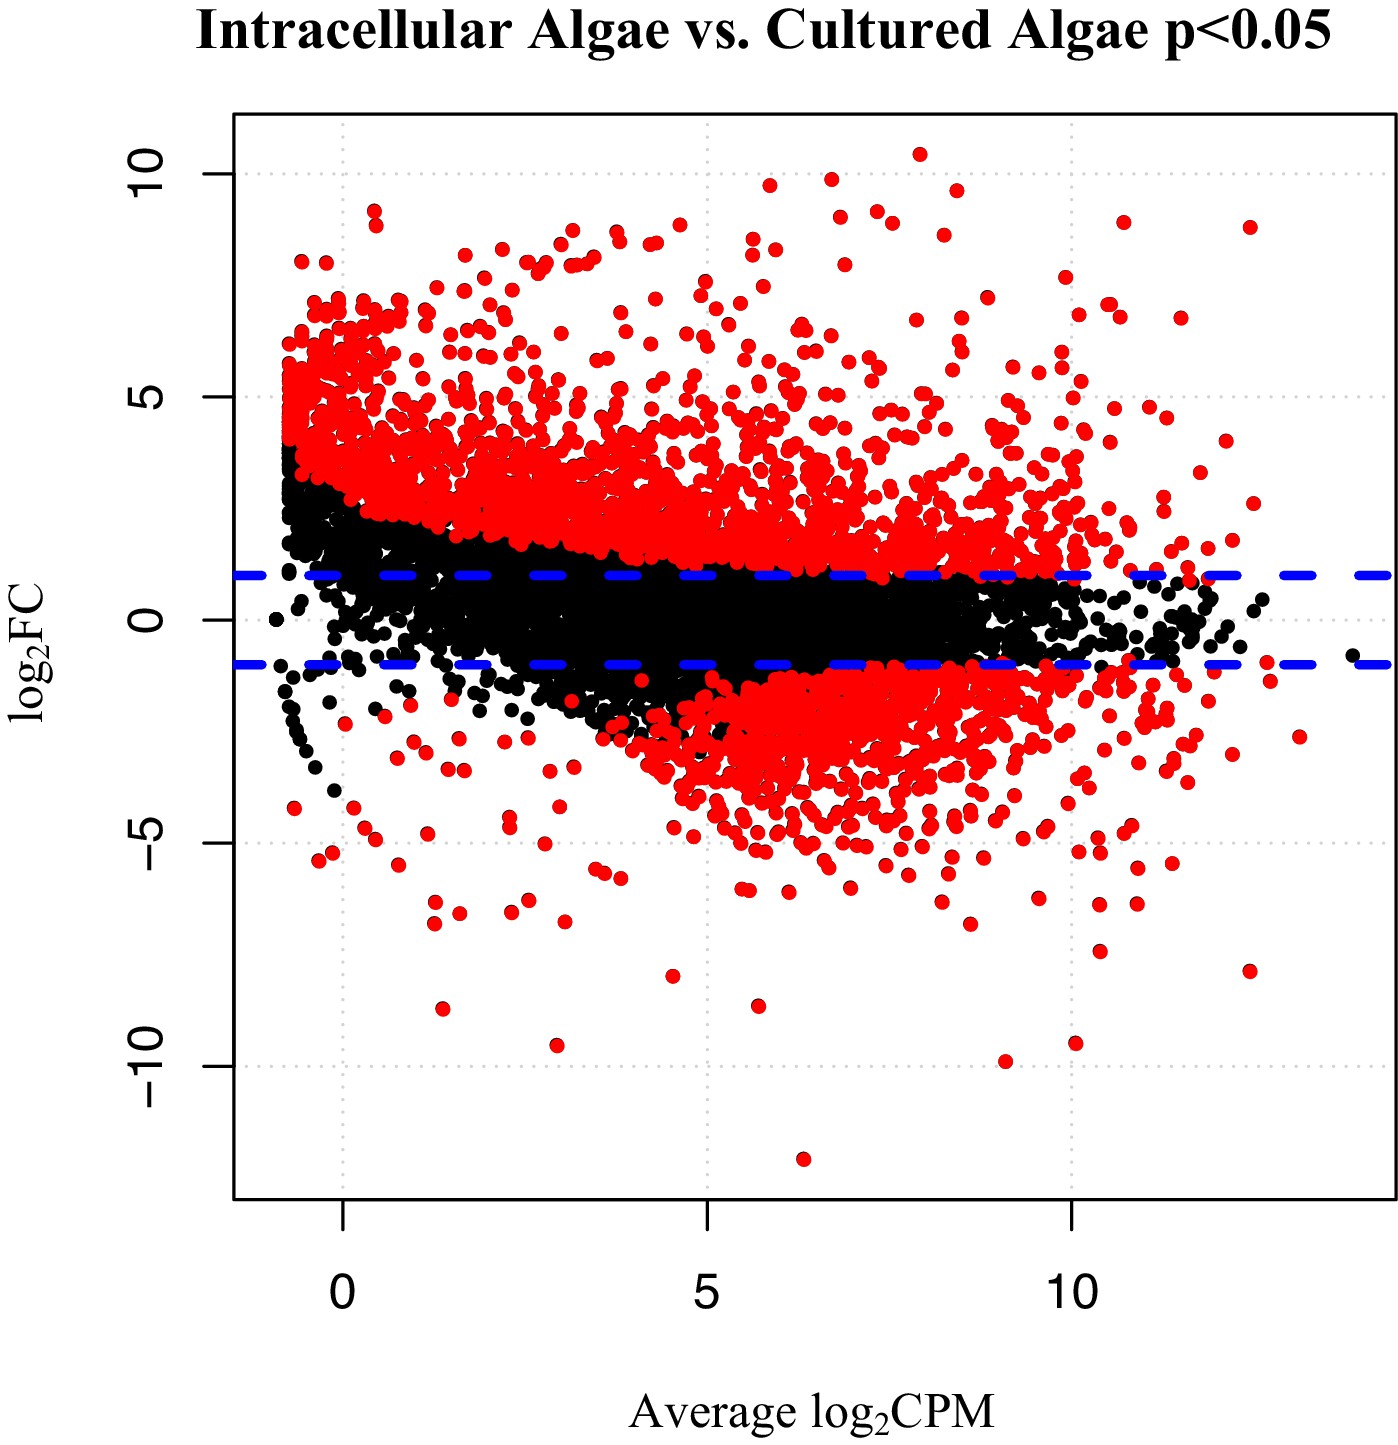
Differentially expressed genes between intracellular algae and cultured algae.
Red dots indicate significantly differentially expressed genes (FDR < 0.05). Blue dashed lines represent a plus and minus 2-fold difference in expression. There are 1,805 over-expressed genes in intracellular algae and 802 under-expressed genes in intracellular algae in this comparison.
-
Figure 3—source data 1
GC content and length of algal genes.
Use as input for normalizing algal count data based on GC content and gene length for algal libraries prepared by different methods.
- https://doi.org/10.7554/eLife.22054.020
Figure 3—figure supplement 1
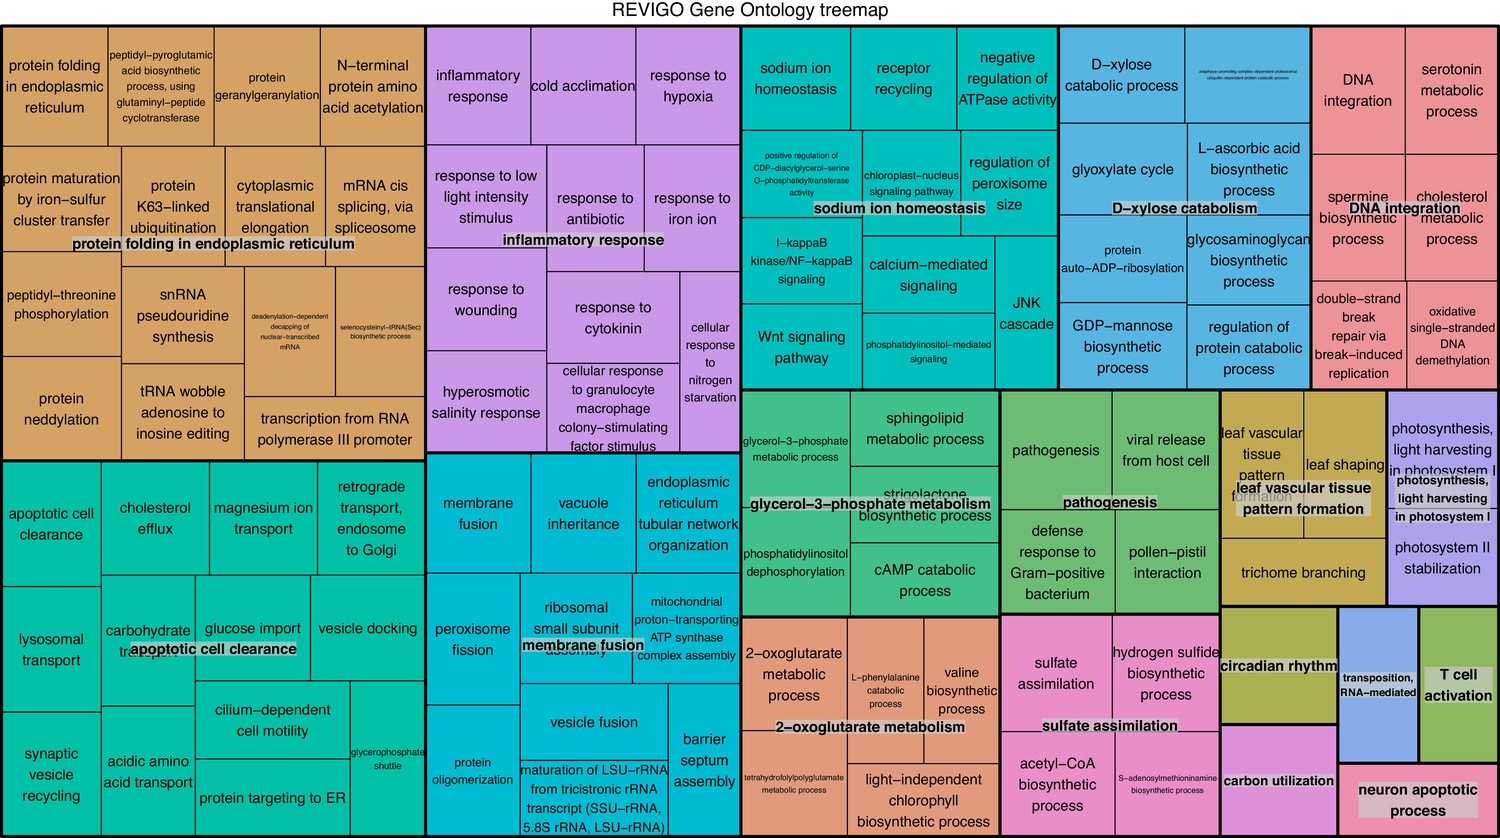
REViGO anlysis of GO terms associated with 1805 over-expressed genes in intracellular algae compared to cultured algae.
This analysis shows enrichment in fermentation processes such as glycerol-3 phosphate metabolism, 2-oxoglutarate metabolism, the glyoxylate cycle, photosystem II stability, photosystem I, and sulfur assimilation, all of which are consistent with the hypothesis that the intracellular algae are fermenting. Processes such as protein folding, apoptotic cell clearance, and sodium ion homeostasis support the hypothesis that the intracellular algae are stressed.
Figure 3—figure supplement 2
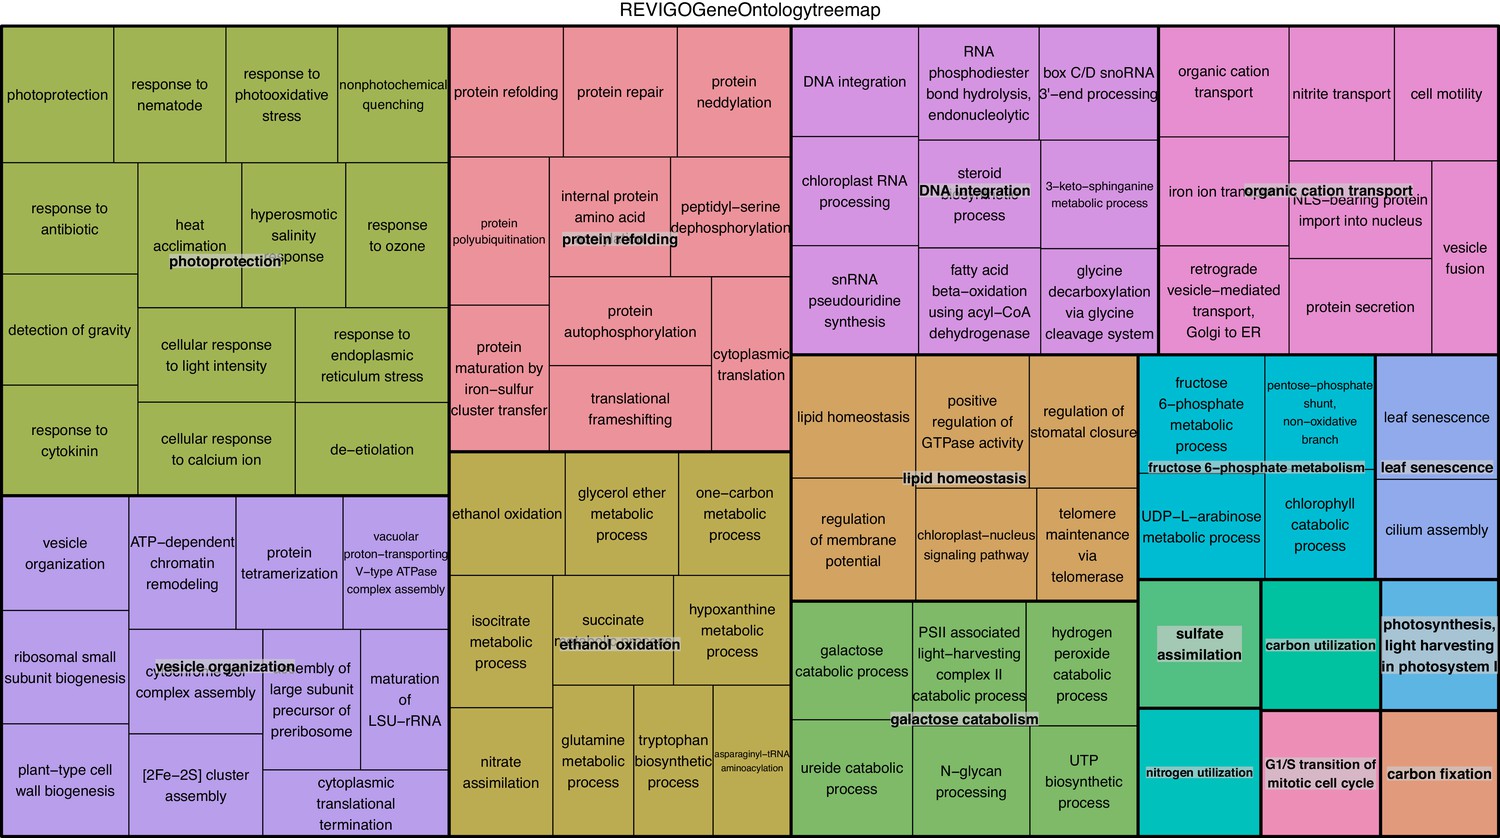
REViGO anlysis of 882 under-expressed genes in intracellular algae compared to cultured algae.
Under-expressed processes involved in oxidative pathways, photoprotection, and protein refolding are further evidence of an intracellular algal stress response.
Figure 4
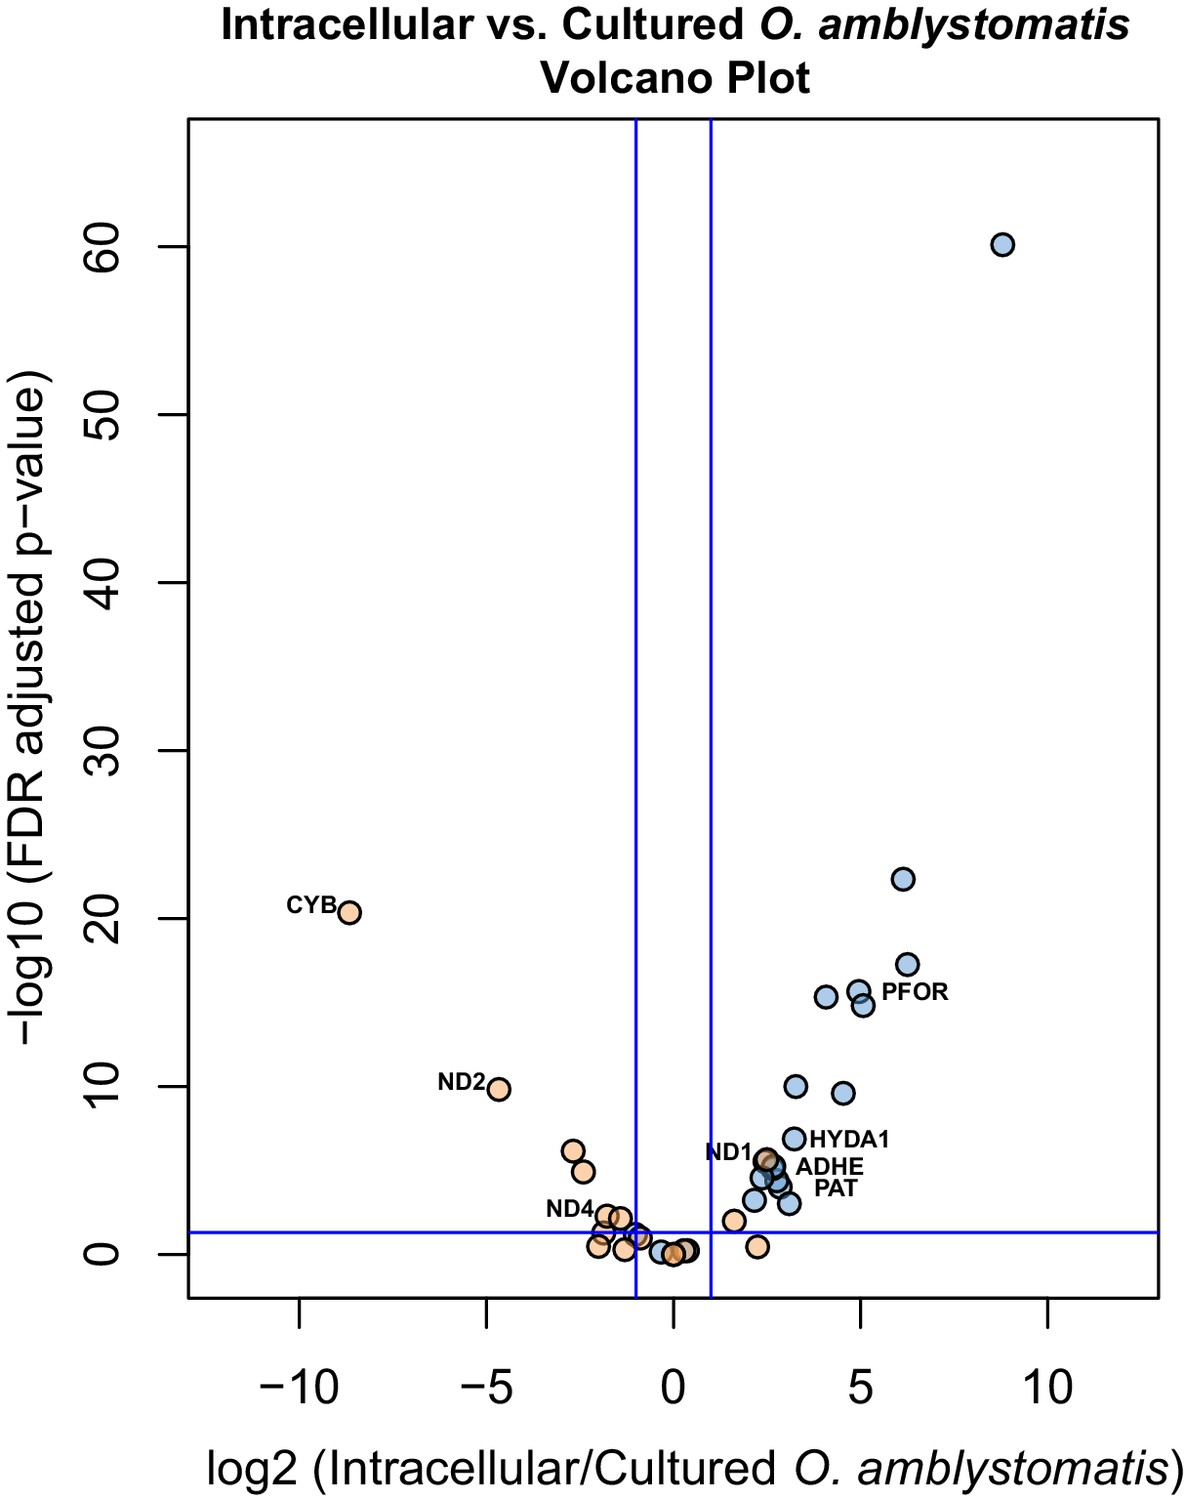
Differential expression of fermentation genes in intracellular algae compared to cultured algae.
Blue dots are genes that were over-expressed in intracellular algae compared to intracapsular algae. Orange dots are genes that were under-expressed in intracellular algae compared to intracapsular algae. Vertical blue lines represent plus and minus two-fold fold change. The horizontal blue line represents FDR adjusted p-value equal to 0.05. Genes above the horizontal blue line are significantly differentially expressed; genes below the blue line are not. Key fermentation genes, PFOR, HYDA1, ADHE, and PAT are significantly over-expressed in intracellular algae compared to cultured algae, in the same manner as they are over-expressed in intracellular algae compared to intracapsular algae. Several components of complex I of the electron transport chain in the mitochondrion are also significantly under-expressed (CYB, ND2, ND4), though ND1 is over-expressed in intracellular algae compared to cultured algae.
Figure 5
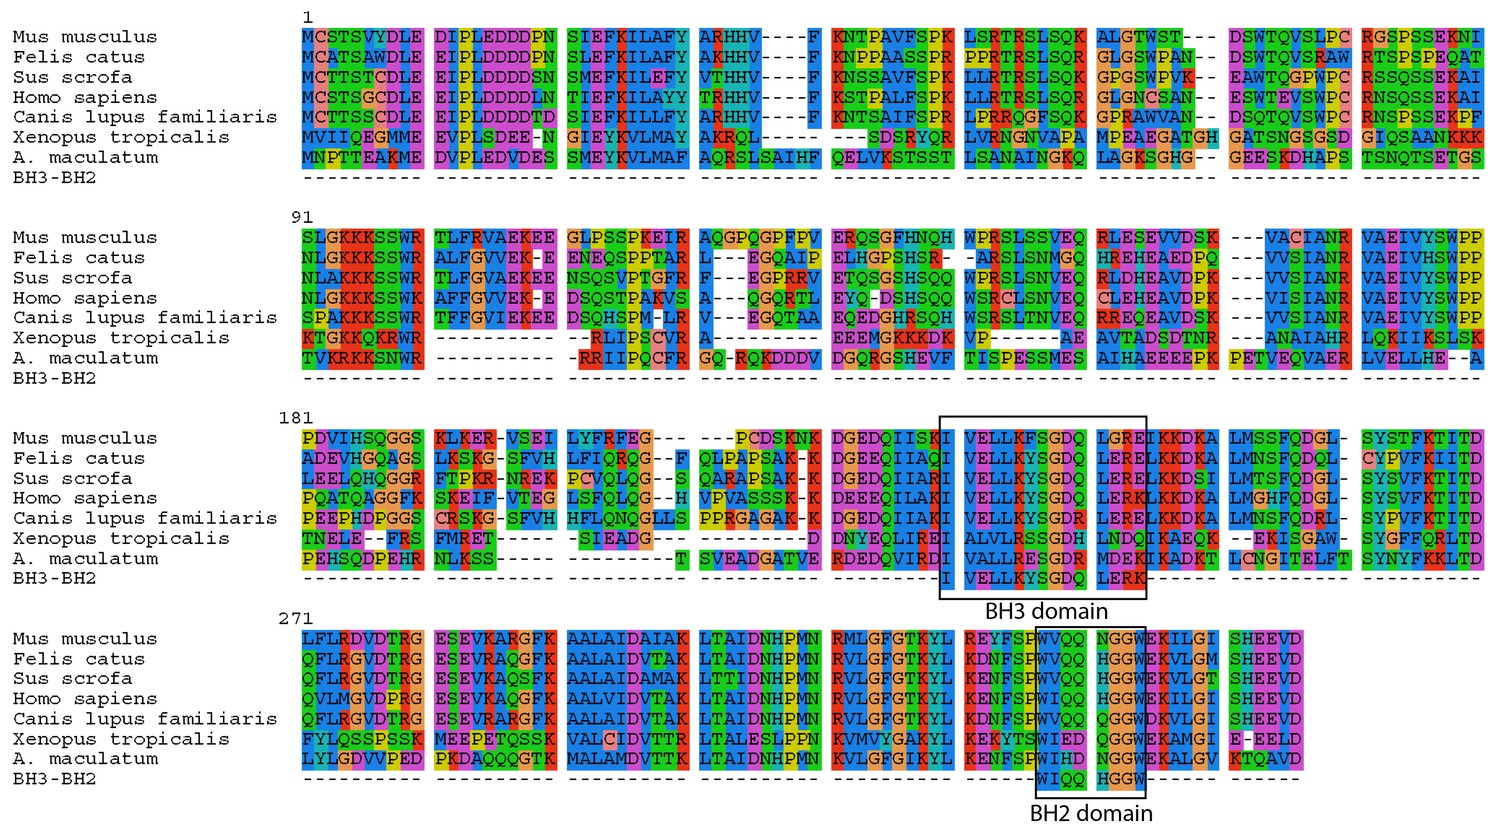
A. maculatum BCL2L14 protein has both a BH3 and BH2 domain.
A multiple alignment of the A. maculatum BCL2L14 protein sequence with other organisms reveals a conserved BH3 and BH2 domains (boxed).
Figure 6
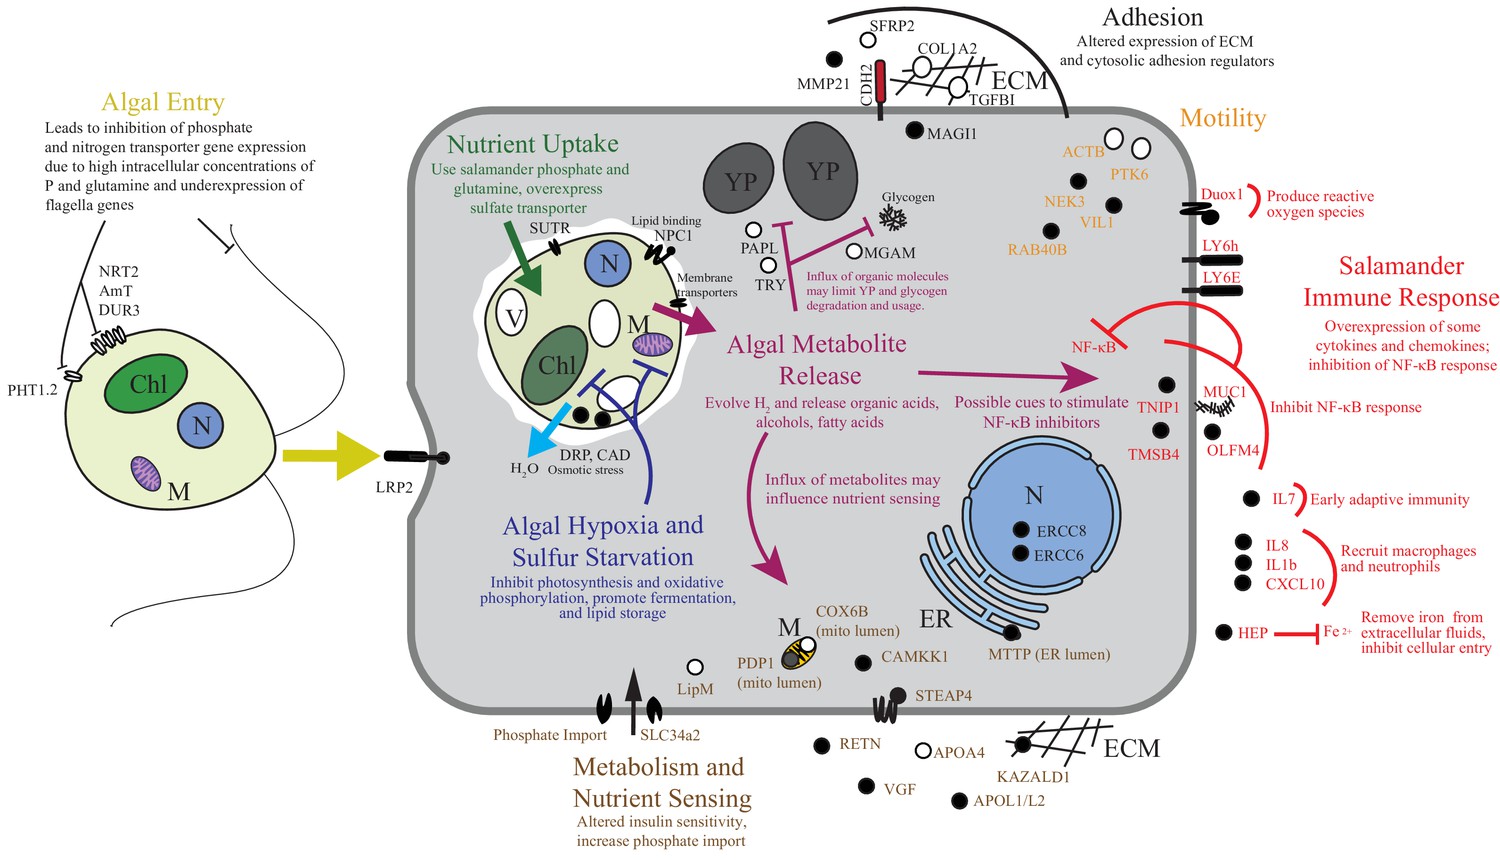
Summary of the major changes in both salamander and algal cells and how they may relate to one another.
The inferred salamander responses are broken into four functional categories while algal changes fall within three primary functional categories based on gene annotations. Text indicates hypothetical changes within each category based on the implied roles of under-expressed or over-expressed genes. Major sections are color-coded. Over-expressed genes represented by solid black symbols. Under-expressed gene symbols are white with black outlines. Cellular compartments are in italics. M=mitochondrion, YP=yolk platelet, V=vacuole, N=nucleus, ECM=extracellular matrix, ER=endoplasmic reticulum, Chl=chloroplast.
Figure 7
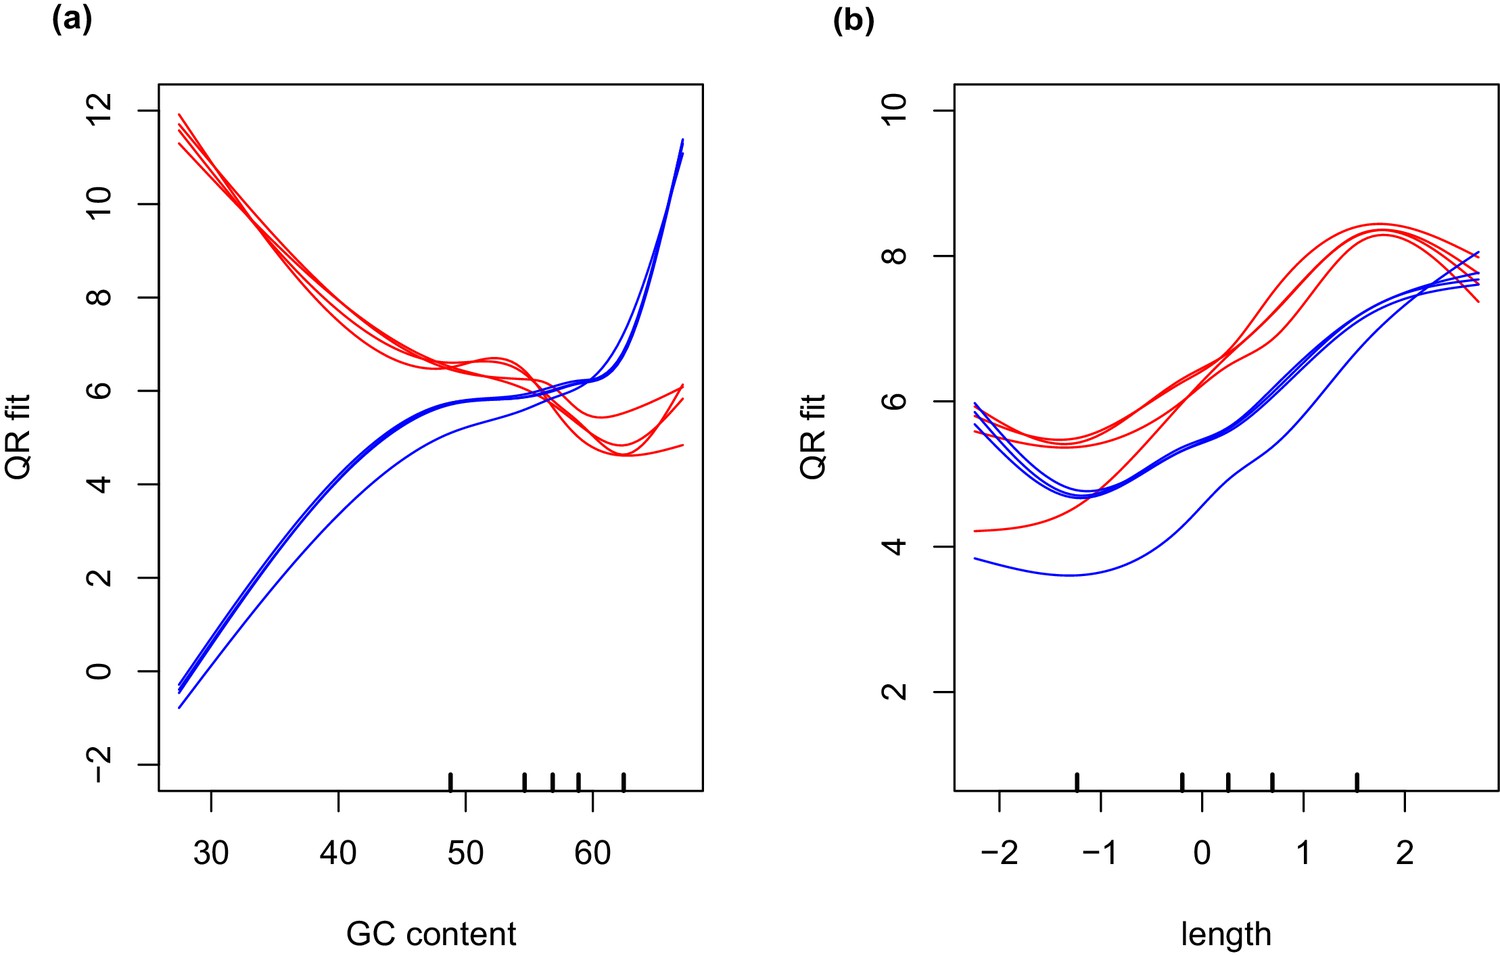
GC and transcript length bias in SMARTer-cDNA synthesis-Nextera-XT libraries compared to TrueSeq libraries.
Red lines indicate the GC content or transcript length biases in reads obtained from SMARTer-cDNA synthesis-Nextera-XT libraries. Blue lines indicate the GC content or transcript length biases in reads obtained from TrueSeq libraries. (a) GC content and length are plotted against ‘QRfit’ which is a measure of fit by quantile regression to the models in Hansen et al. (2012). This metric approximates bias in the sequence dataset by comparing read counts to expected models based on quantiles in the distribution of the GC content of the transcripts. The opposing trends in the two sets of lines shows that GC content bias between the two different libraries is vastly different. The reads obtained from SMARTer-cDNA synthesis-Nextera-XT libraries will tend to have more counts for low GC content transcripts, while the reads obtained from TrueSeq libraries will tend to have more counts for high GC content transcripts, systemically. (b) There is also some moderate transcript length bias differences between the two library prep methods visualized as the separation between the groups of red and blue lines. The methods implemented by the conditional quantile normalization (cqn) package in R handles both types of bias to make the gene count data from both library preparation methods comparable.
Tables
Table 1
Functional classification of the green alga O. amblystomatis genes that are differentially expressed during intracellular association with the salamander host.
| Functional Category | # genes | #up | #down |
|---|---|---|---|
| No Homology | 90 | 43 | 47 |
| Conserved Gene with Unknown Function | 37 | 11 | 26 |
| Stress Response | 32 | 14 | 18 |
| Fermentation | 17 | 13 | 4 |
| Electron Transport-Mitochondrial | 6 | 0 | 6 |
| Photosynthesis | 13 | 7 | 6 |
| Ribosomal Proteins | 11 | 1 | 10 |
| Nitrogen Transport | 5 | 0 | 5 |
| Phosphate Transport | 2 | 0 | 2 |
| Other Transport | 12 | 6 | 6 |
| Sulfur Metabolism | 5 | 5 | 0 |
| Lipid Metabolism | 7 | 5 | 2 |
| Other Metabolism | 9 | 0 | 9 |
| Flagellar Apparatus | 4 | 1 | 3 |
| Signaling | 5 | 1 | 4 |
| Transposable Element | 4 | 1 | 3 |
| Glycosylation | 2 | 0 | 2 |
| Other | 13 | 2 | 11 |
| Totals | 277 | 111 | 166 |
-
Table 1—source data 1
Differentially expressed algal transcripts, annotations, functional groupings, and expression statistics.
- https://doi.org/10.7554/eLife.22054.013
Table 2
Functional classification of the salamander, A. maculatum, genes that are differentially expressed when associated with intracellular alga.
| Functional Category | # genes | #up | #down |
|---|---|---|---|
| No Homology | 155 | 60 | 95 |
| Transposable Element | 69 | 24 | 45 |
| Immune Response | 12 | 11 | 1 |
| Nutrient Sensing | 14 | 7 | 7 |
| Metabolism | 8 | 6 | 2 |
| Adhesion/ECM | 7 | 4 | 3 |
| Proliferation/Survival/ Apoptosis | 7 | 7 | 0 |
| Motility | 5 | 3 | 2 |
| Transcriptional Regulation | 6 | 2 | 4 |
| Cell-Type Specific | 3 | 3 | 0 |
| DNA Repair | 3 | 3 | 0 |
| Others | 11 | 4 | 7 |
| Totals | 300 | 134 | 166 |
-
Table 2—source data 1
Differentially expressed salamander transcripts, annotations, functional groupings, and expression statistics.
- https://doi.org/10.7554/eLife.22054.015
Table 3
O. amblystomatis qPCR primer sequences.
Primer pairs for four reference genes (RACK1, YPTC1, RPL32, H2B1), and five response genes (PhT1.2, NaPhT1 [ANTR1], AMT1.2, NRT2.4, DUR3) used in this study. Efficiency values were measured per amplicon using a standard curve with five two-fold dilutions of cDNA.
| Primer | Sequence (5ʹ−3ʹ) | Efficiency |
|---|---|---|
| Ooph_RACK1_L_3 | CGCACAGCCAGTAGCGGT | 0.94 |
| Ooph_RACK1_R_3 | GGACCTGGCTGAGGGCAA | |
| Ooph_YPTC1_L_4 | TTGCGGATGACACCTACACG | 1.09 |
| Ooph_YPTC1_R_4 | TGGTCCTGAATCGTTCCTGC | |
| Ooph_RPL32_L_2 | ATAACAGGGTCCGCAGAAAG | 1.03 |
| Ooph_RPL32_R_2 | GTTGGAGACGAGGAACTTGAG | |
| Ooph_H2B1_L_4 | CAAGAAGCCCACCATGACCT | 1.04 |
| Ooph_H2B1_R_4 | GGTGAACTTGGTGACTGCCT | |
| Ooph_PhT1.2_L_4 | TGCCAATGACTTCGCCTTCT | 1.02 |
| Ooph_PhT1.2_R_4 | ACGTTCCACTGCTGCTTCTT | |
| Ooph_NaPhT1_L_4 | TCCATCATCGGTCTGTCGCT | 0.99 |
| Ooph_NaPhT1_R_4 | GAACCACACGATGCCCAGAG | |
| Ooph_AMT1.2_L_4 | CGGTCTCCTTCCAATCGCCA | 0.96 |
| Ooph_AMT1.2_R_4 | CCAATGGGTGCTGACTGGGA | |
| Ooph_NRT2.4_L_3 | CGACTACCGCGACCTGAAGA | 1.03 |
| Ooph_NRT2.4_R_3 | GAACAAGACCCAGGCCCTGT | |
| Ooph_DUR3_L_3 | GCGAATGCCGAGCACTTC | 1.02 |
| Ooph_DUR3_R_3 | CTGTCCCTGGGCTGGGT |
Additional files
-
Supplementary file 1
Differentially expressed stress related genes in O. amblystomatis
- https://doi.org/10.7554/eLife.22054.028
-
Supplementary file 2
Differentially expressed sulfur metabolism genes in O. amblystomatis
- https://doi.org/10.7554/eLife.22054.029
-
Supplementary file 3
Differentially expressed genes with roles in fermentation in O. amblystomatis
- https://doi.org/10.7554/eLife.22054.030
-
Supplementary file 4
Differentially expressed genes in photosynthesis in O. amblystomatis
- https://doi.org/10.7554/eLife.22054.031
-
Supplementary file 5
Differentially expressed genes in mitochondrial electron transport in O. amblystomatis
- https://doi.org/10.7554/eLife.22054.032
-
Supplementary file 6
Differentially expressed nitrogen and phosphorous transport genes in O. amblystomatis
- https://doi.org/10.7554/eLife.22054.033
-
Supplementary file 7
Differentially expressed transposable element genes in A. maculatum
- https://doi.org/10.7554/eLife.22054.034
-
Supplementary file 8
Differentially expressed proliferation genes in A. maculatum
- https://doi.org/10.7554/eLife.22054.035
-
Supplementary file 9
Differentially expressed genes with immune functions in A. maculatum.
- https://doi.org/10.7554/eLife.22054.036
-
Supplementary file 10
NF-κB and TLR response gene expression levels in salamander cells with algal endosymbionts.
- https://doi.org/10.7554/eLife.22054.037
-
Supplementary file 11
Differentially expressed genes in metabolism and nutrient sensing in A. maculatum.
- https://doi.org/10.7554/eLife.22054.038
-
Supplementary file 12
Differentially expressed genes in motility in A. maculatum
- https://doi.org/10.7554/eLife.22054.039
-
Supplementary file 13
Top 25 biological process GO annotations for differentially Expressed O. amblystomatis genes.
- https://doi.org/10.7554/eLife.22054.040
-
Supplementary file 14
Top 25 biological process GO annotations for differentially expressed A. maculatum genes.
- https://doi.org/10.7554/eLife.22054.041
-
Supplementary file 15
Top 25 biological process GO annotations from REViGO for differentially expressed O. amblystomatis genes.
- https://doi.org/10.7554/eLife.22054.042
-
Supplementary file 16
Functional grouping of O. amblystomatis genes by REViGO.
- https://doi.org/10.7554/eLife.22054.043
-
Supplementary file 17
Top 25 biological process GO annotations from REViGO for differentially expressed A. maculatum genes.
- https://doi.org/10.7554/eLife.22054.044
-
Supplementary file 18
Functional grouping of A. maculatum genes by REViGO.
- https://doi.org/10.7554/eLife.22054.045
Download links
A two-part list of links to download the article, or parts of the article, in various formats.
Downloads (link to download the article as PDF)
Open citations (links to open the citations from this article in various online reference manager services)
Cite this article (links to download the citations from this article in formats compatible with various reference manager tools)
Transcriptome analysis illuminates the nature of the intracellular interaction in a vertebrate-algal symbiosis
eLife 6:e22054.
https://doi.org/10.7554/eLife.22054


