Point of View: Towards a mechanistic foundation of evolutionary theory
- University of British Columbia, Canada
- Universidad de Santiago de Chile, Chile
- University of Colorado, United States
Figures
Figure 1
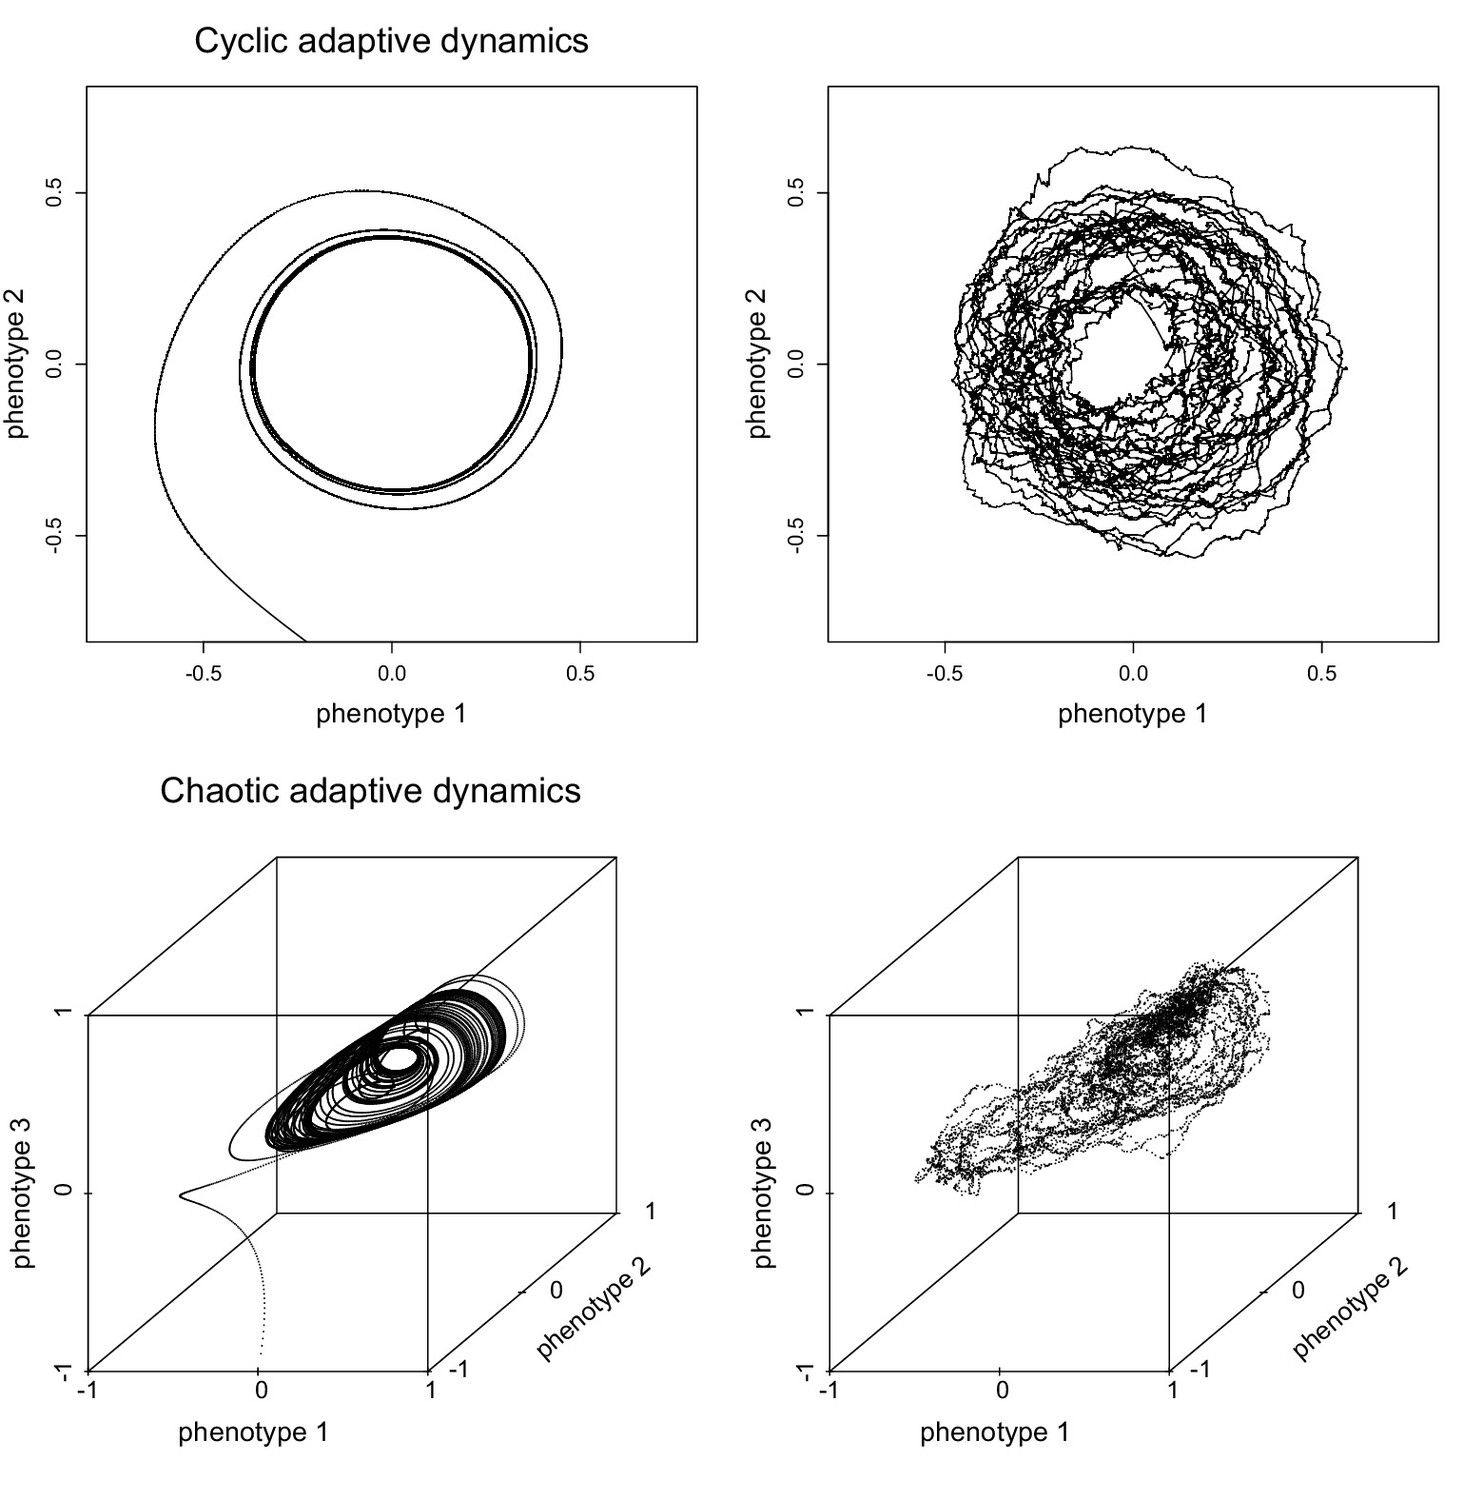
Deterministic approximations of evolutionary birth-death processes.
Adaptive dynamics, given by Equation 3, derived for the two examples of evolutionary birth-death processes shown in Video 1 and Video 2. Adaptive dynamics yields a deterministic approximation of the evolutionary dynamics, which is shown in the left panels (cyclic dynamics in 2-dimensional phenotypes space in the top left panel, chaotic attractor in 3-dimensional phenotype space in the bottom left panel). The panels on the right show the corresponding trajectories of the centres of mass of the clouds of points representing the two evolutionary birth-death processes in Video 1 and Video 2. For details see (Ispolatov et al., 2016).
Videos
Video 1
Evolving populations as clouds of points moving in phenotype space.
The points in the cloud represent the individual organisms, which can give birth (spawn a new point in the cloud) and die (the corresponding dot disappears from the cloud). The video shows a single species undergoing cyclic evolutionary dynamics in a 2-dimensional phenotype space. The - and -axis are the two phenotypes, and the cloud of points represents the evolving population. In this example, all individuals had the same constant birth rate, whereas individual death rates were determined by competition from other individuals in the population. Specifically, the death rate of an individual with phenotype was equal to , where is the competition kernel, which measures the competitive impact of on , is the carrying capacity of phenotype , and the sum runs over all other individuals in the current population. The video shows the same scenario as Figure 1 in Ispolatov et al. (2016), to which we refer for details of the simulations, as well as of the particular functions chosen for and .
Video 2
A single species undergoing chaotic evolutionary dynamics in a 3-dimensional phenotype space.
The cloud of points represents the evolving population. In this example, all individuals had the same constant birth rate, whereas individual death rates were determined by competition from other individuals in the population in a way that is analogous to the example shown in Video 1, i.e., based on a particular competition kernel and a carrying capacity function (now having 3-dimensional vectors as arguments). The video shows the same scenario as Figure 2 in Ispolatov et al. (2016), to which we refer for details of the simulations, as well as of the particular functions chosen for and .
Download links
A two-part list of links to download the article, or parts of the article, in various formats.
Downloads (link to download the article as PDF)
Open citations (links to open the citations from this article in various online reference manager services)
Cite this article (links to download the citations from this article in formats compatible with various reference manager tools)
Point of View: Towards a mechanistic foundation of evolutionary theory
eLife 6:e23804.
https://doi.org/10.7554/eLife.23804


