Research: The readability of scientific texts is decreasing over time
- Karolinska Institutet, Sweden
Figures
Figure 1

Data and readability analysis pipeline.
(A) Schematic depicting the major steps in the abstract extraction and analysis pipeline. Readability formulas are provided in full in Materials and methods. (B) Number of articles in the corpus published in each year. The color scale is logarithmic. (C) Starting year of each journal within the corpus. This corresponds to the first article in PubMed with an abstract. The color scale is linear. Source data for this figure is available in Figure 2—source data 1.
Figure 2 with 1 supplement
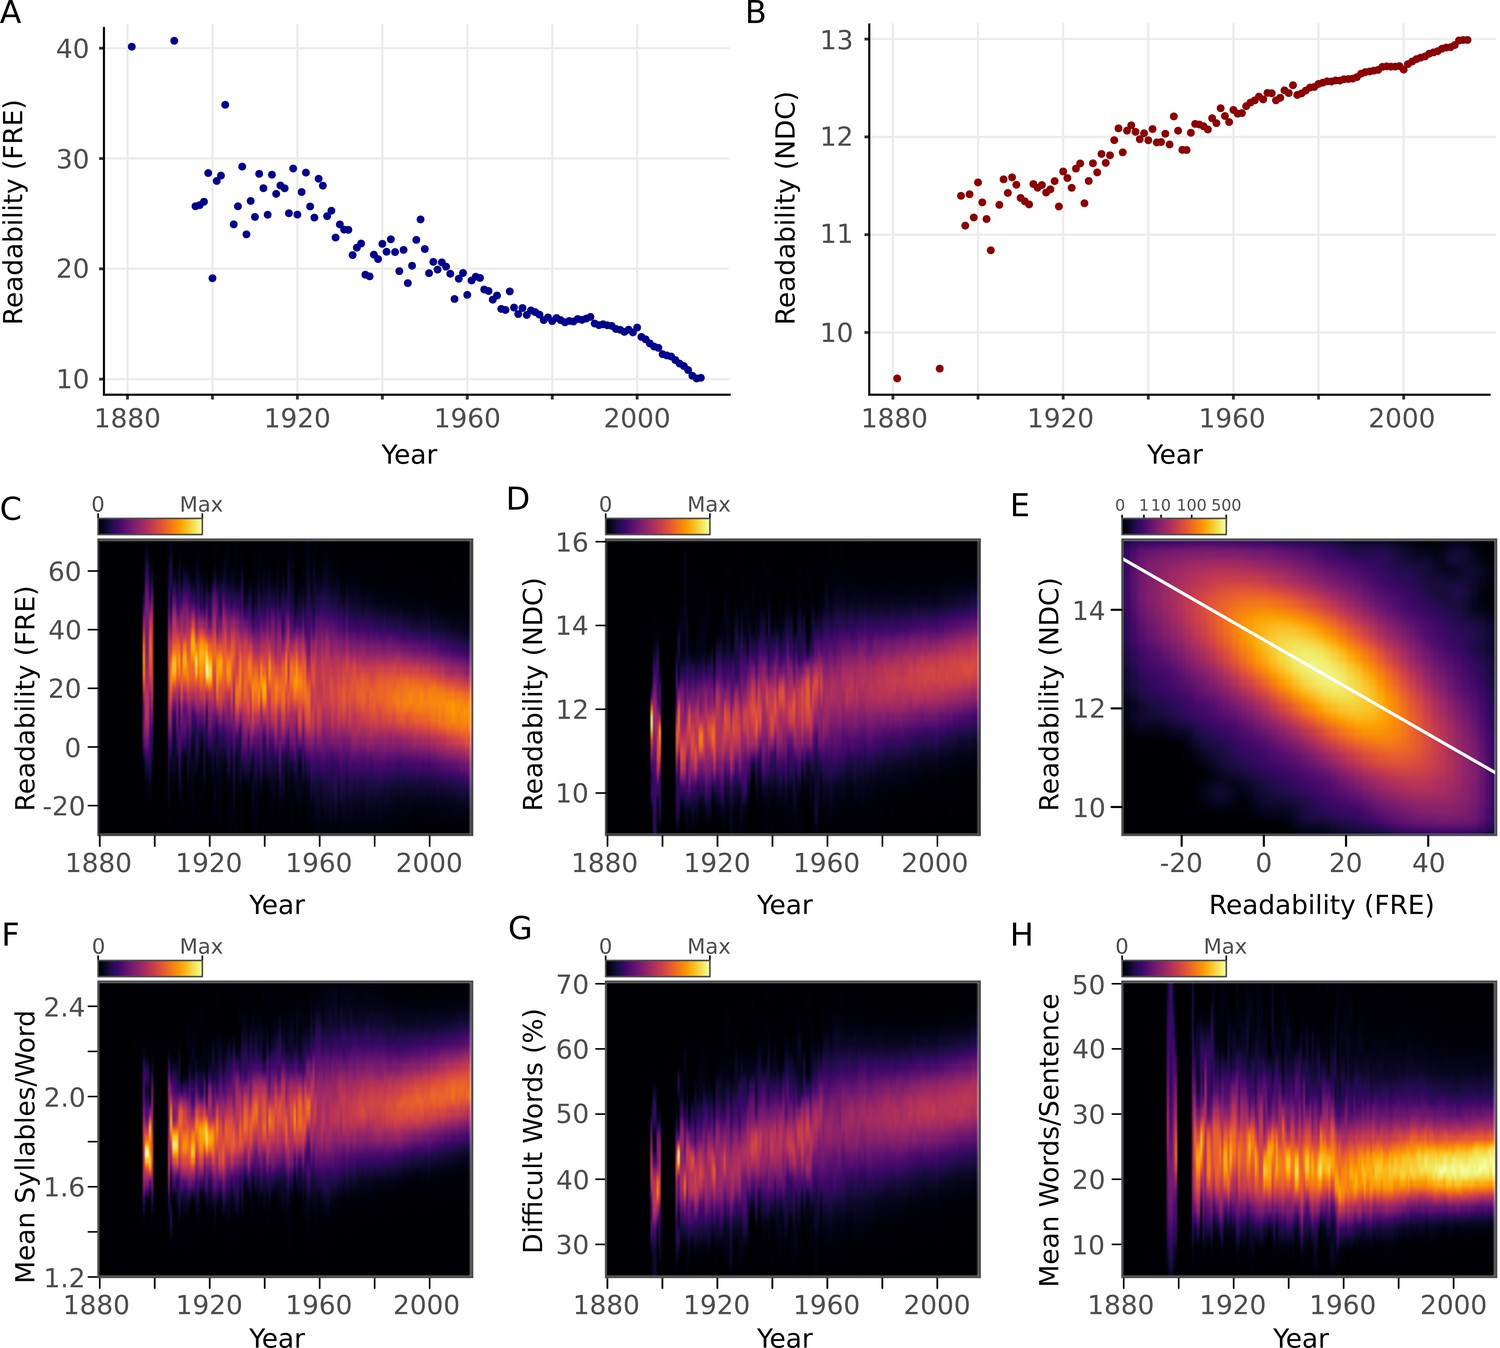
Scientific abstracts have become harder to read over time.
(A) Mean Flesch Reading Ease (FRE) readability for each year. Lower scores indicate less readability. (B) Mean New Dale-Chall (NDC) readability for each year. Higher scores indicate less readability. (C,D) Kernel density estimates displaying the readability (C: FRE, D: NDC) distribution of all abstracts for each year. Color scales are linear and represent relative density of scores within each year. (E) Relationship between FRE and NDC scores across all abstracts, depicted by a two-dimensional kernel density estimate. Axis limits are set to include at least 99% of the data. The color scale is exponential and represents the number of articles at each pixel. (F-H) Kernel density estimates displaying the components of the readability measures (F: syllable to word ratio; G: percentage of difficult words; H: word to sentence ratio) distribution of all abstracts for each year. Color scales are linear and represent relative density of values within each year. For kernel density plots over time (C,D,F,G,H), years with fewer than 10 abstracts are excluded to obtain accurate density estimates.
-
Figure 2—source data 1
Readability data of abstracts and number of authors per article.
- https://doi.org/10.7554/eLife.27725.005
-
Figure 2—source data 2
Readability data when no preprocessing is done.
- https://doi.org/10.7554/eLife.27725.006
Figure 2—figure supplement 1
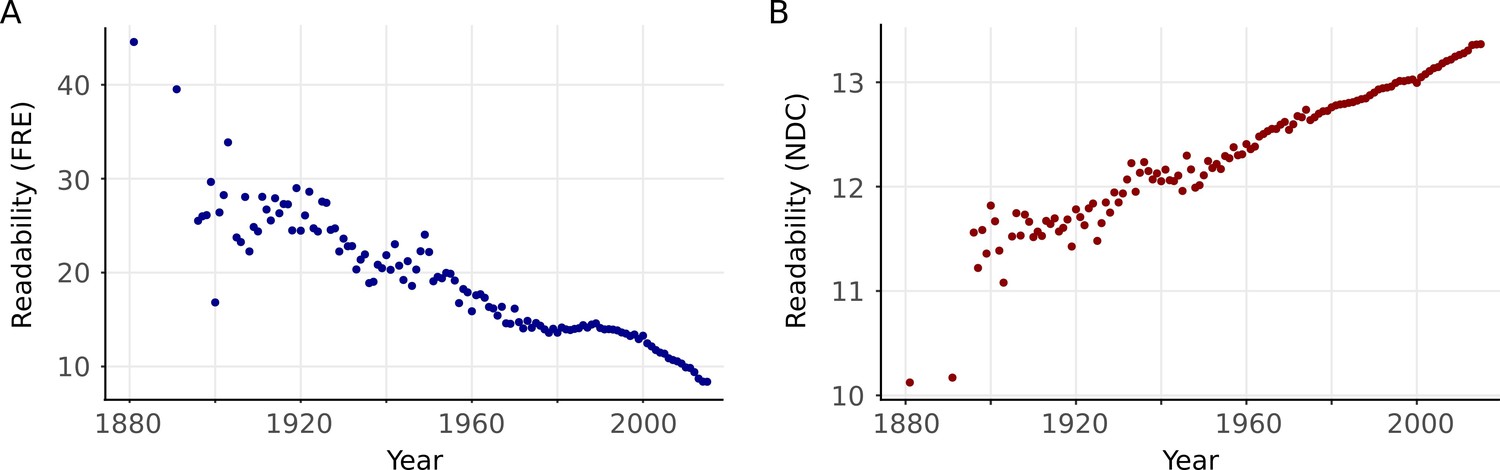
Readability over years with minimal preprocessing to illustrate that the preprocessing steps have not induced the trend.
(A) Mean Flesch Reading Ease for each year. (B) Same as A but for New Dale-Chall.
Figure 3 with 1 supplement
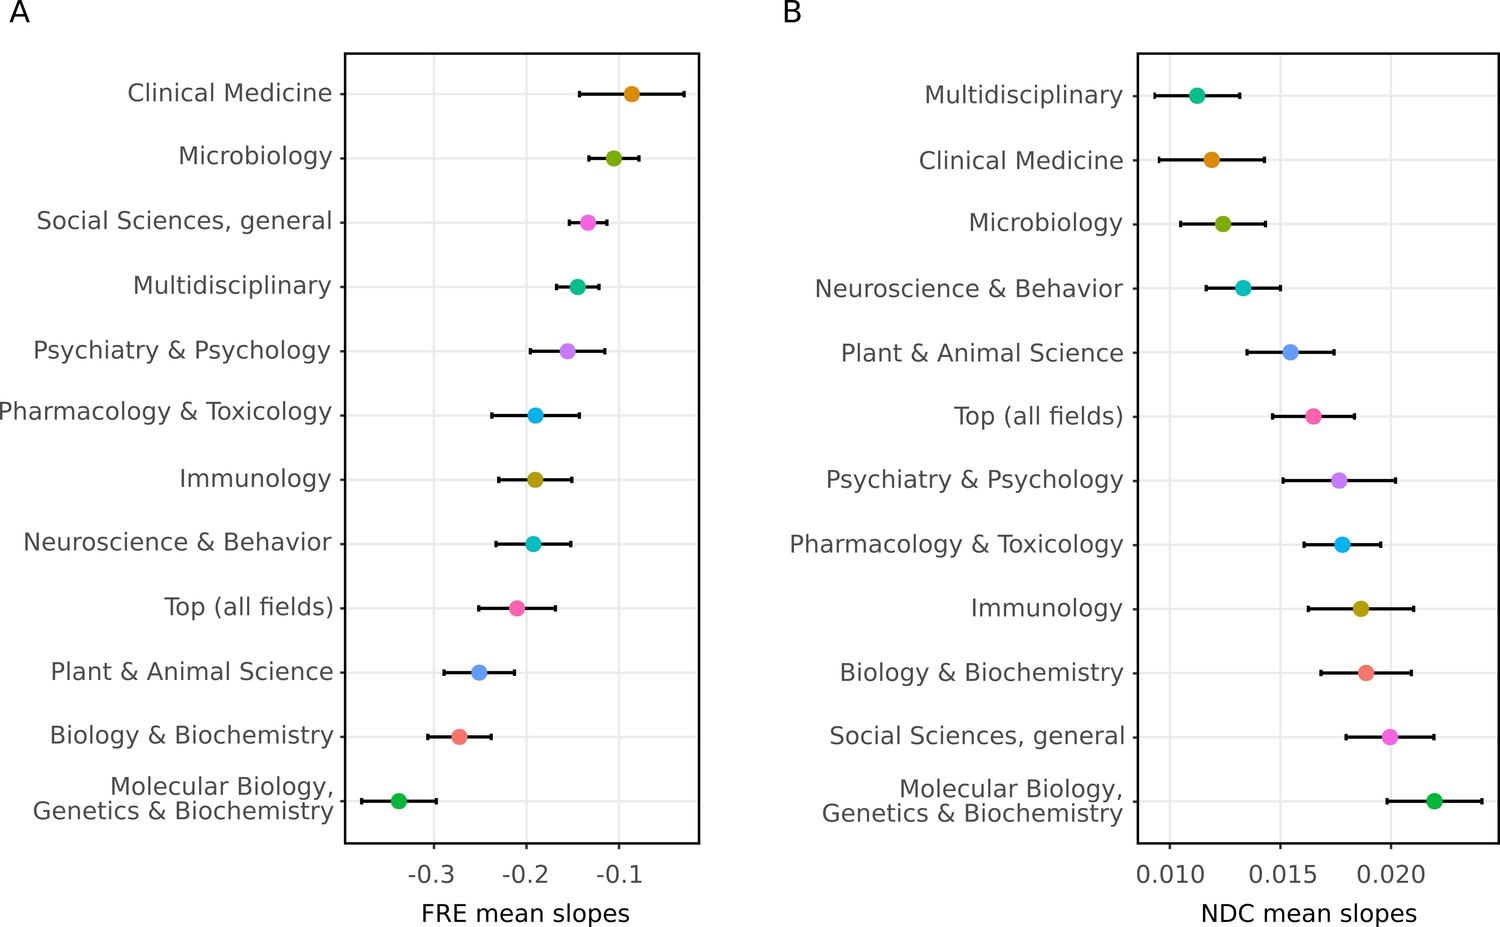
The decline in readability differs between scientific fields.
The random slopes for each journal were extracted from the best fitting linear mixed effect model (M2) and summarized according to which field they belong to (The error bars represent SE of the mean slope). Since some journals belong to more than one field, some random slopes appear in more than one summary. The trend of decreasing readability is not specific to any one field. (A) Summaries of random slopes for Flesch Reading Ease. (B) Summaries of random slopes for New Dale-Chall.
-
Figure 3—source data 1
Summary of FRE and NDC journal random slopes for each field extracted from the linear mixed model (M2).
- https://doi.org/10.7554/eLife.27725.010
-
Figure 3—source data 2
FRE and NDC random slopes for each journal extracted from the linear mixed model (M2).
- https://doi.org/10.7554/eLife.27725.011
Figure 3—figure supplement 1
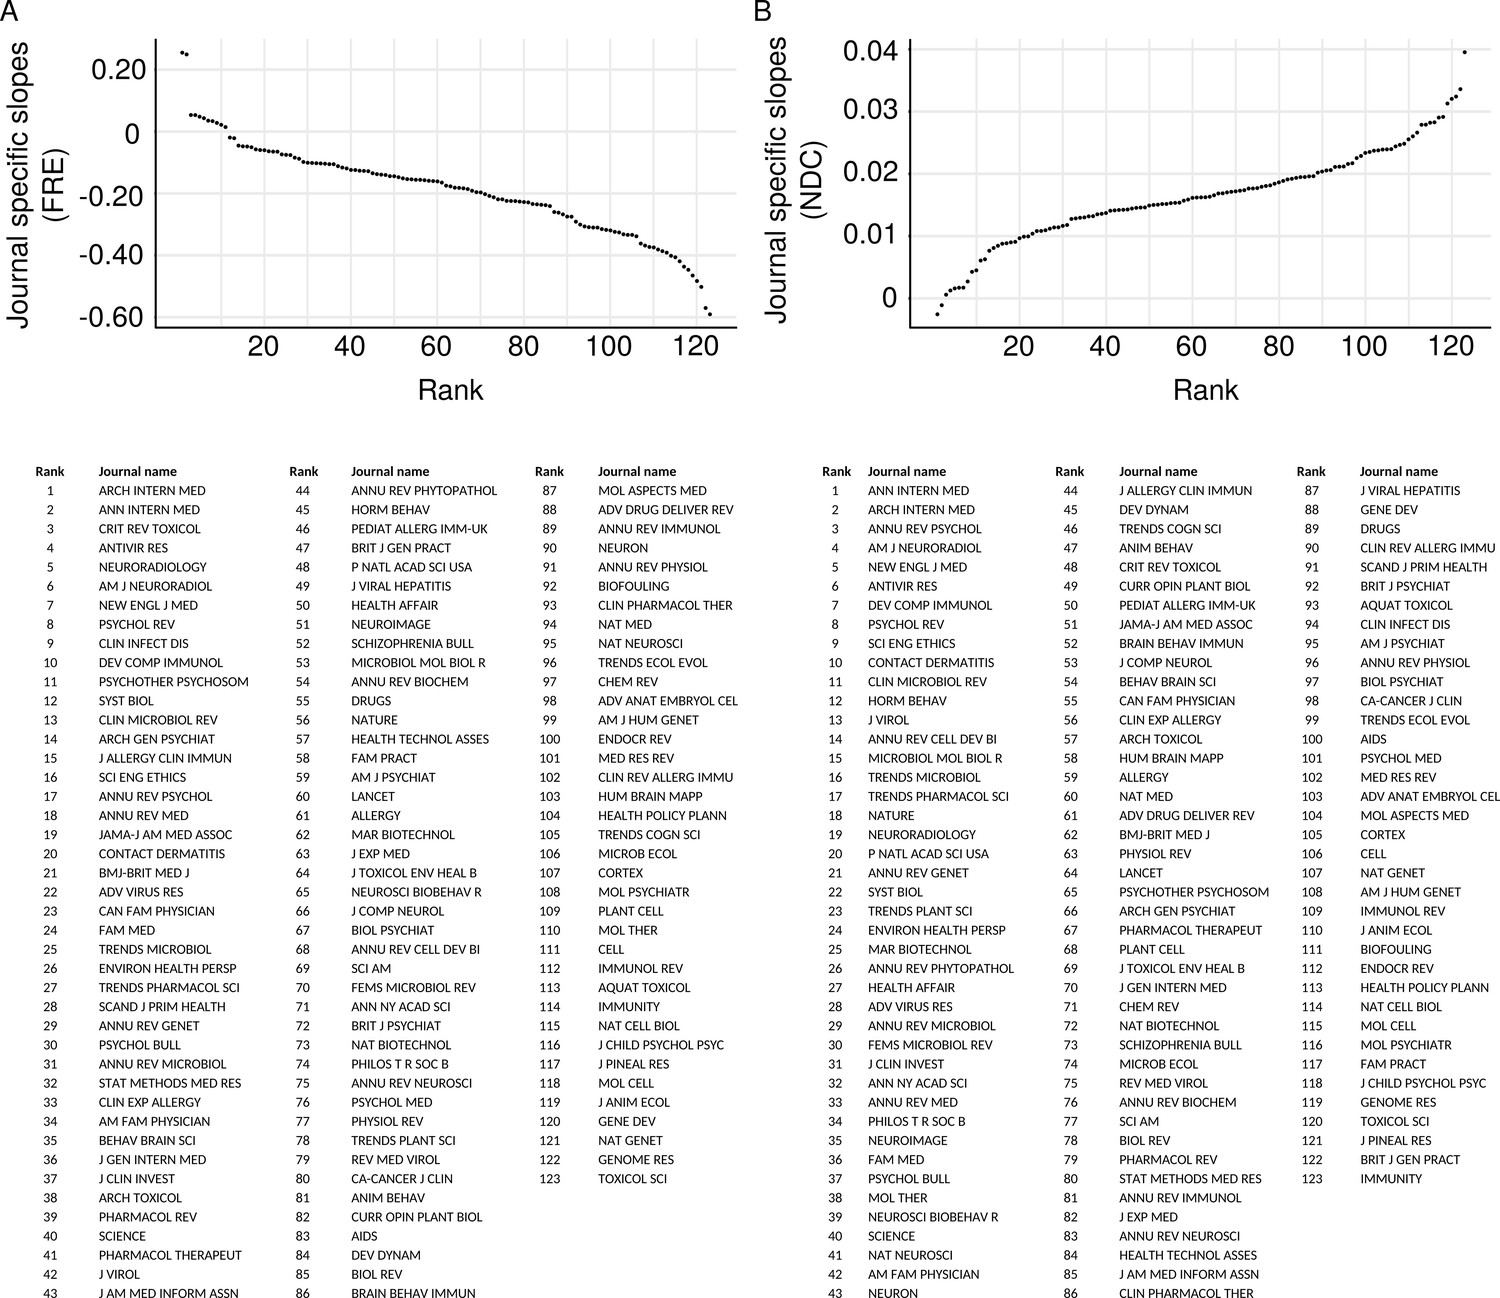
Most, but not all, journals have become less readable over time.
The random slopes for each journal were extracted from the best fitting linear mixed effect model (M2) and plotted according to rank. The trend of decreasing readability is present in most journals, although a few show an absence of a trend, and fewer still show increasing readability. (A) Journal random slopes for Flesch Reading Ease. (B) Journal random slopes for New Dale-Chall.
Figure 4 with 2 supplements
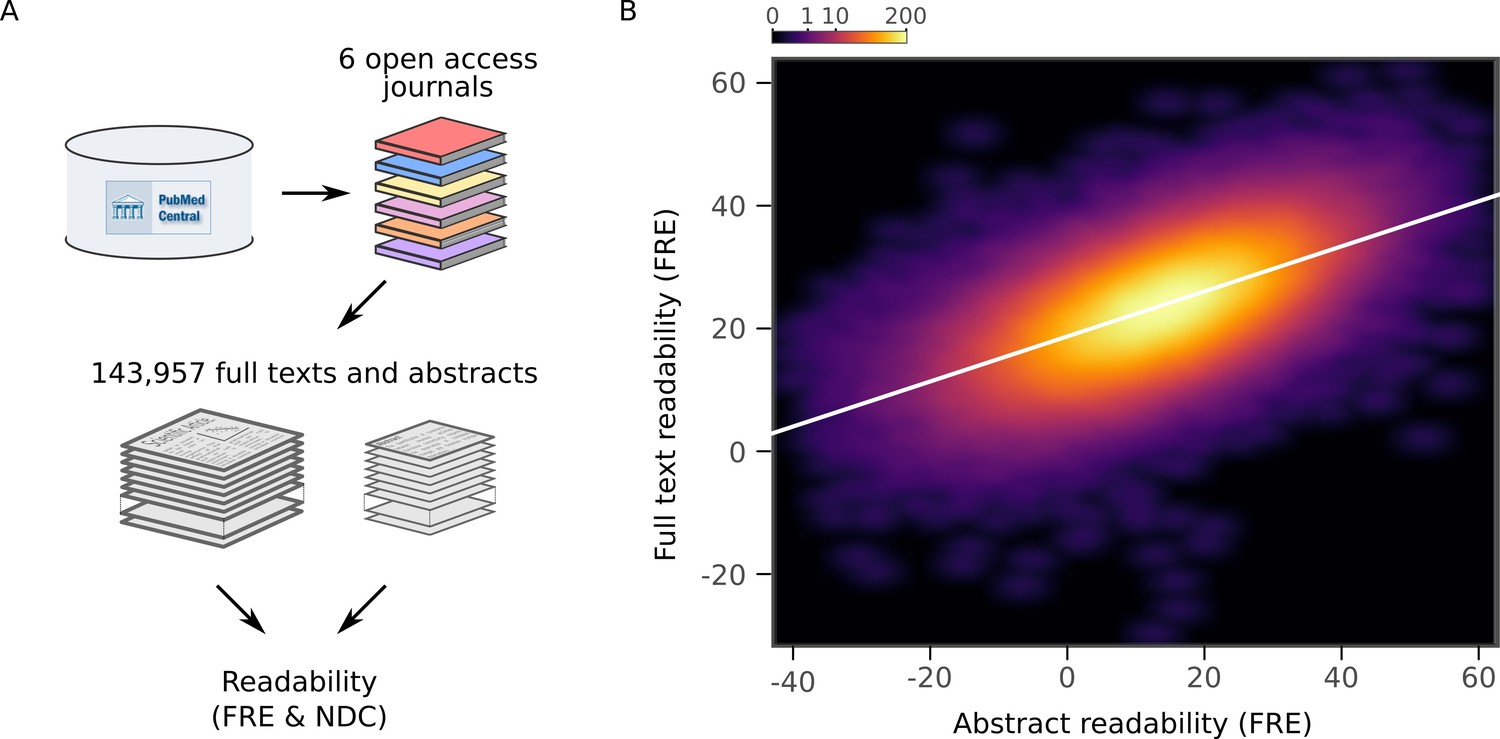
Readability of scientific abstracts correlates with readability of full texts.
(A) Schematic depicting the major steps in the full text extraction and analysis pipeline. (B) Relationship between Flesch Reading Ease (FRE) scores of abstracts and full texts across the full text corpus, depicted by a two-dimensional kernel density estimate. The color scale is exponential and represents the number of articles at each pixel. Axis limits are set to include at least 99% of the data. For New Dale-Chall (NDC) scores, see Figure 4—figure supplement 1. For each journal separately, see Figure 4—figure supplement 2.
-
Figure 4—source data 1
Readability data used in full text analysis.
- https://doi.org/10.7554/eLife.27725.015
Figure 4—figure supplement 1
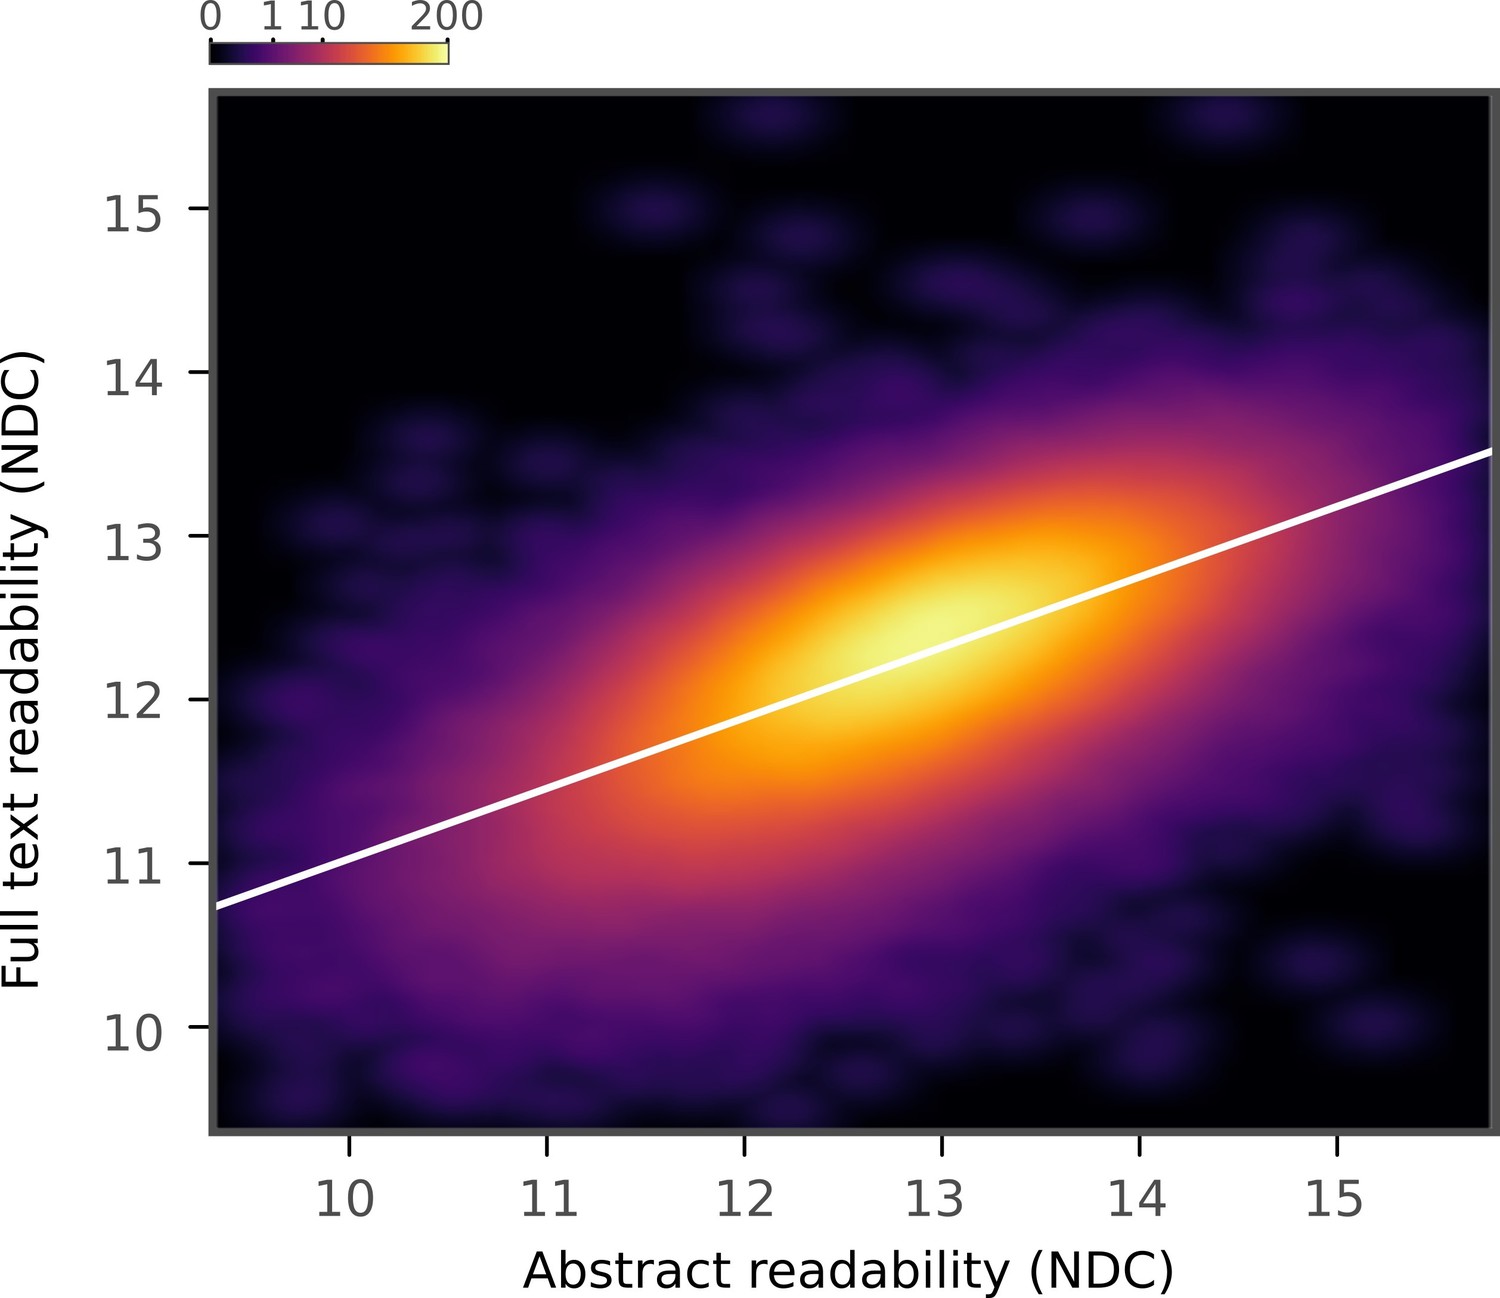
New Dale-Chall abstracts and full text.
Relationship between New Dale-Chall Readability Formula scores of abstracts and full texts across the full text corpus, depicted by a two-dimensional kernel density estimate. Axis limits are set to include at least 99% of the data.
Figure 4—figure supplement 2
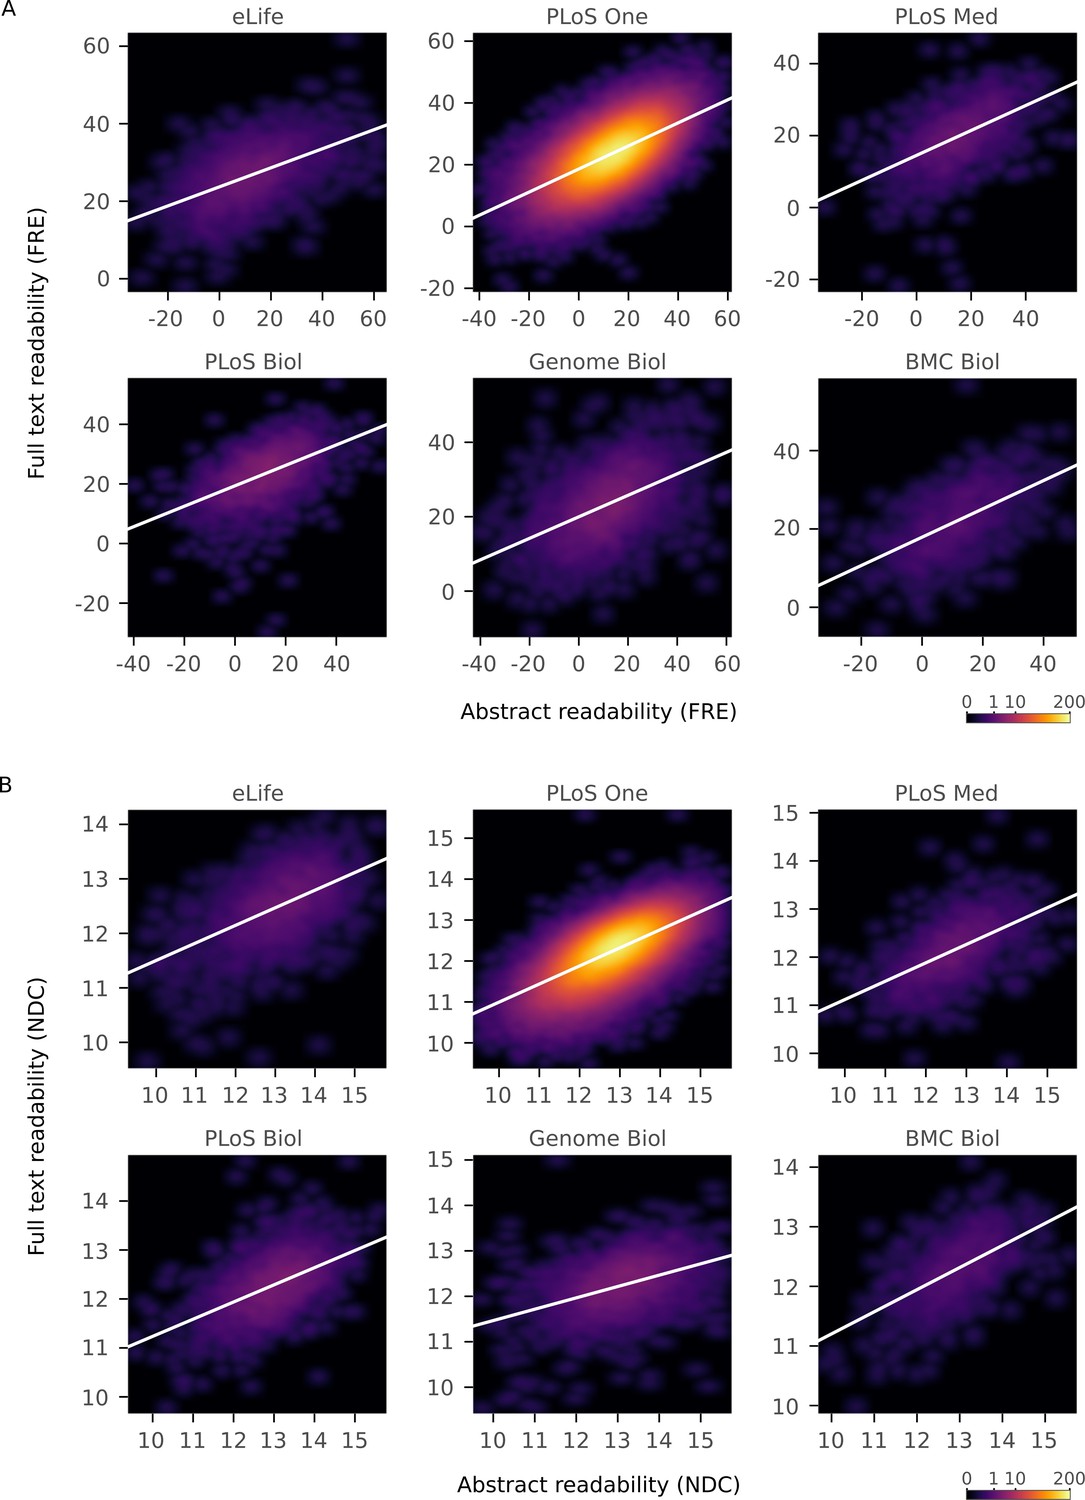
Correlations between readability metrics for abstracts and full texts from individual journals.
Relationship between both Flesch Reading Ease and New Dale-Chall Readability Formula scores of abstracts and full texts by journal, depicted by a two-dimensional kernel density estimate. Axis limits are set to include at least 99% of the data. Color scales are exponential and represent the number of articles at each pixel. FRE correlations (all p <10-15): eLife r = 0.54, 95% CI [0.51, 0.57], PLoS ONE r = 0.61, 95% CI [0.61, 0.61], PLoS Med r = 0.52, 95% CI [0.48, 0.56], PLoS Biol r = 0.49, 95% CI [0.46, 0.52], Genome Biol r = 0.51, 95% CI [0.48, 0.53], BMC Biol r = 0.57, 95% CI [0.52, 0.61]. NDC correlations (all p<10-15): eLife r = 0.56, 95% CI [0.53, 0.59], PLoS ONE r = 0.64, 95% CI [0.64, 0.64], PLoS Med r = 0.56, 95% CI [0.52, 0.60], PLoS Biol r = 0.52, 95% CI [0.49, 0.55], Genome Biol r = 0.44, 95% CI [0.41, 0.47], BMC Biol r = 0.57, 95% CI [0.52, 0.61].
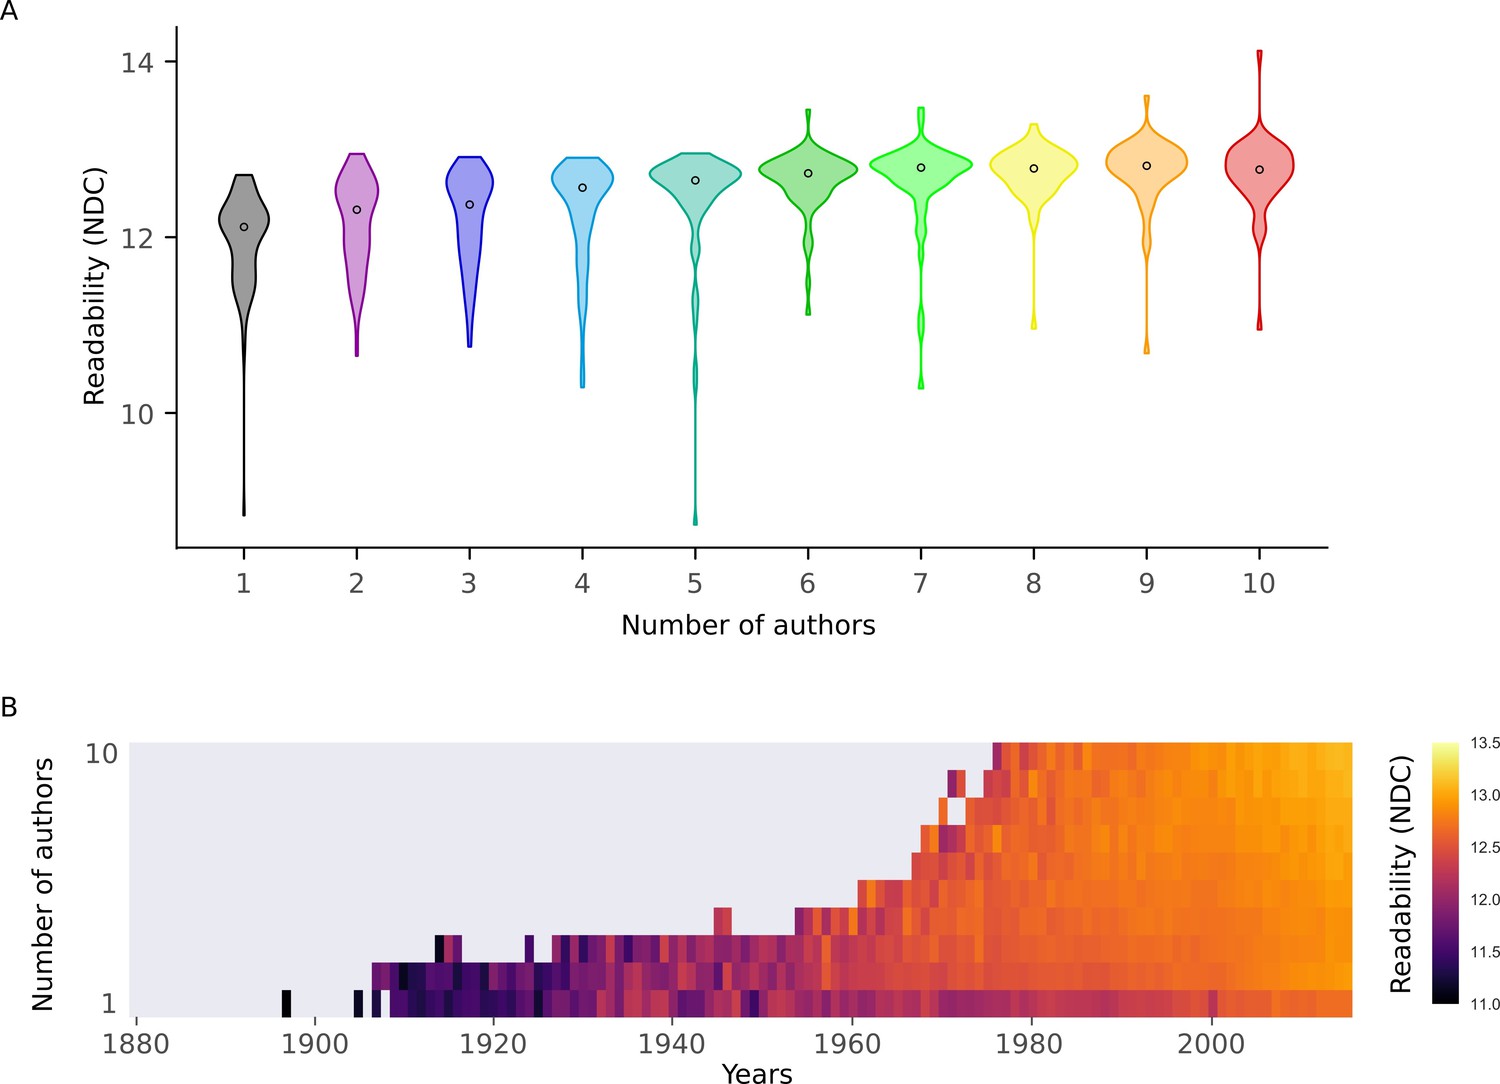
Figure 5 with 1 supplement
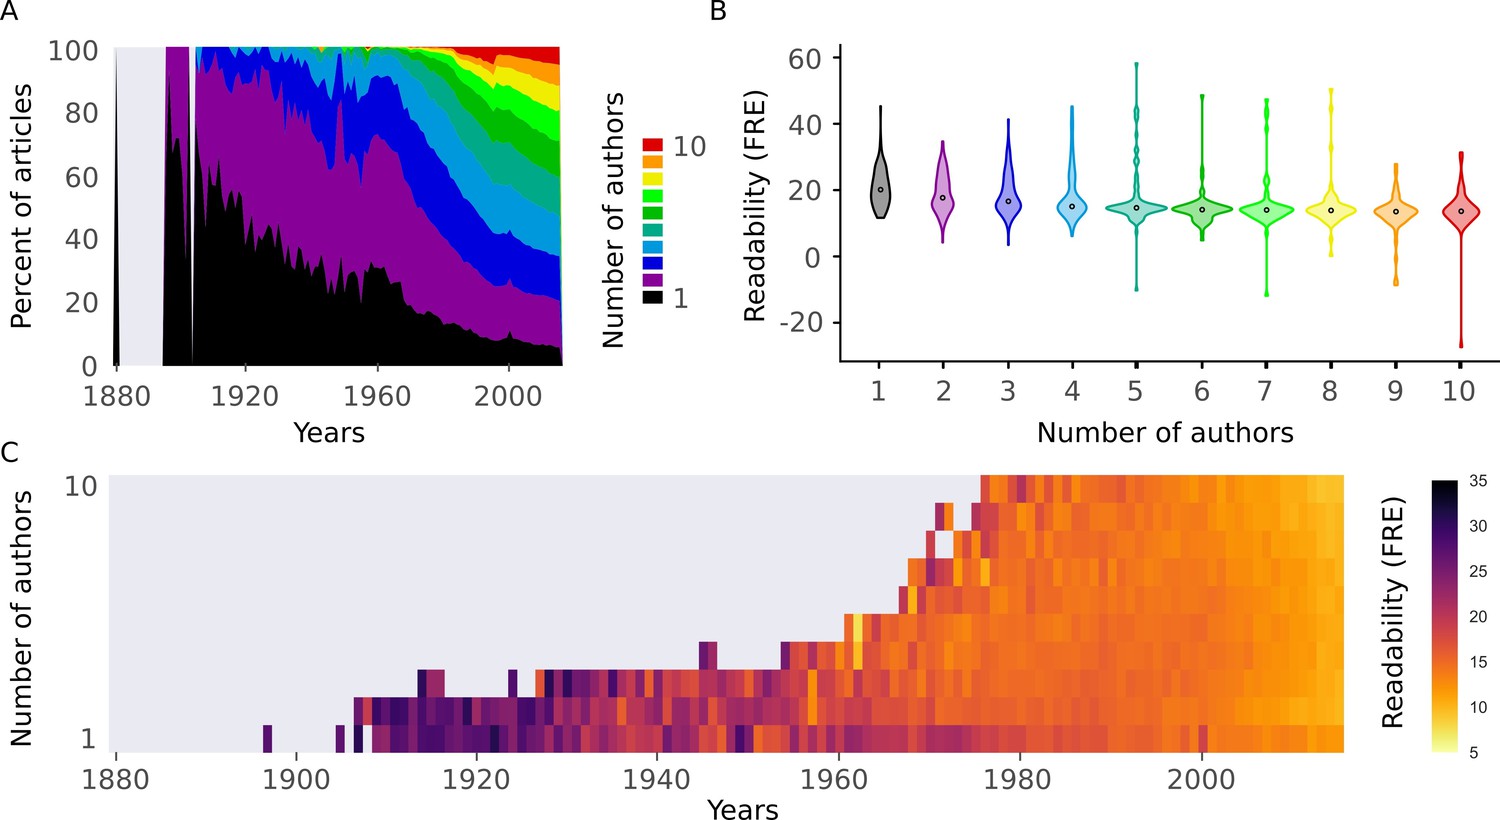
Readability is affected by the number of authors.
(A) Proportion of number of authors per year for all articles in the abstract corpus. (B) Distributions of Flesch Reading Ease (FRE) scores for different numbers of authors (1-10). For New Dale-Chall (NDC), see Figure 5—figure supplement 1A (C) Mean FRE score for each year for different numbers of authors (1-10). For visualization purposes, bins with fewer than 10 abstracts are excluded. For NDC, see Figure 5—figure supplement 1B. Source data for this figure is available in Figure 2—source data 1.
Figure 5—figure supplement 1
New Dale-Chall for different number of authors.
(A) Distributions of New Dale-Chall Readability Formula scores for different numbers of authors. (B) Mean New Dale-Chall Readability Formula score for each year for different numbers of authors.
Figure 6
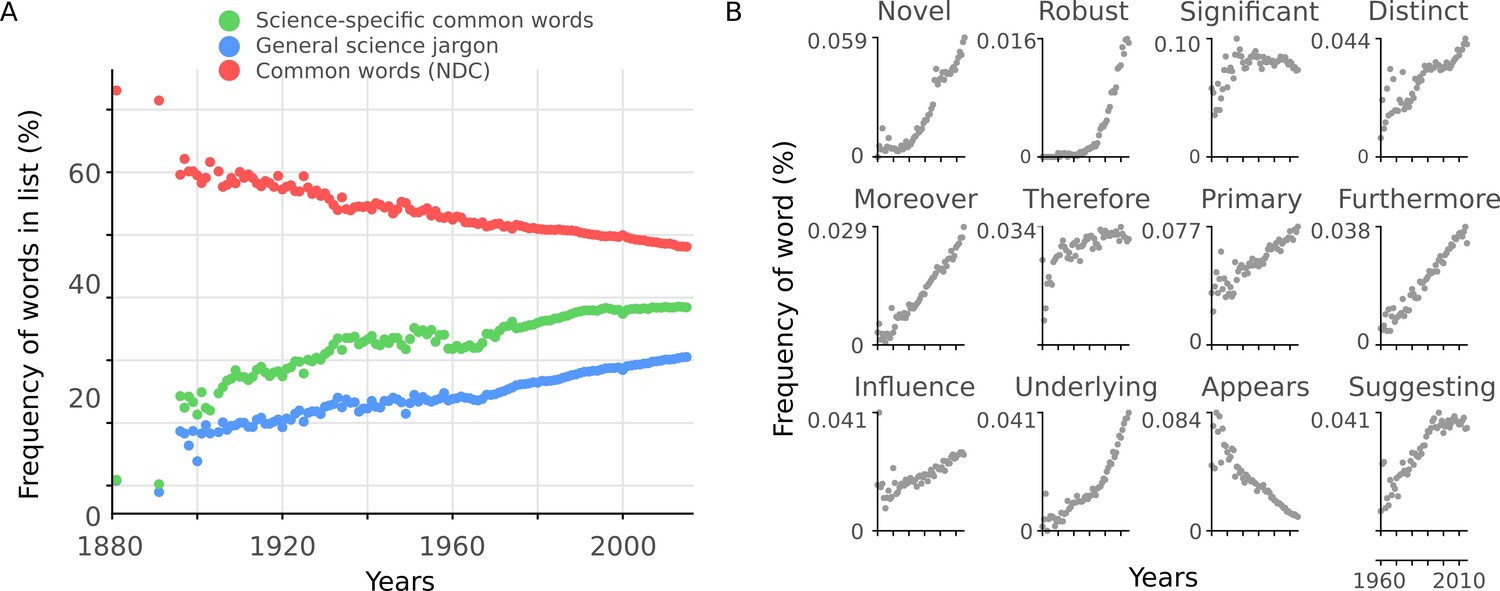
Readability is affected by general scientific jargon.
(A) Mean percentage of words in abstracts per year included in three different lists: science-specific common words (green, 2,949 words), general scientific jargon (blue, 2,138 words) and NDC common words (red, 2,949 words). (B) Example general science jargon words taken from the general scientific jargon list. Mean percentage of each word’s frequency in abstracts per year is shown.
-
Figure 6—source data 1
Frequency of words in lists and example word use per article.
- https://doi.org/10.7554/eLife.27725.020
-
Figure 6—source data 2
PubMed ID for files used in training and verification lists of science common word list.
- https://doi.org/10.7554/eLife.27725.021
Tables
Table 1
Model fits for two different linear mixed effect models examining the relationship between readability scores and year.
A null model (M0) without year as a predictor is included as a baseline comparison. Lower dAIC and dBIC values indicate better model fit. FRE = Flesch Reading Ease; NDC = New Dale-Chall Readability Formula; M0 = Journal as random effect with varying intercepts; M1 = M0 with an added fixed effect of time; M2 = M1 with varying slopes for the random effect of journal; dAIC = difference in Akaike Information Criterion from the best fitting model (M2); dBIC = difference in Bayesian Information Criterion from the best fitting model (M2); df = Degrees of Freedom calculated using Satterthwaite approximation.
| Metric | Model | dAIC | dBIC | beta | CI 95% | t | df | p |
|---|---|---|---|---|---|---|---|---|
| FRE | M0 | 16008 | 15974 | - | - | - | - | - |
| M1 | 5240 | 5217 | -0.14 | [-0.15, -0.14] | -104.2 | 709543 | p <10-15 | |
| M2 | 0 | 0 | -0.19 | [-0.22, -0.16] | -12.7 | 123 | p <10-15 | |
| NDC | M0 | 28593 | 28559 | - | - | - | - | - |
| M1 | 4077 | 4054 | 0.014 | [0.014, 0.014] | 158.0 | 709559 | p <10-15 | |
| M2 | 0 | 0 | 0.016 | [0.015, 0.018] | 20.5 | 117 | p <10-15 |
Table 2
Linear mixed effect models predicting readability scores by year and number of authors with journals as random effect.
FRE = Flesch Reading Ease; NDC = New Dale-Chall Readability Formula; df = Degrees of Freedom calculated using Satterthwaite approximation. signifies that abstracts with only 1 to 10 authors are included in the model.
| Metric | Subset | n | Random Effect | beta | CI 95% | t | df | p |
|---|---|---|---|---|---|---|---|---|
| FRE | Yes* | 652357 | Year | -0.17 | [-0.19, -0.14] | -11.3 | 122 | p<10-15 |
| Authors | -0.24 | [-0.26, -0.23] | -30.0 | 651832 | p <10-15 | |||
| No | 707250 | Year | -0.18 | [-0.21, -0.15] | -12.3 | 123 | p <10-15 | |
| Authors | -0.07 | [-0.08, -0.06] | -23.5 | 704922 | p<10-15 | |||
| NDC | Yes* | 652357 | Year | 0.014 | [0.012, 0.015] | 16.5 | 119 | p<10-15 |
| Authors | 0.033 | [0.032, 0.034] | 63.6 | 651516 | p <10-15 | |||
| No | 707250 | Year | 0.016 | [0.014, 0.017] | 19.6 | 118 | p <10-15 | |
| Authors | 0.008 | [0.007, 0.008] | 40.3 | 701014 | p <10-15 |
Additional files
-
Supplementary file 1
Journal information of abstract texts.
- https://doi.org/10.7554/eLife.27725.022
-
Supplementary file 2
Word lists used in analysis (NDC common words, Science common words, General science jargon, Verification list for science common words).
- https://doi.org/10.7554/eLife.27725.023
-
Supplementary file 3
Examples of language preprocessing on abstracts.
- https://doi.org/10.7554/eLife.27725.024
-
Supplementary file 4
Journal information for full text analysis.
- https://doi.org/10.7554/eLife.27725.025
Download links
A two-part list of links to download the article, or parts of the article, in various formats.
Downloads (link to download the article as PDF)
Open citations (links to open the citations from this article in various online reference manager services)
Cite this article (links to download the citations from this article in formats compatible with various reference manager tools)
Research: The readability of scientific texts is decreasing over time
eLife 6:e27725.
https://doi.org/10.7554/eLife.27725


