Science Forum: Unit of analysis issues in laboratory-based research
- University of Warwick, United Kingdom
- University of Sheffield, United Kingdom
- University of Birmingham, United Kingdom
Figures
Figure 1
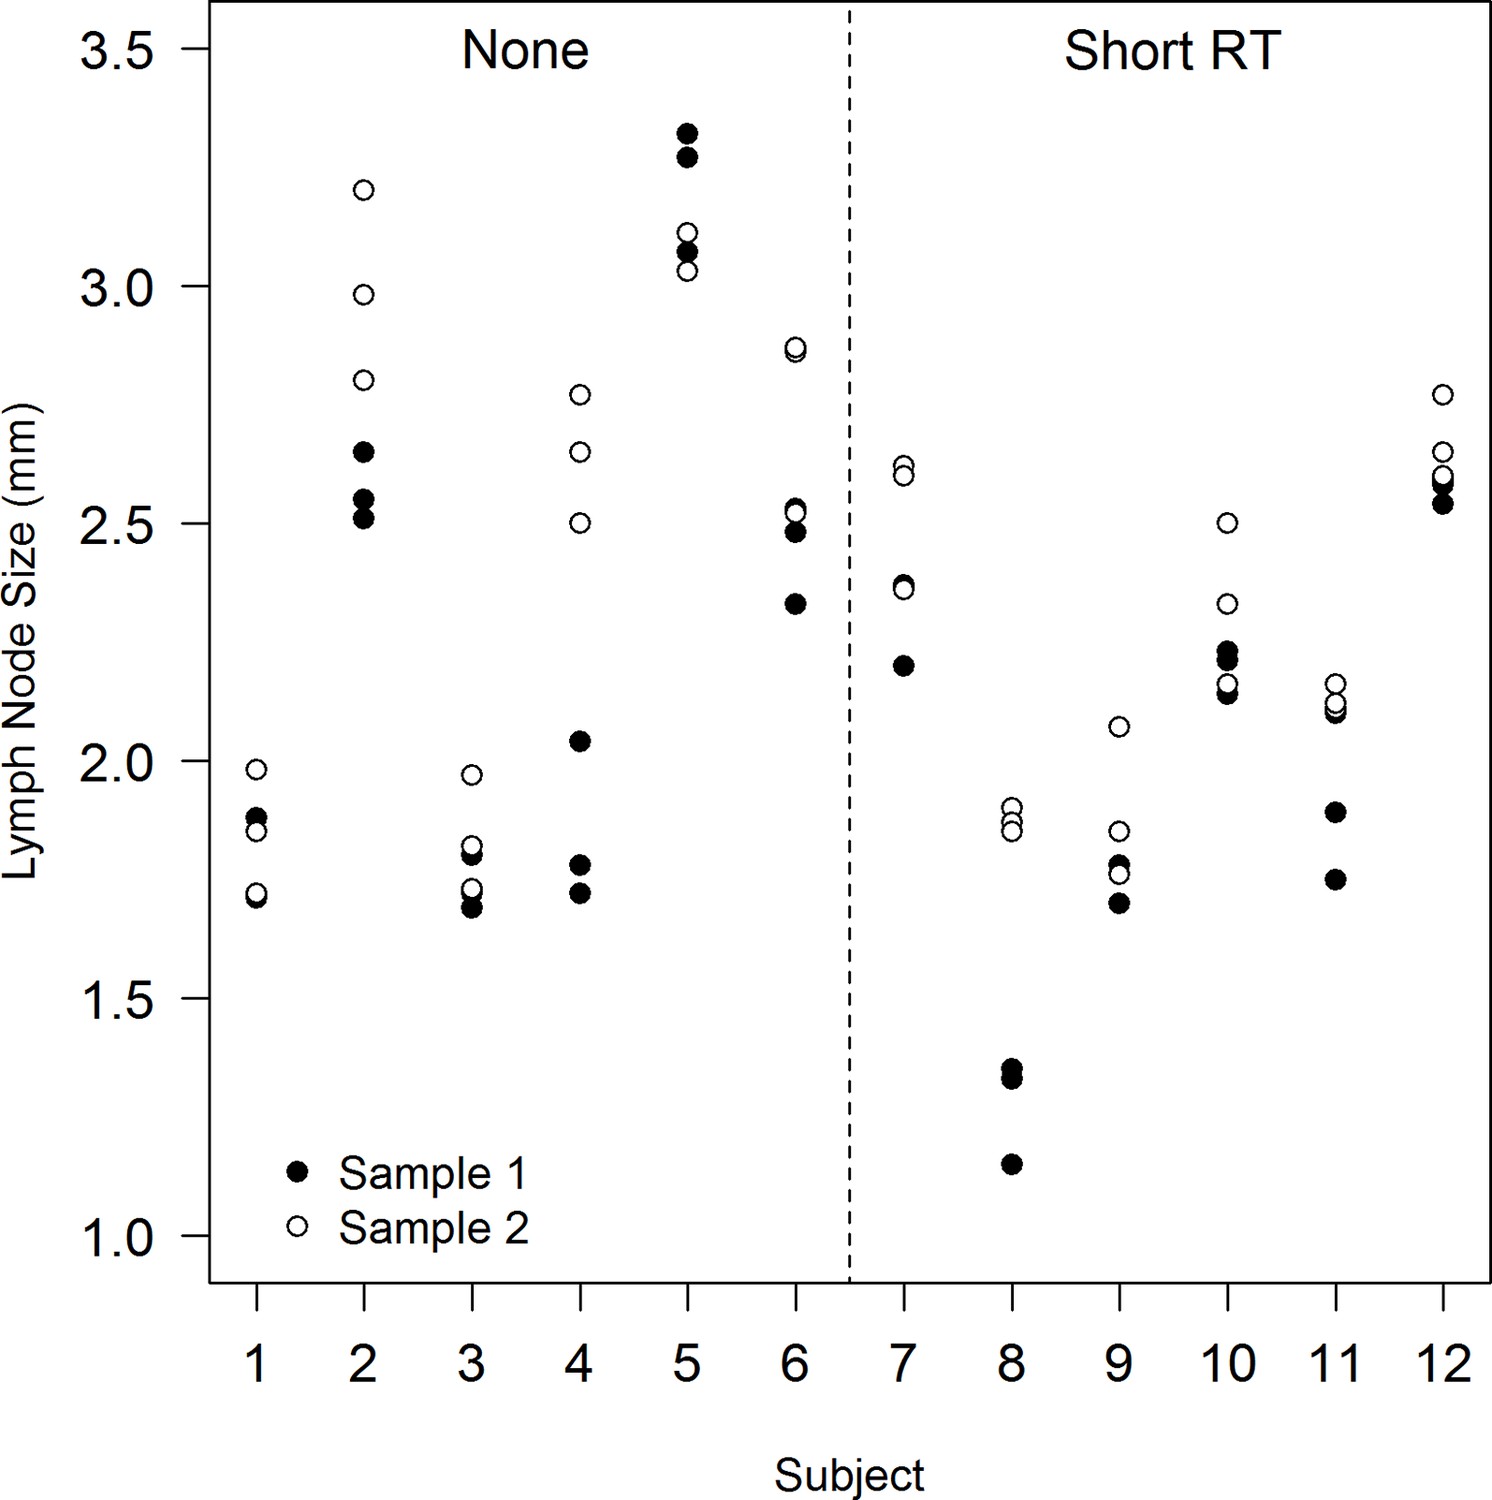
A strip plot showing observed lymph node size data by subject (1-12) and sample, after none and a short course of radiotherapy (Short RT).
https://doi.org/10.7554/eLife.32486.004
Figure 2
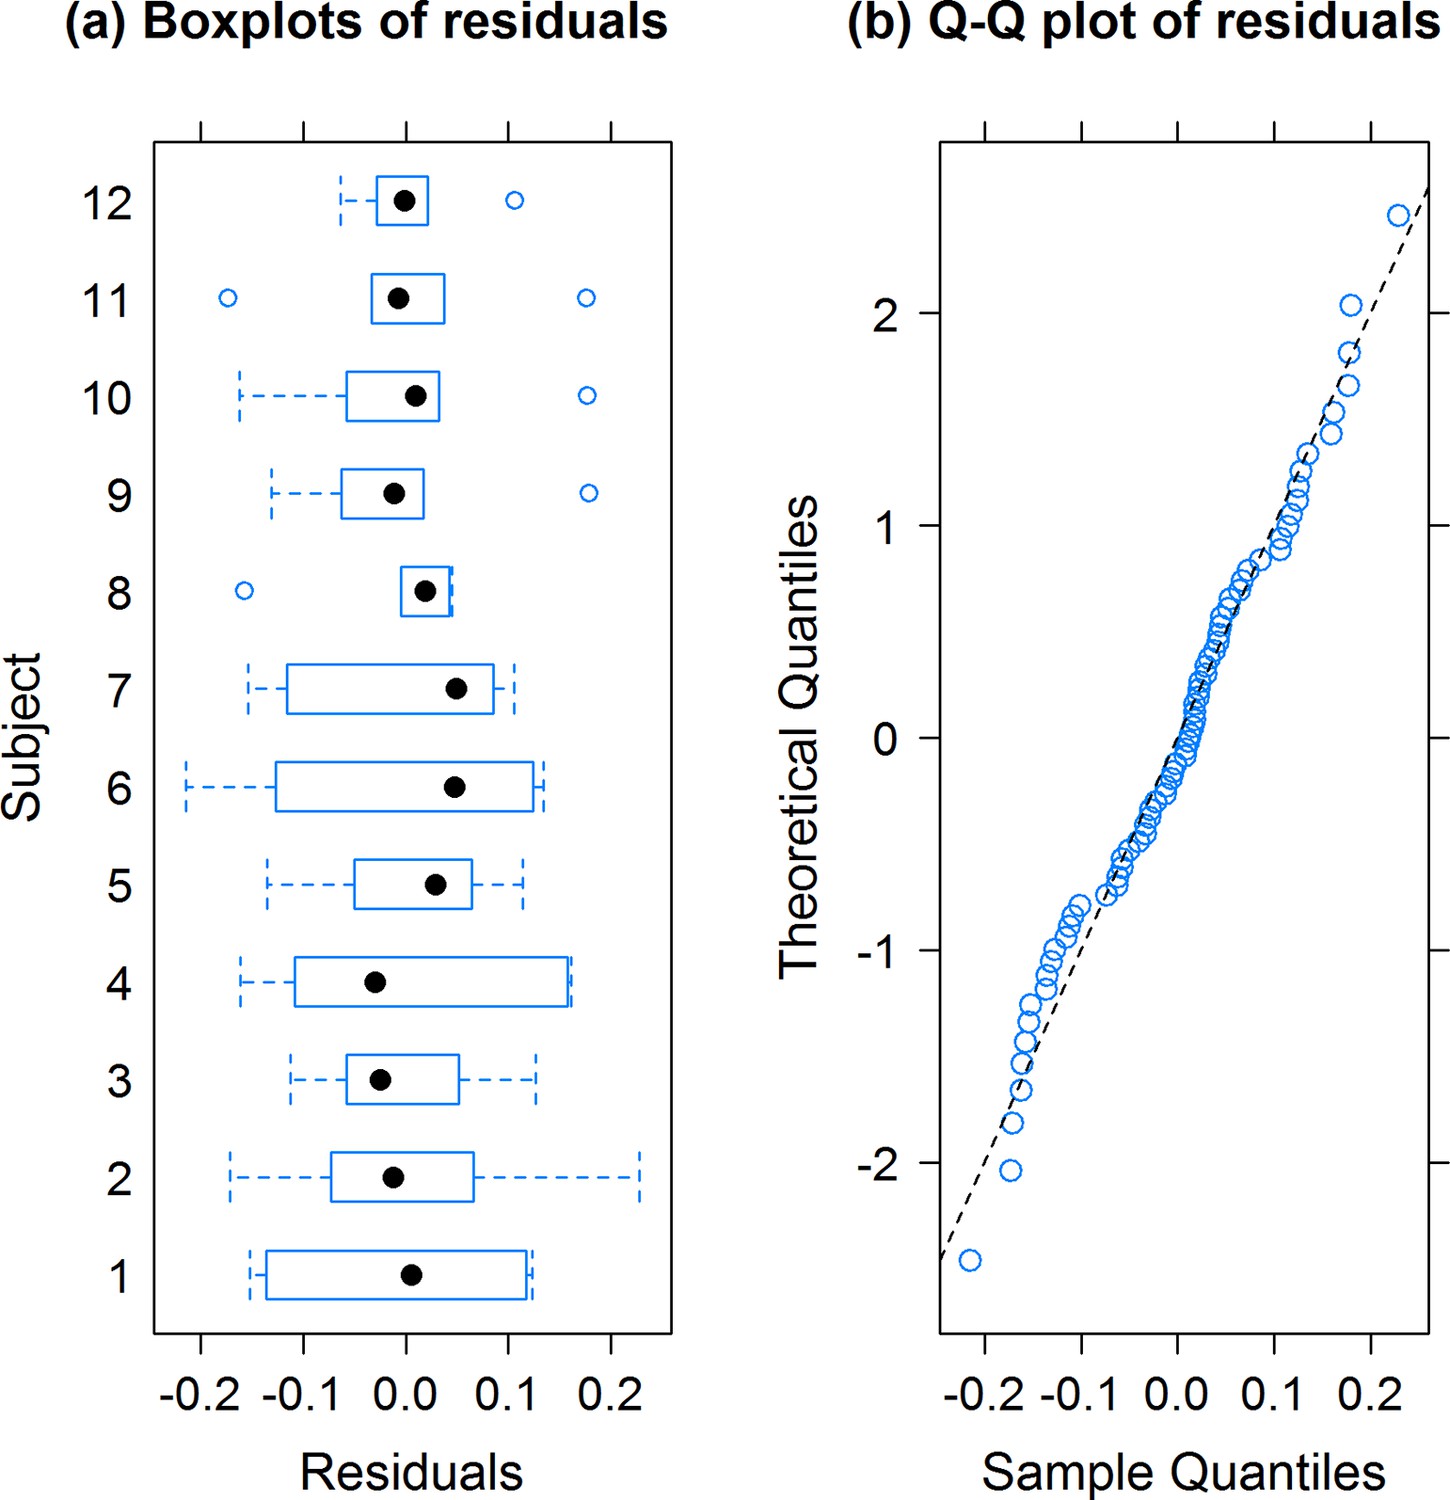
Boxplots of residuals (observed values - fitted values) for each subject; symbols () are medians, boxes are interquartile ranges (IQR), whiskers extend to 1.5IQR and symbols () outside these are suspected outliers (a).
Quantile-quantile (Q–Q) plot of the model residuals () on the horizontal axis against theoretical residuals from a Normal distribution on the vertical axis (b).
Appendix 1—figure 1
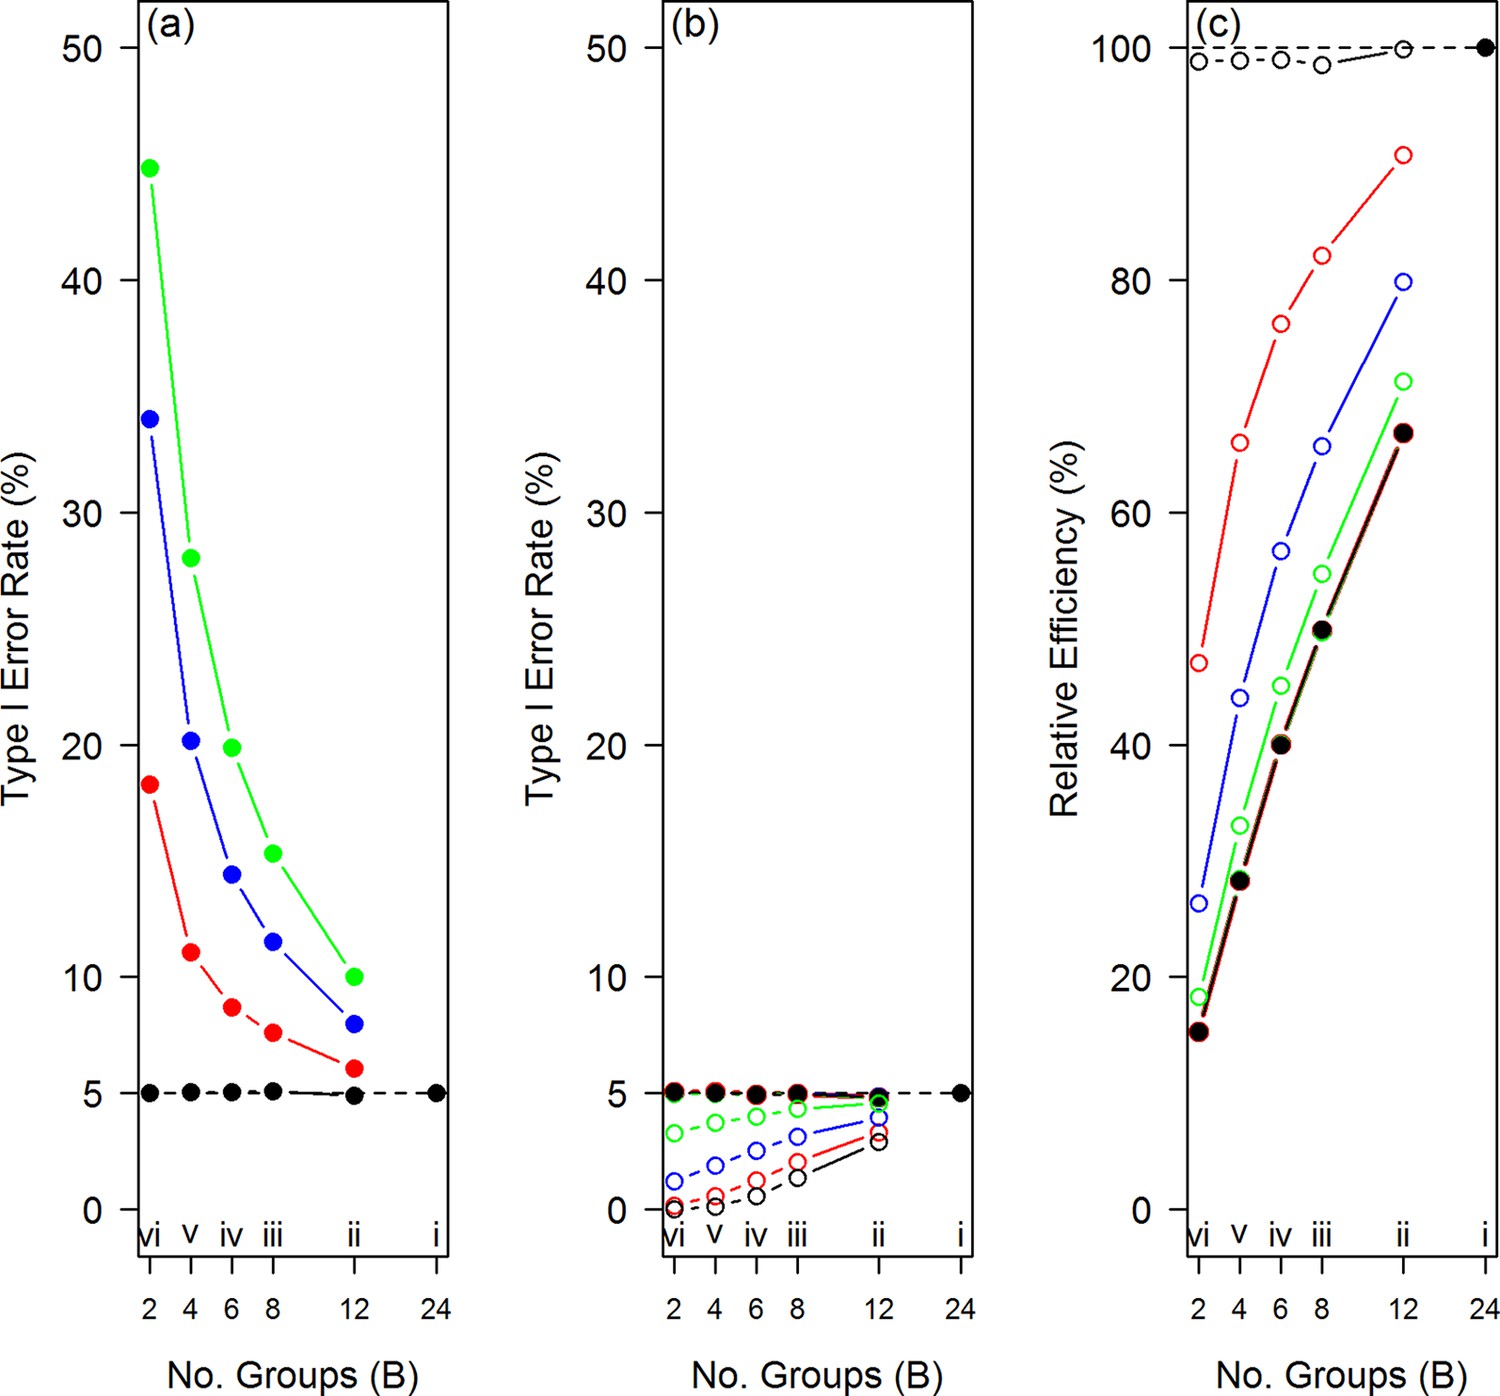
Naive use of a conventional t-test on correlated (grouped by subject) data, = 0 (black circle ), = 0.2 (red circle) = 0.5 (blue circle) and = 0.8 (green circle), inflates the type I error rate (set at 5%).
(a). The type I error rate can be controlled to the required level by randomly selecting a single measurement for each subject, = 0 (black circle), = 0.2 (red circle), = 0.5 (blue circle) and = 0.8 (green circle), or made conservative (5%) by taking the mean of the measurements for each subject, = 0 (black open circle), = 0.2 (red open circle), = 0.5 (blue open circle) and = 0.8 (green open circle) (b). The relative efficiency of treatment effect estimates declines as the number of clusters become smaller and is always higher for the mean than the randomly selected single measurement strategy (c). The scenarios (i) – (vi) are as described in the text.
Appendix 2—figure 1
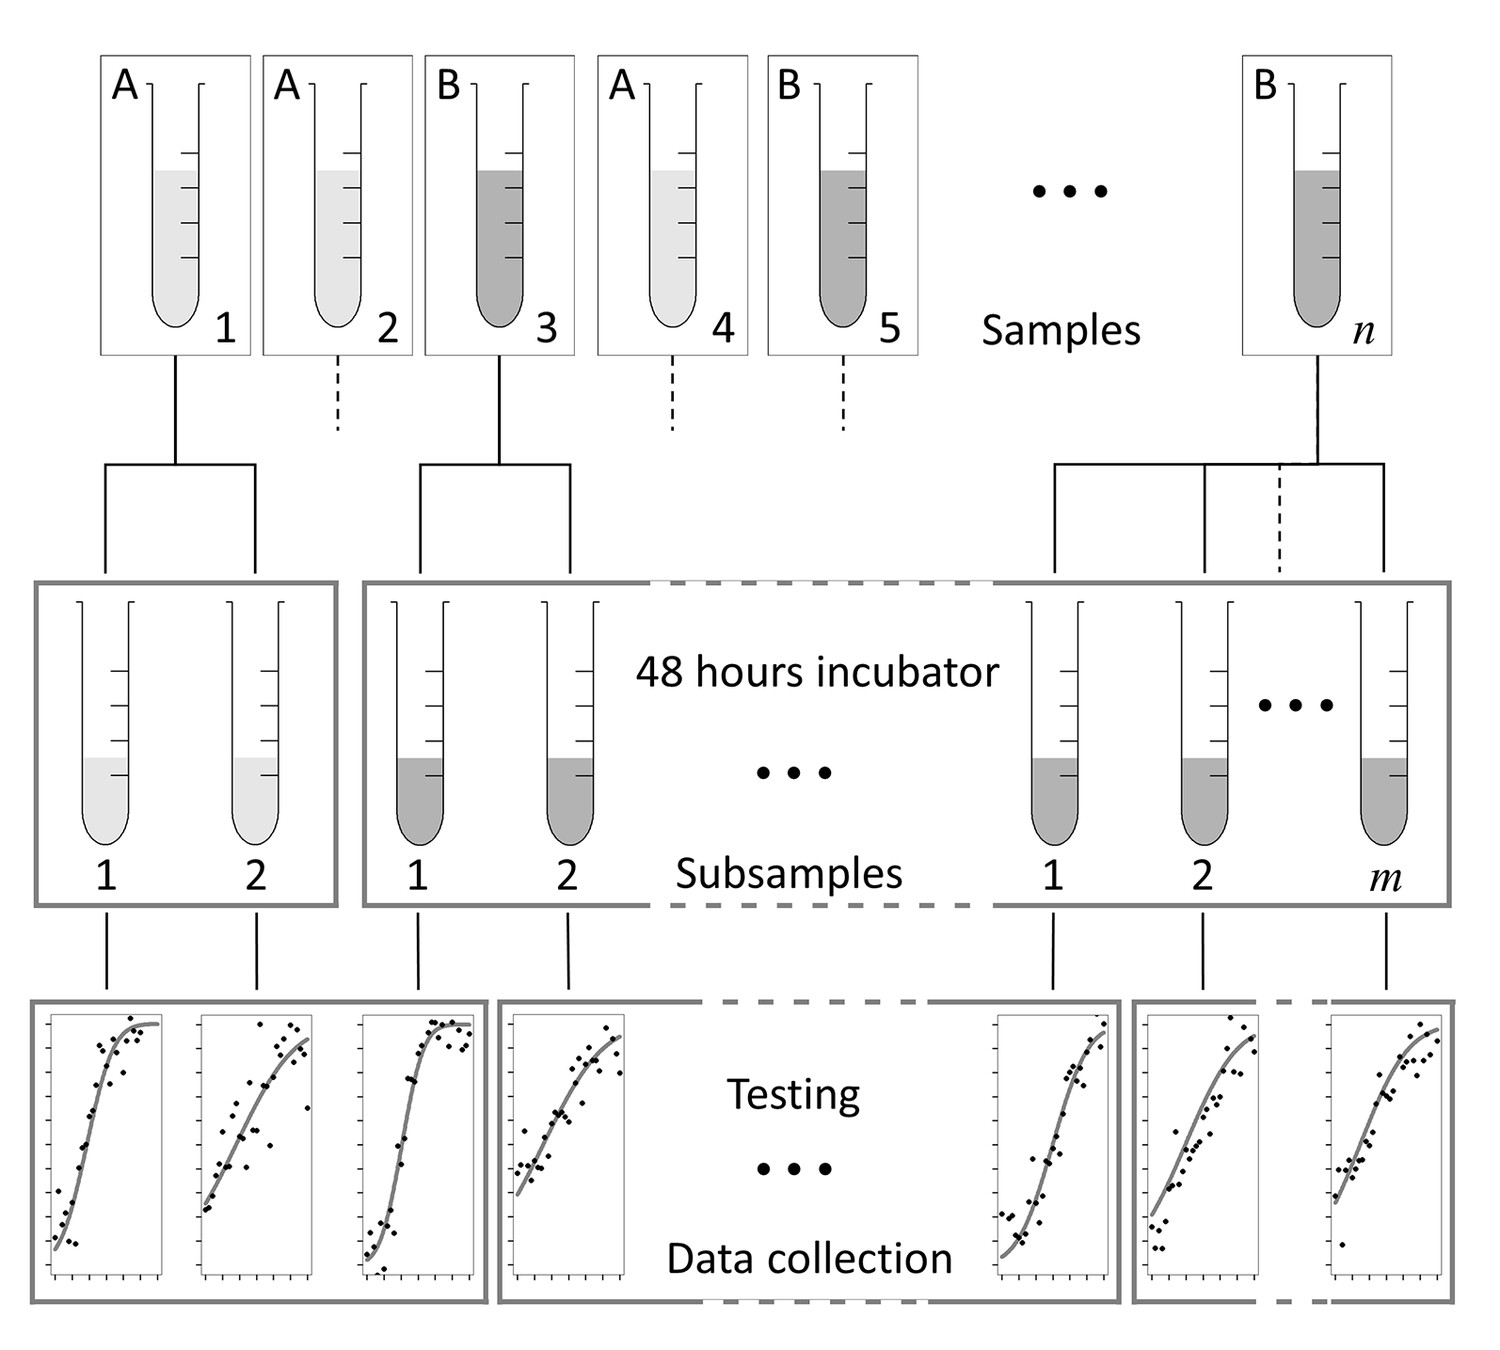
Design options for a putative laboratory study testing samples of experimental material.
https://doi.org/10.7554/eLife.32486.010Tables
Table 1
Variance inflation factors for cluster sizes () 2, 5, 10 and 20, and intraclass correlation coefficients (ICC) 0.01, 0.05, 0.1 and 0.5.
https://doi.org/10.7554/eLife.32486.002| ICC | ||||
|---|---|---|---|---|
| 0.01 | 0.05 | 0.1 | 0.5 | |
| 2 | 1.01 | 1.05 | 1.10 | 1.50 |
| 5 | 1.04 | 1.20 | 1.40 | 3.00 |
| 10 | 1.09 | 1.45 | 1.90 | 5.50 |
| 20 | 1.19 | 1.95 | 2.90 | 10.50 |
Table 2
Lymph node sizes (mm), by sample slice and subject, by radiotherapy (RT) group, subjects 1 to 6 no RT and subjects 7 to 12 short RT; highlighted cells are those removed to unbalance the design.
https://doi.org/10.7554/eLife.32486.003| None | Short RT | ||||||||
|---|---|---|---|---|---|---|---|---|---|
| Subject | Sample | Slice | Subject | Sample | Slice | ||||
| 1 | 2 | 3 | 1 | 2 | 3 | ||||
| 1 | 1 | 1.71 | 1.98 | 1.88 | 7 | 1 | 2.37 | 2.36 | 2.20 |
| 2 | 1.72 | 1.98 | 1.85 | 2 | 2.36 | 2.62 | 2.60 | ||
| 2 | 1 | 2.51 | 2.55 | 2.65 | 8 | 1 | 1.33 | 1.35 | 1.15 |
| 2 | 2.98 | 3.20 | 2.80 | 2 | 1.90 | 1.87 | 1.85 | ||
| 3 | 1 | 1.69 | 1.72 | 1.80 | 9 | 1 | 1.70 | 1.78 | 1.78 |
| 2 | 1.82 | 1.97 | 1.73 | 2 | 2.07 | 1.76 | 1.85 | ||
| 4 | 1 | 1.72 | 1.78 | 2.04 | 10 | 1 | 2.23 | 2.14 | 2.21 |
| 2 | 2.50 | 2.65 | 2.77 | 2 | 2.50 | 2.33 | 2.16 | ||
| 5 | 1 | 3.32 | 3.27 | 3.07 | 11 | 1 | 2.10 | 1.89 | 1.75 |
| 2 | 3.11 | 3.03 | 3.11 | 2 | 2.11 | 2.16 | 2.12 | ||
| 6 | 1 | 2.33 | 2.48 | 2.53 | 12 | 1 | 2.58 | 2.54 | 2.59 |
| 2 | 2.86 | 2.87 | 2.52 | 2 | 2.77 | 2.65 | 2.60 | ||
Table 3
Number of five selected lymph nodes with maximum diameters 2mm, for up to five tissue samples per subject (1-12), after either none or a short course of radiotherapy (Short RT).
https://doi.org/10.7554/eLife.32486.006| None | Short RT | ||||||||||
|---|---|---|---|---|---|---|---|---|---|---|---|
| Subject | Sample | Subject | Sample | ||||||||
| 1 | 2 | 3 | 4 | 5 | 1 | 2 | 3 | 4 | 5 | ||
| 1 | 4 | 4 | - | - | - | 7 | 1 | 0 | 0 | 0 | 0 |
| 2 | 3 | 4 | 5 | 2 | - | 8 | 1 | 2 | - | - | - |
| 3 | 2 | 3 | 3 | 2 | - | 9 | 1 | 0 | 1 | 0 | 2 |
| 4 | 2 | 4 | 1 | 2 | 1 | 10 | 2 | 1 | 4 | 0 | 2 |
| 5 | 3 | 4 | 4 | 3 | 5 | 11 | 4 | 2 | 4 | 3 | 3 |
| 6 | 2 | 5 | 5 | 3 | 3 | 12 | 3 | 4 | 3 | - | - |
Download links
A two-part list of links to download the article, or parts of the article, in various formats.
Downloads (link to download the article as PDF)
Open citations (links to open the citations from this article in various online reference manager services)
Cite this article (links to download the citations from this article in formats compatible with various reference manager tools)
Science Forum: Unit of analysis issues in laboratory-based research
eLife 7:e32486.
https://doi.org/10.7554/eLife.32486


