Increasing plant diversity with border crops reduces insecticide use and increases crop yield in urban agriculture
- Shanghai Academy of Agricultural Sciences, Shanghai Key Laboratory of Protected Horticultural Technology, Shanghai Engineering Research Centre of Low-carbon Agriculture, China
- Shanghai Chongming Dongtan Wetland Ecosystem Research Station, Institute of Biostatistics, Shanghai Institute of Eco-Chongming, (SIEC), Fudan University, China
- Chongming Agricultural Technology Extension and Service Center, China
- Shanghai Agricultural Technology Extension and Service Center, China
- Climate Center of Shanghai, China
- Zhejiang University, China
- University of Copenhagen, Denmark
Figures
Figure 1
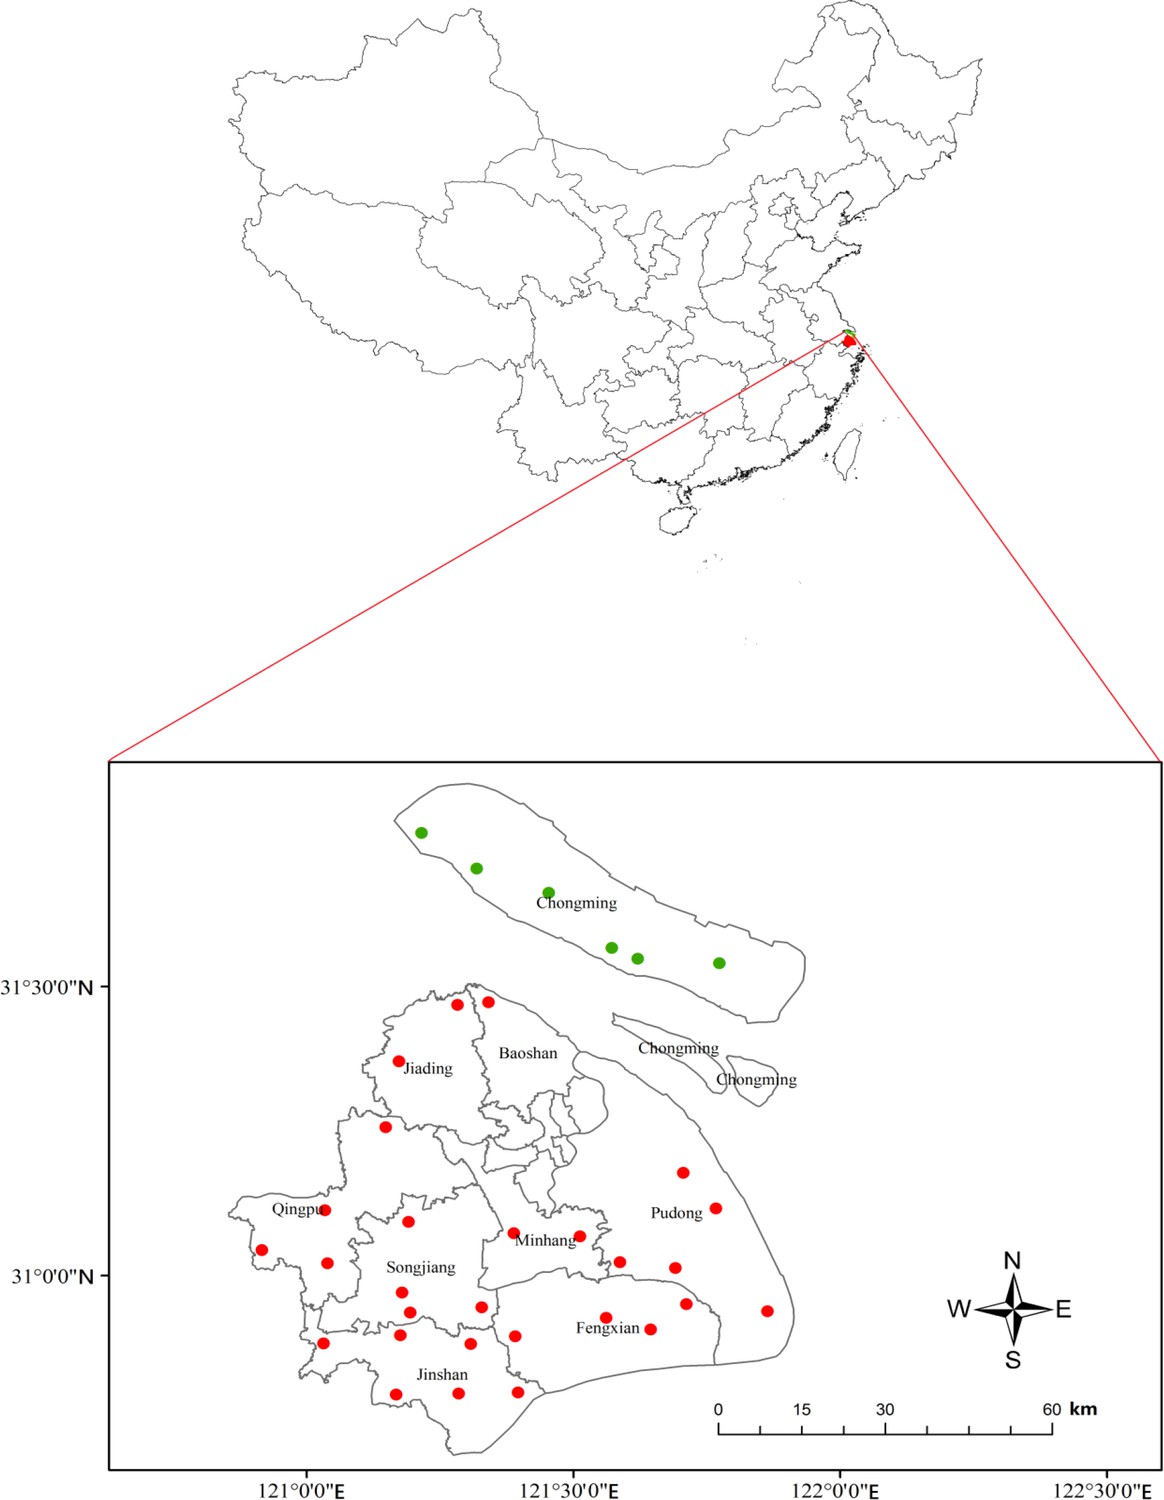
Twenty-eight mono-rice (red dots) and six plant-diversified community farms (green dots) monitored in Shanghai, China.
https://doi.org/10.7554/eLife.35103.002-
Figure 1—source data 1
Site, rice pest and predator populations, insecticide use, and yield data for comparison of plant-diversified farms (treatment) and mono-rice farms (control) in Shanghai, China.
- https://doi.org/10.7554/eLife.35103.003
-
Figure 1—source data 2
Chemical insecticides applied to control the main insect pests on plant-diversified farms and mono-rice farms in Shanghai, China from 2001 to 2015.
The crosses indicate, for each insecticide, when they were used.
- https://doi.org/10.7554/eLife.35103.004
Figure 2
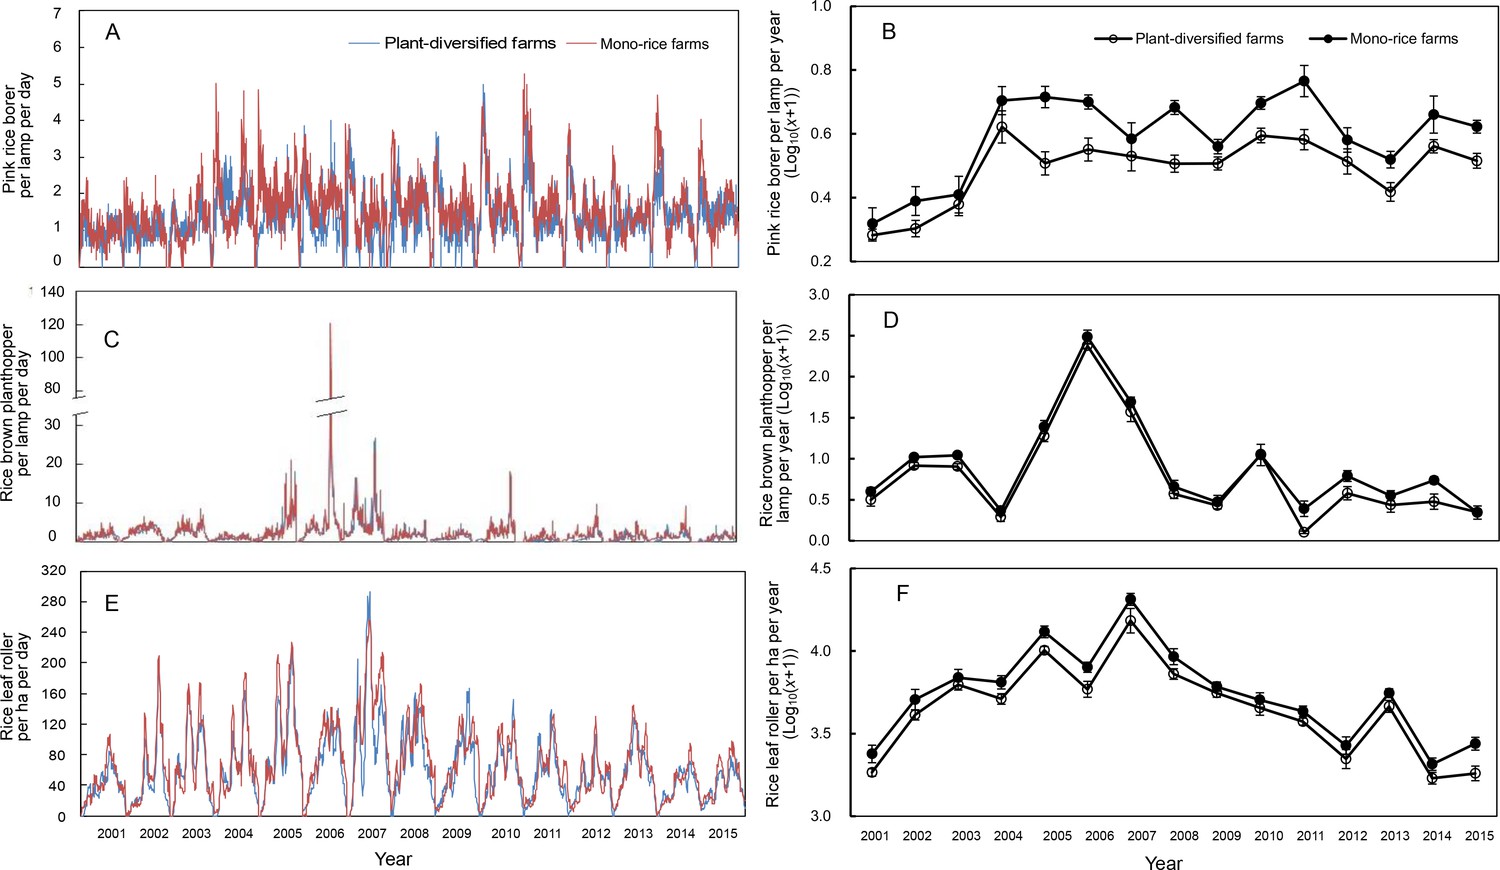
Population dynamics of pink rice borer and brown planthopper trapped in the lamp and rice leaf roller observed in rice fields on plant-diversified and mono-rice farms from 2001 to 2015.
(A) and (B) Pink rice borer; (C) and (D) Rice brown planthopper; (E) and (F) Rice leaf roller. The blue and red lines (in Figure 6A, C and E) indicate the plant-diversified and mono-rice farms, respectively. Vertical bars on each point denote SE. From 2001 to 2015, the number of trapped pink rice borers and rice brown planthoppers, and the population densities of rice leaf rollers were monitored from 10 April to 30 September, 11 May to 30 September, and 11 June to 20 September, respectively.
-
Figure 2—source data 1
Pink rice borer: mean and standard deviation (individual per lamp per year) from the 15 year monitoring data, stratified by year and farm type.
- https://doi.org/10.7554/eLife.35103.006
-
Figure 2—source data 2
Rice brown planthopper: mean and standard deviation (individual per lamp per year) from the 15 year monitoring data, stratified by year and farm type.
- https://doi.org/10.7554/eLife.35103.007
-
Figure 2—source data 3
Rice leaf roller: mean and standard deviation (individual per ha per year) from the 15 year monitoring data, stratified by year and farm type.
- https://doi.org/10.7554/eLife.35103.008
-
Figure 2—source data 4
Economic Injury Levels of pink rice borers, rice brown planthoppers and rice leaf rollers issued by Shanghai Agricultural Technology Extension and Service Center (SATESC).
‘/' denotes that there is no Economic Injury Level for rice leaf roller in grain-filling stage of rice.
- https://doi.org/10.7554/eLife.35103.009
Figure 3

Abundance of predators observed on plant-diversified and mono-rice farms for each year.
Abundance of predators in the rice fields was sampled at an interval of 15–20 days (with minor variation due to weather conditions) from seedling stage to grain stage from 2007 to 2015. Vertical bars on each point denote SE.
-
Figure 3—source data 1
Predator abundances: mean and standard deviation (individual per 100 rice clusters per year) from the 15 year monitoring data, stratified by year and farm type.
- https://doi.org/10.7554/eLife.35103.011
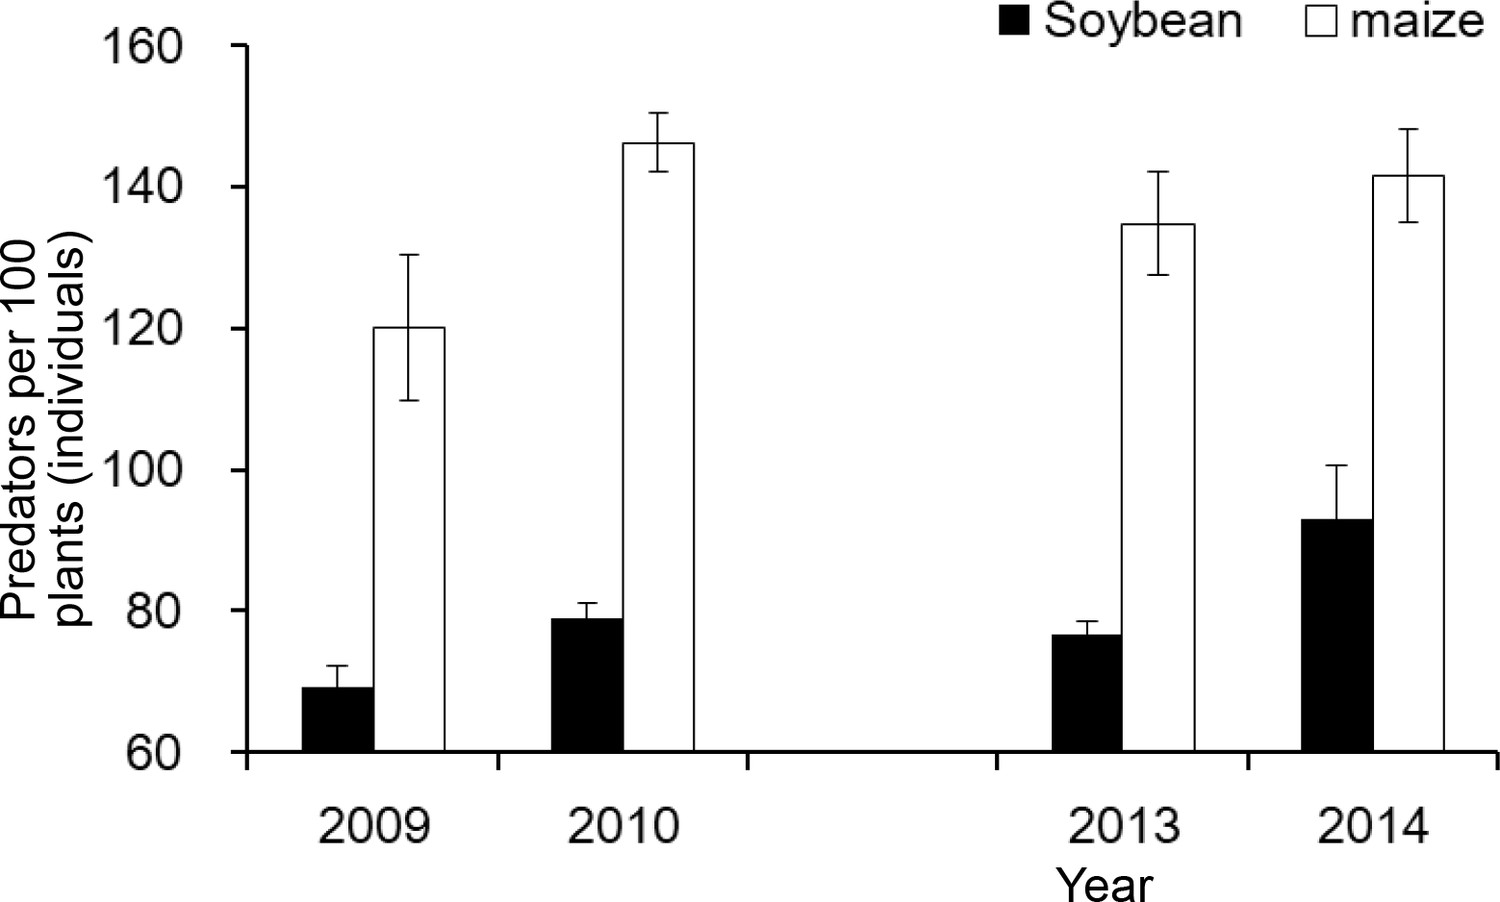
Figure 4

Predator abundance on the border crop of soybeans and neighboring crops (maize, eggplant and Chinese cabbage) on plant-diversified farms.
(A) Predator abundance in different years; and (B) Predator abundance on four crops (soybean, maize, eggplant and Chinese cabbage). Abundance of predators (ladybird beetles, lacewings and spiders) were monitored in soybeans from 2007 to 2014 and in neighboring crops (maize, eggplant and Chinese cabbage) during 2009–2011 and 2013–2014. Vertical bars on each point denote SE.
Figure 5
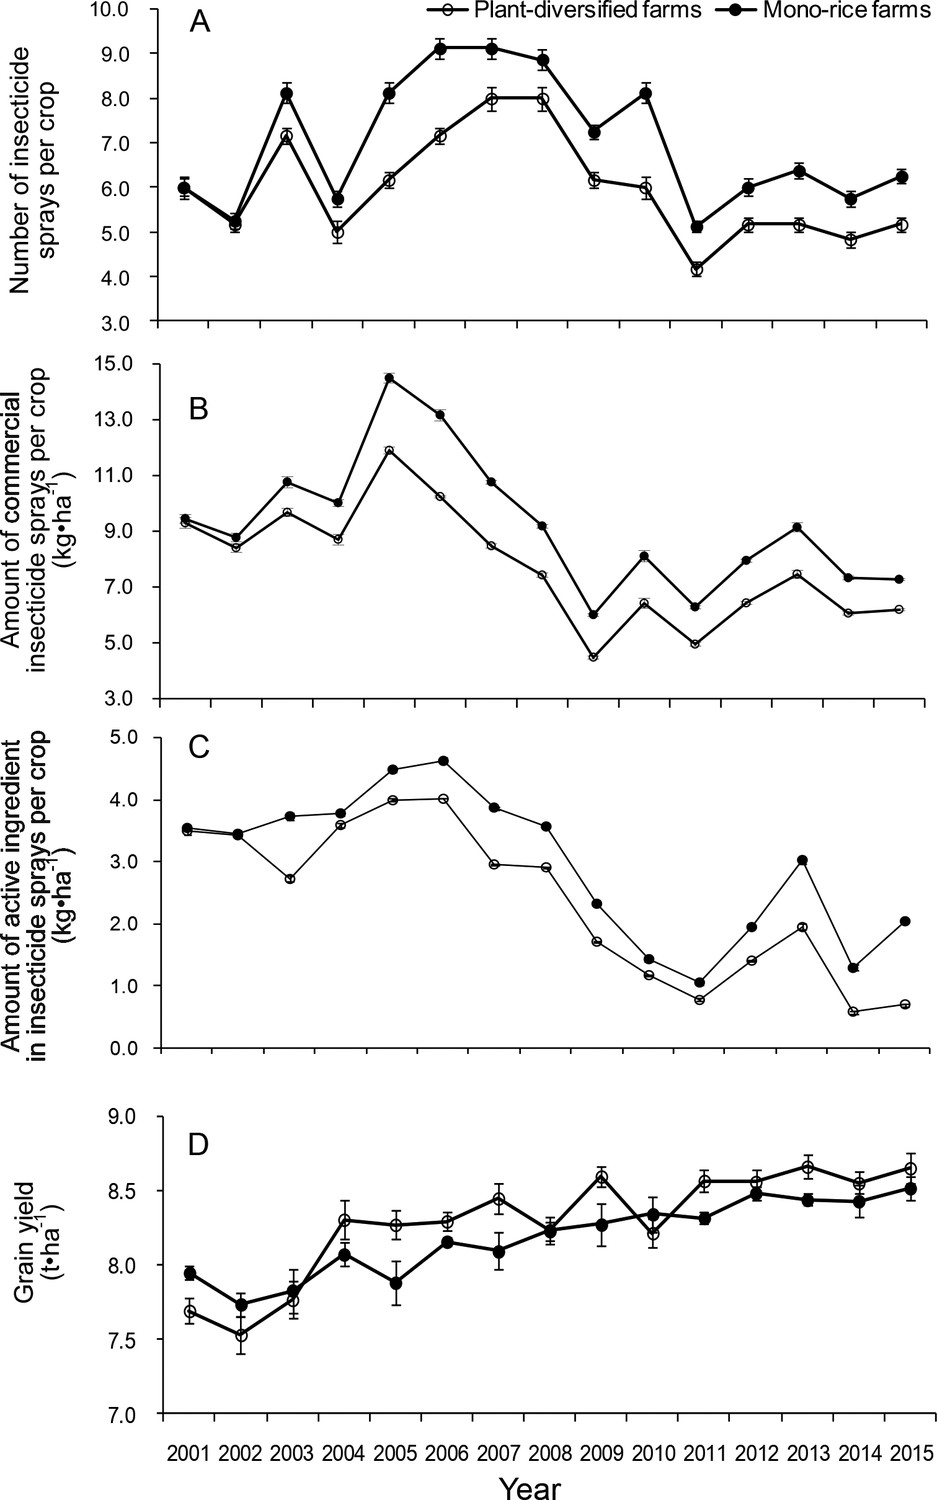
Dynamics of the number of insecticide sprays, the amount of insecticide sprayed and grain yield per crop on plant-diversified and mono-rice farms from 2001 to 2015.
(A) Number of insecticide sprays; (B) Amount of commercial insecticide sprayed (kg•ha−1); (C) Amount of active ingredient in insecticide sprayed (kg•ha−1); and (D) Grain yield (t•ha−1). Vertical bars on each point denote SE.
-
Figure 5—source data 1
The amount of commercial insecticide and active ingredient sprayed per crop: mean and standard deviation (kg•ha−1) from the 15 year monitoring data, stratified by year and farm type.
- https://doi.org/10.7554/eLife.35103.014
-
Figure 5—source data 2
The number of insecticide spray per crop: mean and standard deviation from the 15 year monitoring data, stratified by year and farm type.
- https://doi.org/10.7554/eLife.35103.015
-
Figure 5—source data 3
Cost–benefit analysis of plant-diversified farms compared with mono-rice farms.
All data are mean values from 2001 to 2015; average grain price is 2.163 RMB per kilogram, and average soybean price is 3.873 RMB per kilogram; about 3% of one-hectare rice field was taken by soybeans in the field ridge, and soybean yield is about 25.0 kilograms per hectare rice field. Means ± SE.
- https://doi.org/10.7554/eLife.35103.016
-
Figure 5—source data 4
Grain yield: mean and standard deviation (kg•ha−1) from the 15 year monitoring data, stratified by year and farm type.
- https://doi.org/10.7554/eLife.35103.017
Figure 6 with 1 supplement

Effects of plant diversification in experiment in which plant-diversified with mono-rice farming were compared at the same locations.
(A) Density of rice plant-hoppers sampled in rice field plots; (B) Density of rice stem borers sampled in rice field plots; (C) Density of rice leaf rollers sampled in rice field plots; (D) Density of the predators (ladybird beetles, lacewings and spiders) sampled in rice field plots; (E) Amount of insecticide sprays per rice field plot (kg•ha−1); and (F) Grain yield per rice field (t•ha−1). Vertical bars denote SE.
-
Figure 6—source data 1
Stem borer: mean and standard deviation (individual per 100 rice clusters) from the common-location-experiments, stratified by year, farm identity, and farm type.
- https://doi.org/10.7554/eLife.35103.020
-
Figure 6—source data 2
Rice plant-hopper: mean and standard deviation (individual per 100 rice clusters) from the common-location-experiments, stratified by year, farm identity, and farm type.
- https://doi.org/10.7554/eLife.35103.021
-
Figure 6—source data 3
Leaf roller: mean and standard deviation (individual per 100 rice clusters) from the common-location-experiments, stratified by year, farm identity, and farm type.
- https://doi.org/10.7554/eLife.35103.022
-
Figure 6—source data 4
Predator: mean and standard deviation (individual per 100 rice clusters) from the common-location-experiments, stratified by year, farm identity, and farm type.
- https://doi.org/10.7554/eLife.35103.023
-
Figure 6—source data 5
Insecticide amount: mean and standard deviation (kg•ha−1) from the common-location-experiments, stratified by year, farm identity, and farm type.
- https://doi.org/10.7554/eLife.35103.024
-
Figure 6—source data 6
Yield: mean and standard deviation (kg•ha−1) from the common-location-experiments, stratified by year, farm identity, and farm type.
- https://doi.org/10.7554/eLife.35103.025
Figure 6—figure supplement 1
Predator abundance in the border crop of soybeans and in the neighboring crop of maize sampled in rice field plots.
Vertical bars denote SE.
Figure 7
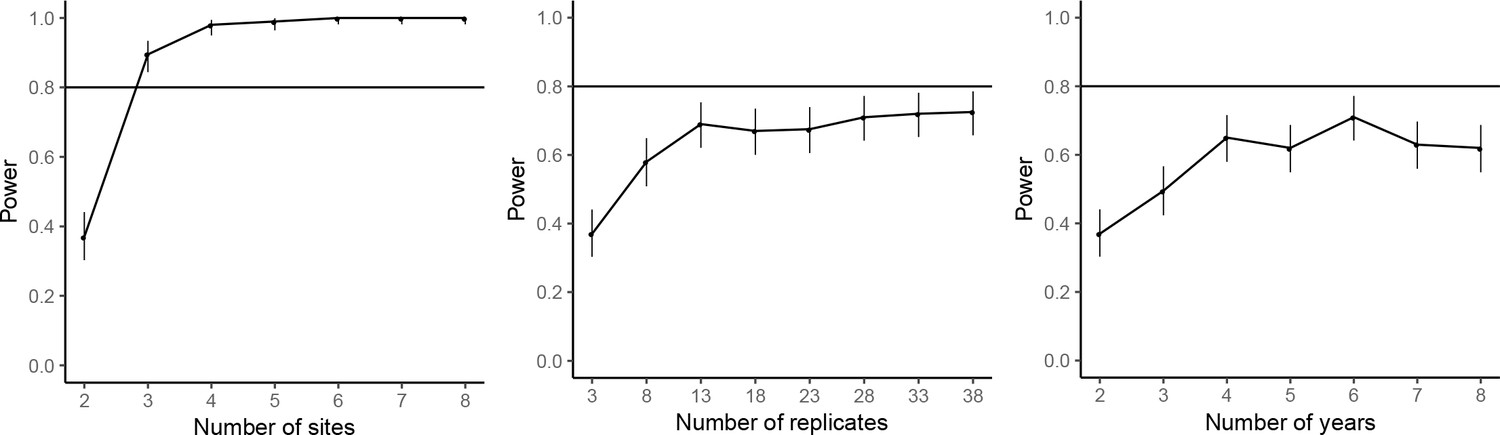
Power analysis results for rice plant-hopper occurrence, where the power are estimated for additional experimental sites (left), additional replicates for each farm type–site–year block (middle), and additional years (right), based on the effect size estimated by the mixed-effect model fitted to the common-location experiment data.
The horizontal line marks the standard power level of 80%. Vertical line denotes the 95% confidence interval for the power estimates.
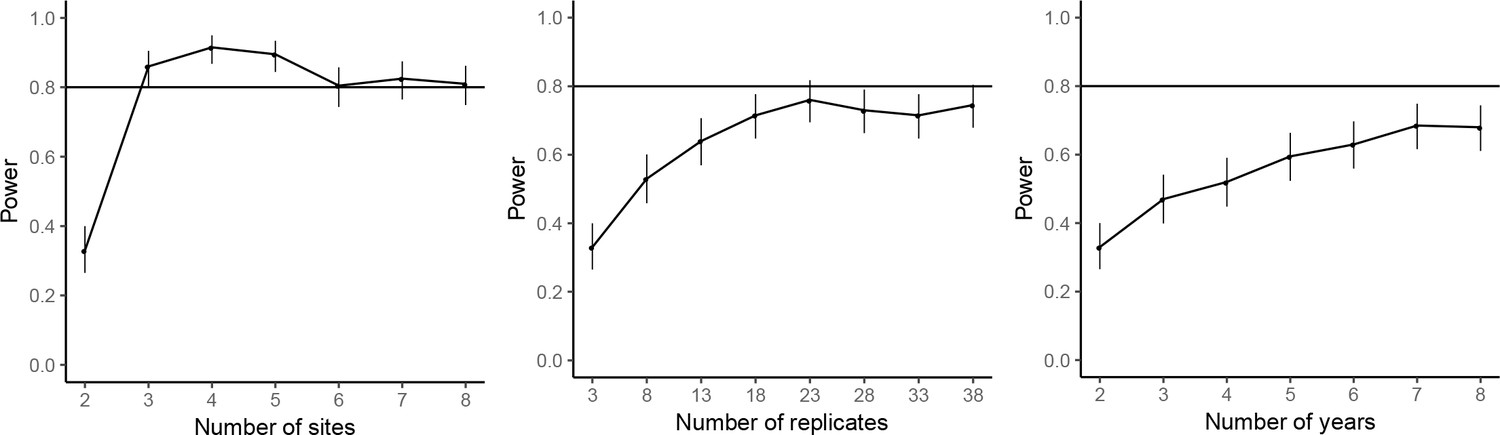
Figure 8

Power analysis results for rice leaf roller occurrence.
See caption of Figure 7—figure supplement 1 for details.
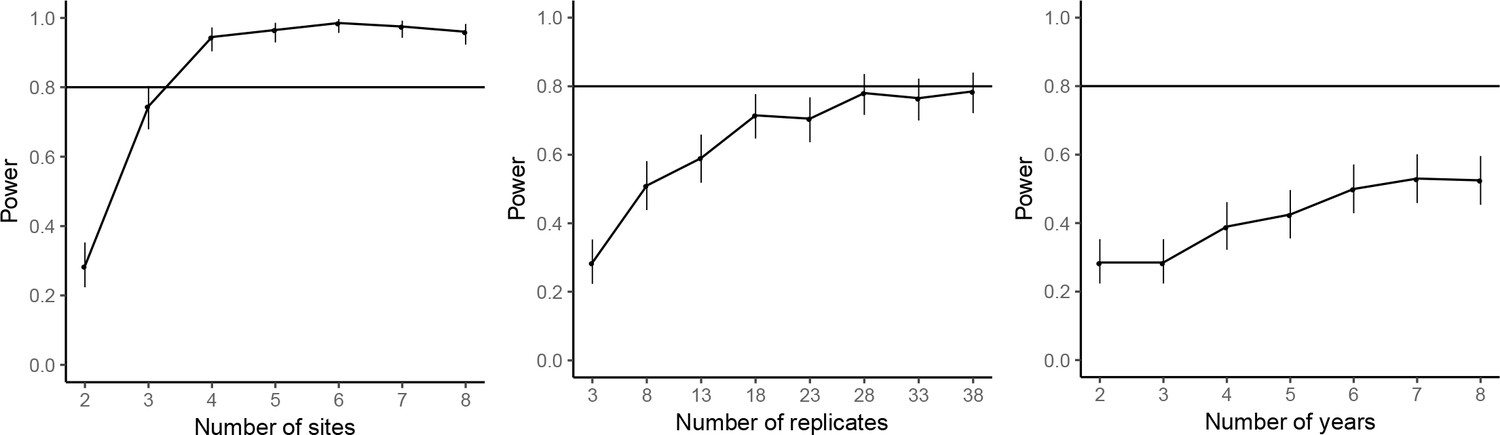
Figure 9
Power analysis results for predator abundance.
See caption of Figure 7—figure supplement 1 for details.
Figure 10
Power analysis results for grain yield.
See caption of Figure 7—figure supplement 1 for details.
Figure 11
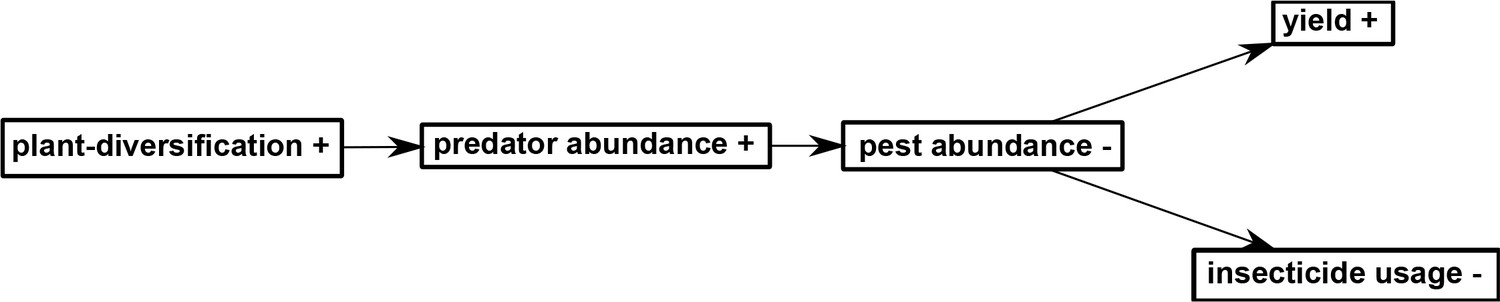
A path diagram depicting the hypothesis on the relationships among the variables considered in this study.
‘+' indicates increased level and '-' indicates decreased level.
Figure 12
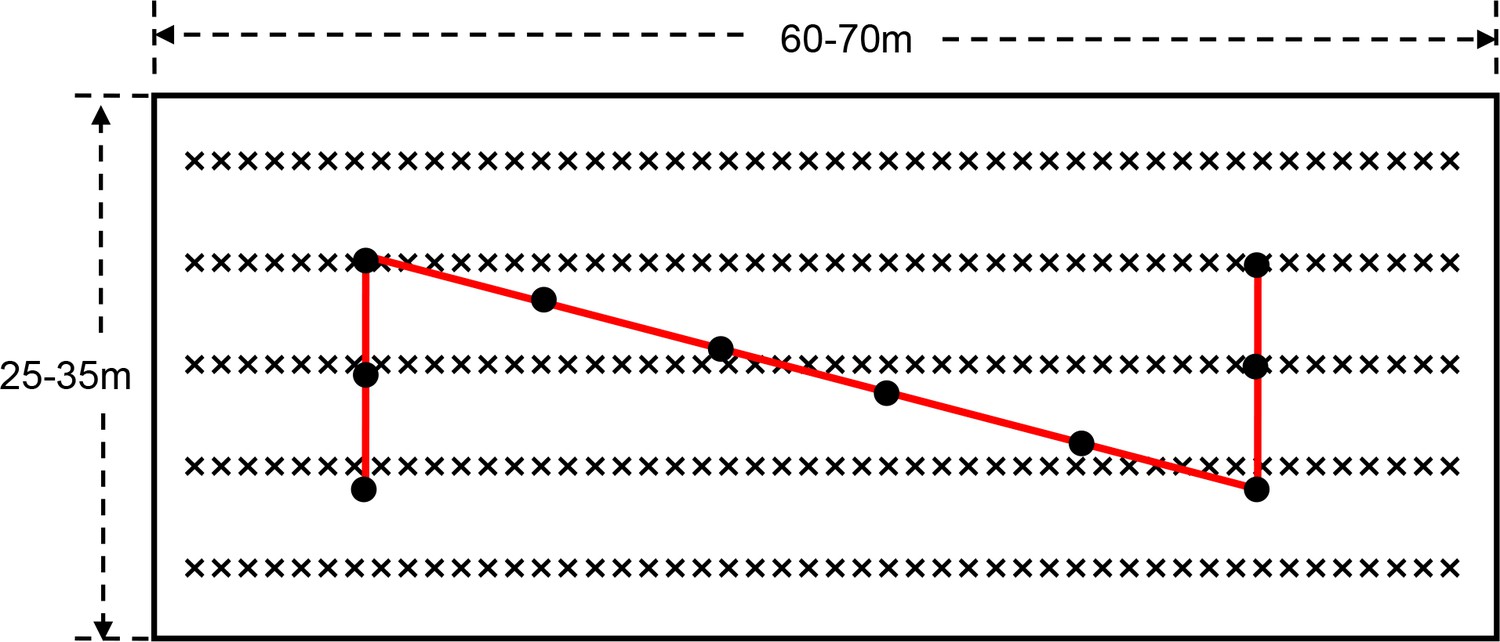
The layout of each rice plots in each community farm and ‘Z’-style grain yield sampling.
On each farm, the rice growing area was divided into nine paddy plots, which were 60–70 × 25–35 m on each plot. Three to six rice field plots of 0.120–0.167 hectares were selected in each community farm to measure the grain yield each year. The rice plants at harvest stage (‘Z’-style sampling with 10, one square meter subplots in each plot) were mowed and threshed, and the grain yield per unit area was obtained. ‘×' and black solid dots denoted rice, and 1 m2 sampling areas for rice grain yield, respectively. The interval between two adjacent black solid dots was about five meters.
Figure 13
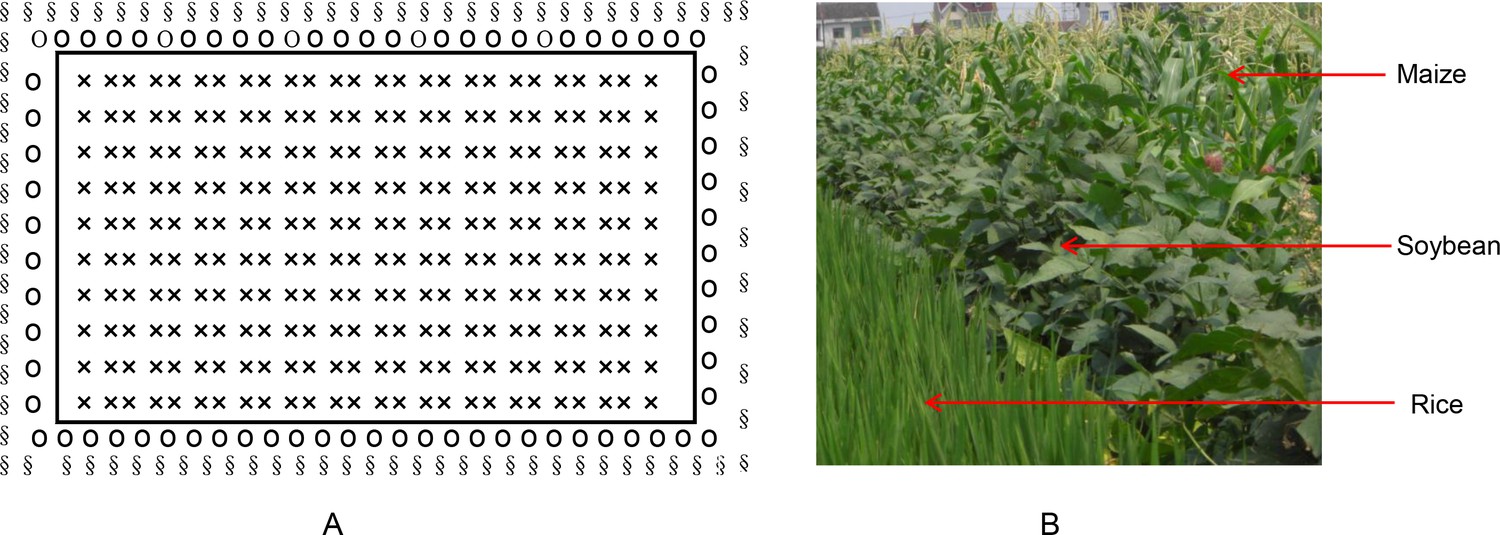
The layout of plant-diversified fields in which a border crop (soybean) was interplanted around the rice fields and a neighboring crop (maize) was interplanted around the soybeans.
(A) Drawing plot diagram for plant-diversified fields; and (B) the photograph for plant-diversified fields. ‘×', ‘o’ and ‘§' denoted rice, soybean and maize, respectively. The layout of each control rice field was similar, but without soybeans or maize.
Author response image 1
Author response image 2
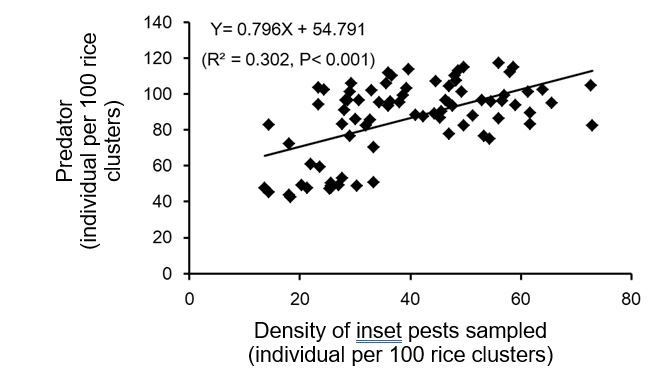
The correlation between number of insect pests and number of predators in rice field plots.
Here insect pests included rice planthoppers, rice stem borers, and rice leaf rollers; predators were involved in ladybird beetles, lacewings and spiders.
Additional files
-
Transparent reporting form
- https://doi.org/10.7554/eLife.35103.033
Download links
A two-part list of links to download the article, or parts of the article, in various formats.
Downloads (link to download the article as PDF)
Open citations (links to open the citations from this article in various online reference manager services)
Cite this article (links to download the citations from this article in formats compatible with various reference manager tools)
Increasing plant diversity with border crops reduces insecticide use and increases crop yield in urban agriculture
eLife 7:e35103.
https://doi.org/10.7554/eLife.35103


