Meta-analysis challenges a textbook example of status signalling and demonstrates publication bias
- Max Planck Institute for Ornithology, Germany
- Imperial College London, United Kingdom
- University of New South Wales, Australia
- University of Sheffield, United Kingdom
- Bielefeld University, Germany
- Hungarian Academy of Sciences, Hungary
- University of Pannonia, Hungary
- University of Kentucky, United States
Figures
Figure 1
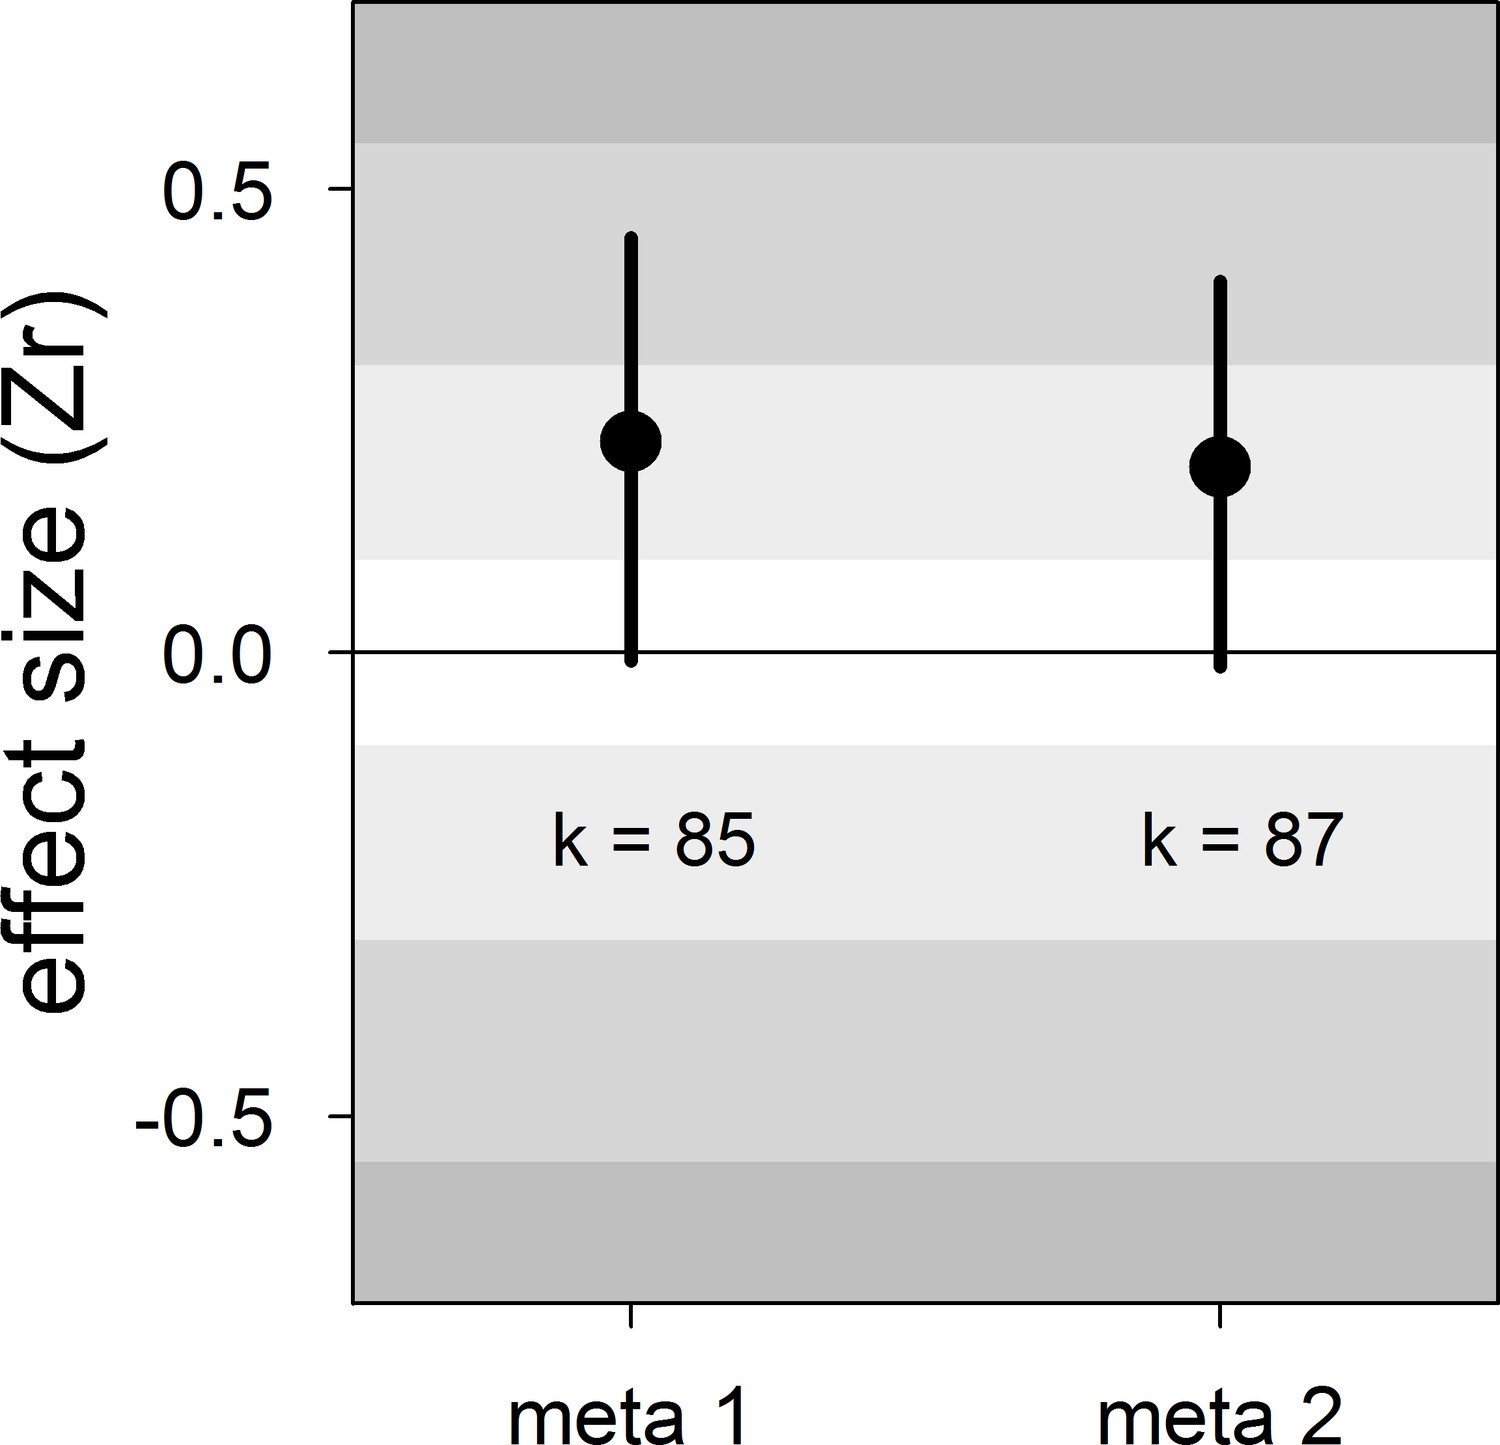
Forest plot showing the across-study effect size for the relationship between dominance rank and bib size in male house sparrows.
Both meta 1 and meta 2 include published and unpublished estimates, with meta 2 including two non-reported estimates assumed to be zero (see section ‘Meta-analyses’). We show posterior means and 95% credible intervals from multilevel meta-analyses. Estimates are presented as standardized effect sizes using Fisher’s transformation (Zr). Light, medium and dark grey show small, medium and large effect sizes, respectively (Cohen, 1988). k is the number of estimates.
Figure 2
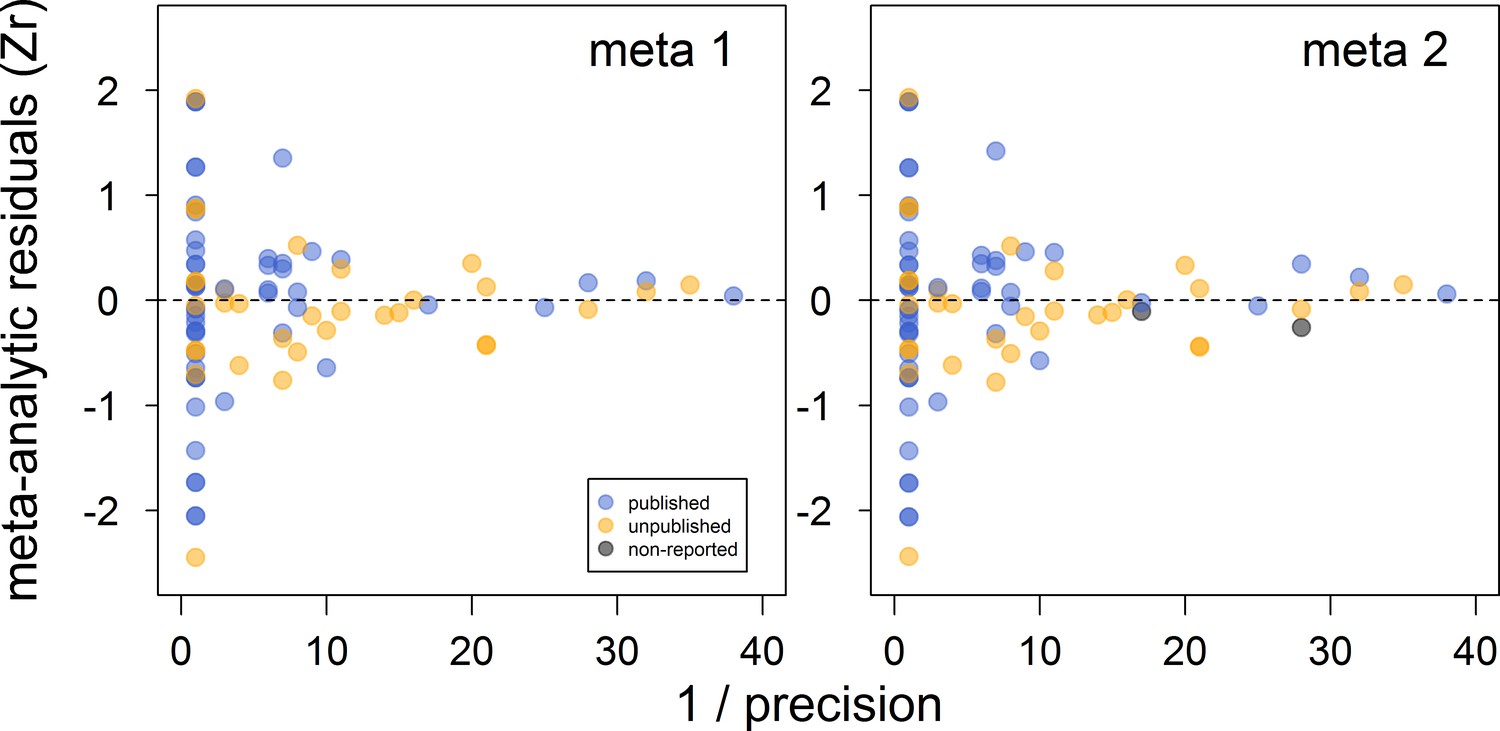
Funnel plots of the meta-analytic residuals against their precision for the meta-analyses used to test the across-study relationship between dominance rank and bib size in male house sparrows.
Both meta 1 and meta 2 include published (blue) and unpublished (orange) estimates, with meta 2 including two additional non-reported estimates (grey; see section ‘Meta-analyses’). Estimates are presented as standardized effect sizes using Fisher’s transformation (Zr). Precision = square root of the inverse of the variance.
Figure 3
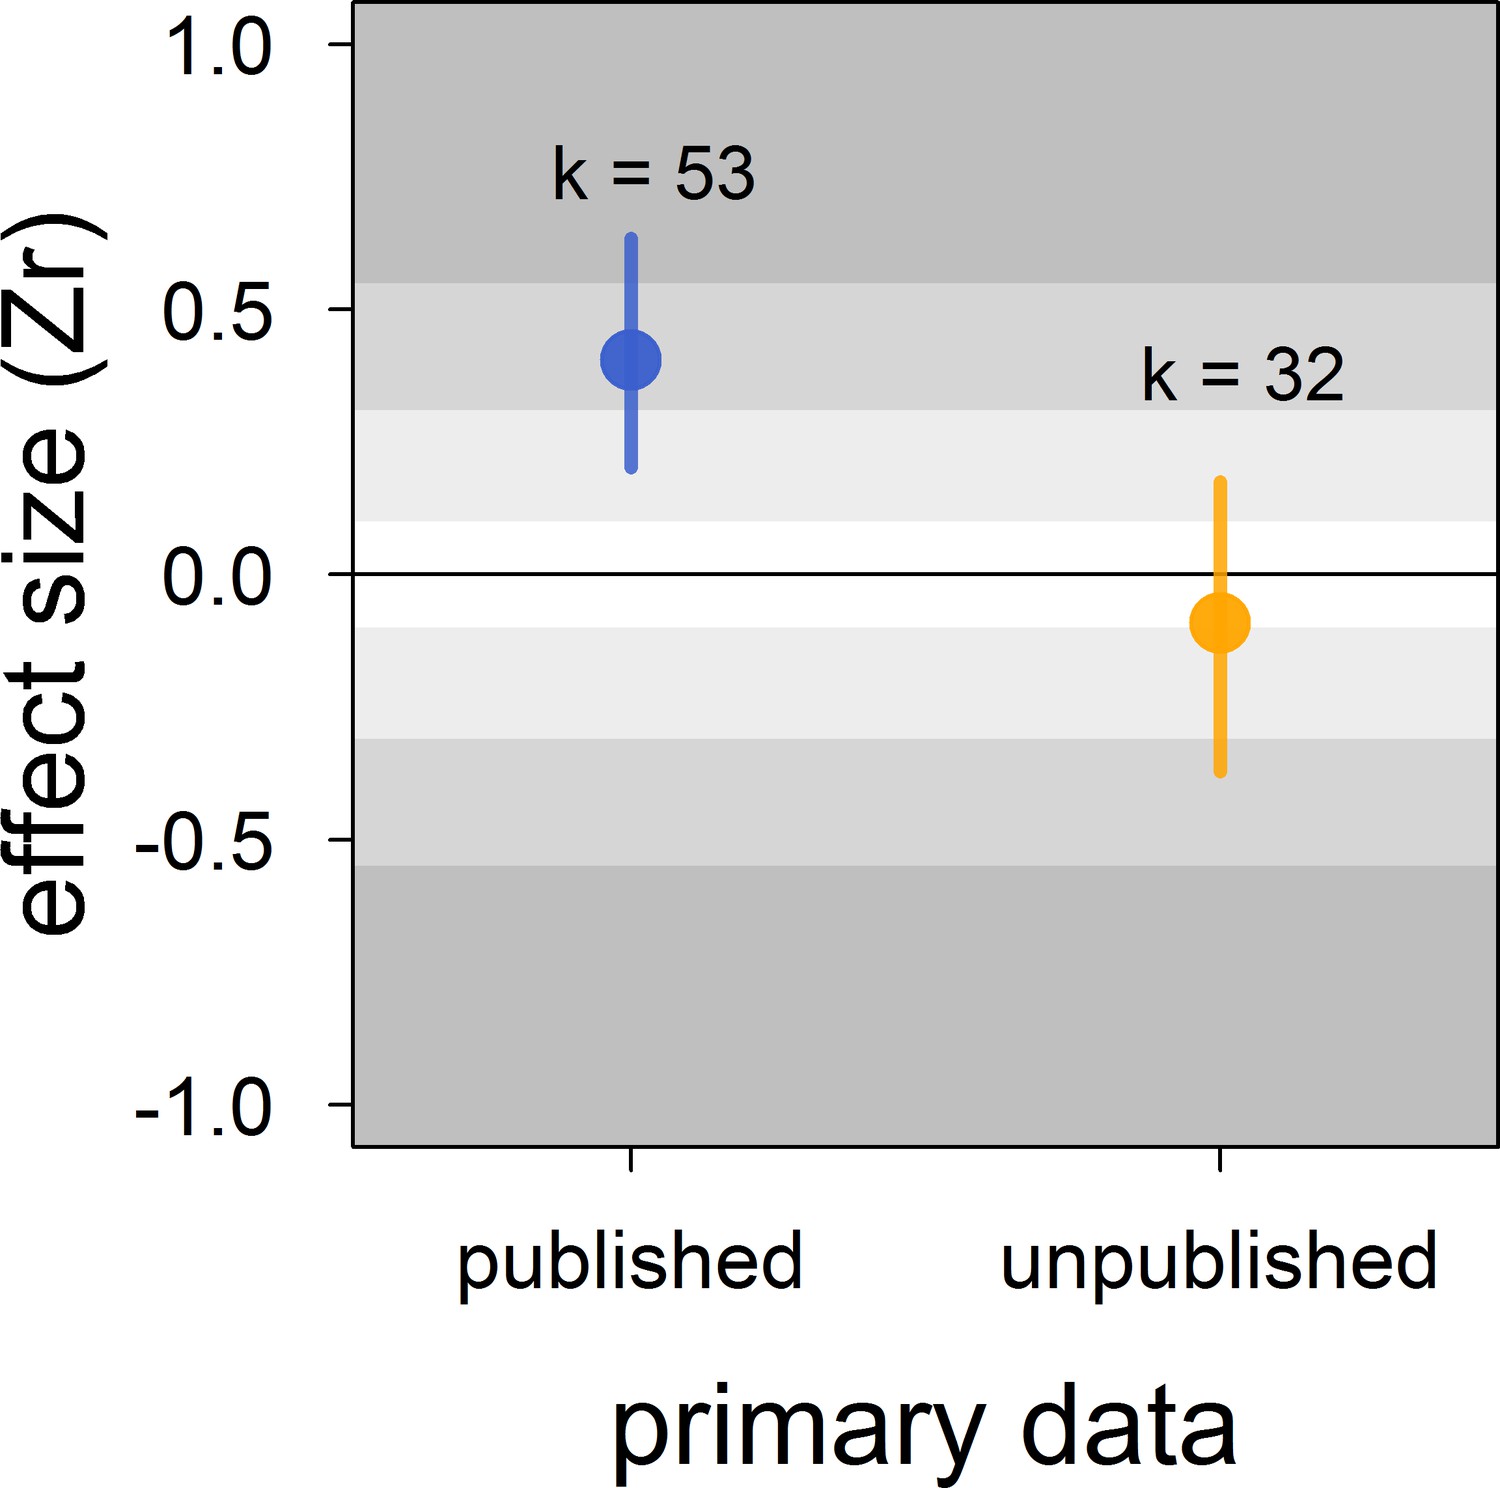
Published effect sizes for the status signalling hypothesis in male house sparrows are larger than unpublished ones.
We show posterior means and 95% credible intervals from a multilevel meta-regression. Estimates are presented as standardized effect sizes using Fisher’s transformation (Zr). Light, medium and dark grey show small, medium and large effects sizes, respectively (Cohen, 1988). k is the number of estimates.
Figure 4
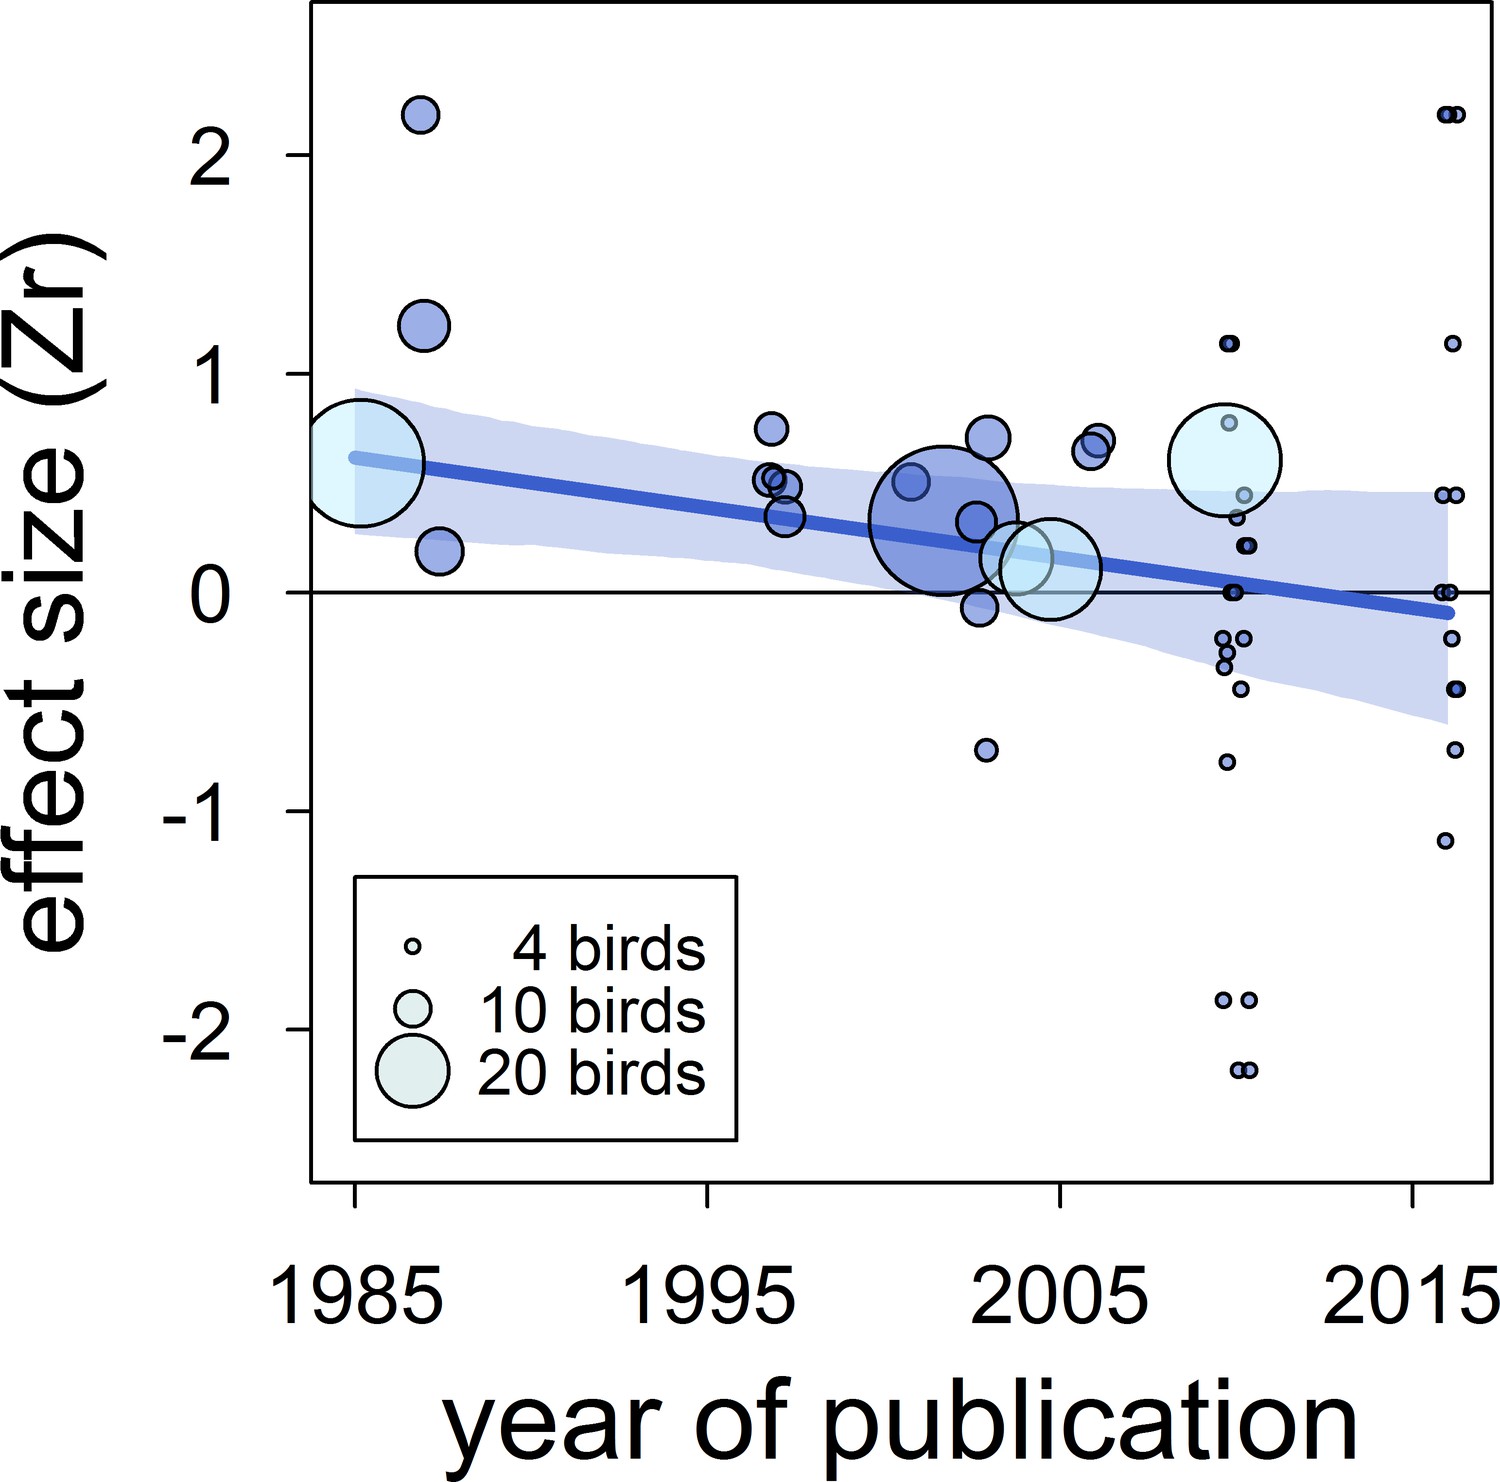
The overall published effect size for the status signalling hypothesis in male house sparrows has decreased over time since first described (k = 53 estimates from 12 publications).
The solid blue line represents the model estimate, and the shading shows the 95% credible intervals of a multilevel meta-regression based on published studies (see section ‘Detection of publication bias’). Estimates are presented as standardized effect sizes using Fisher’s transformation (Zr). Circle area represents the size of the group of birds tested to obtain each estimate, where light blue denotes estimates for which group size is inflated due to birds from different groups being pooled, as opposed to dark blue where group size is accurate.
Appendix 2—figure 1
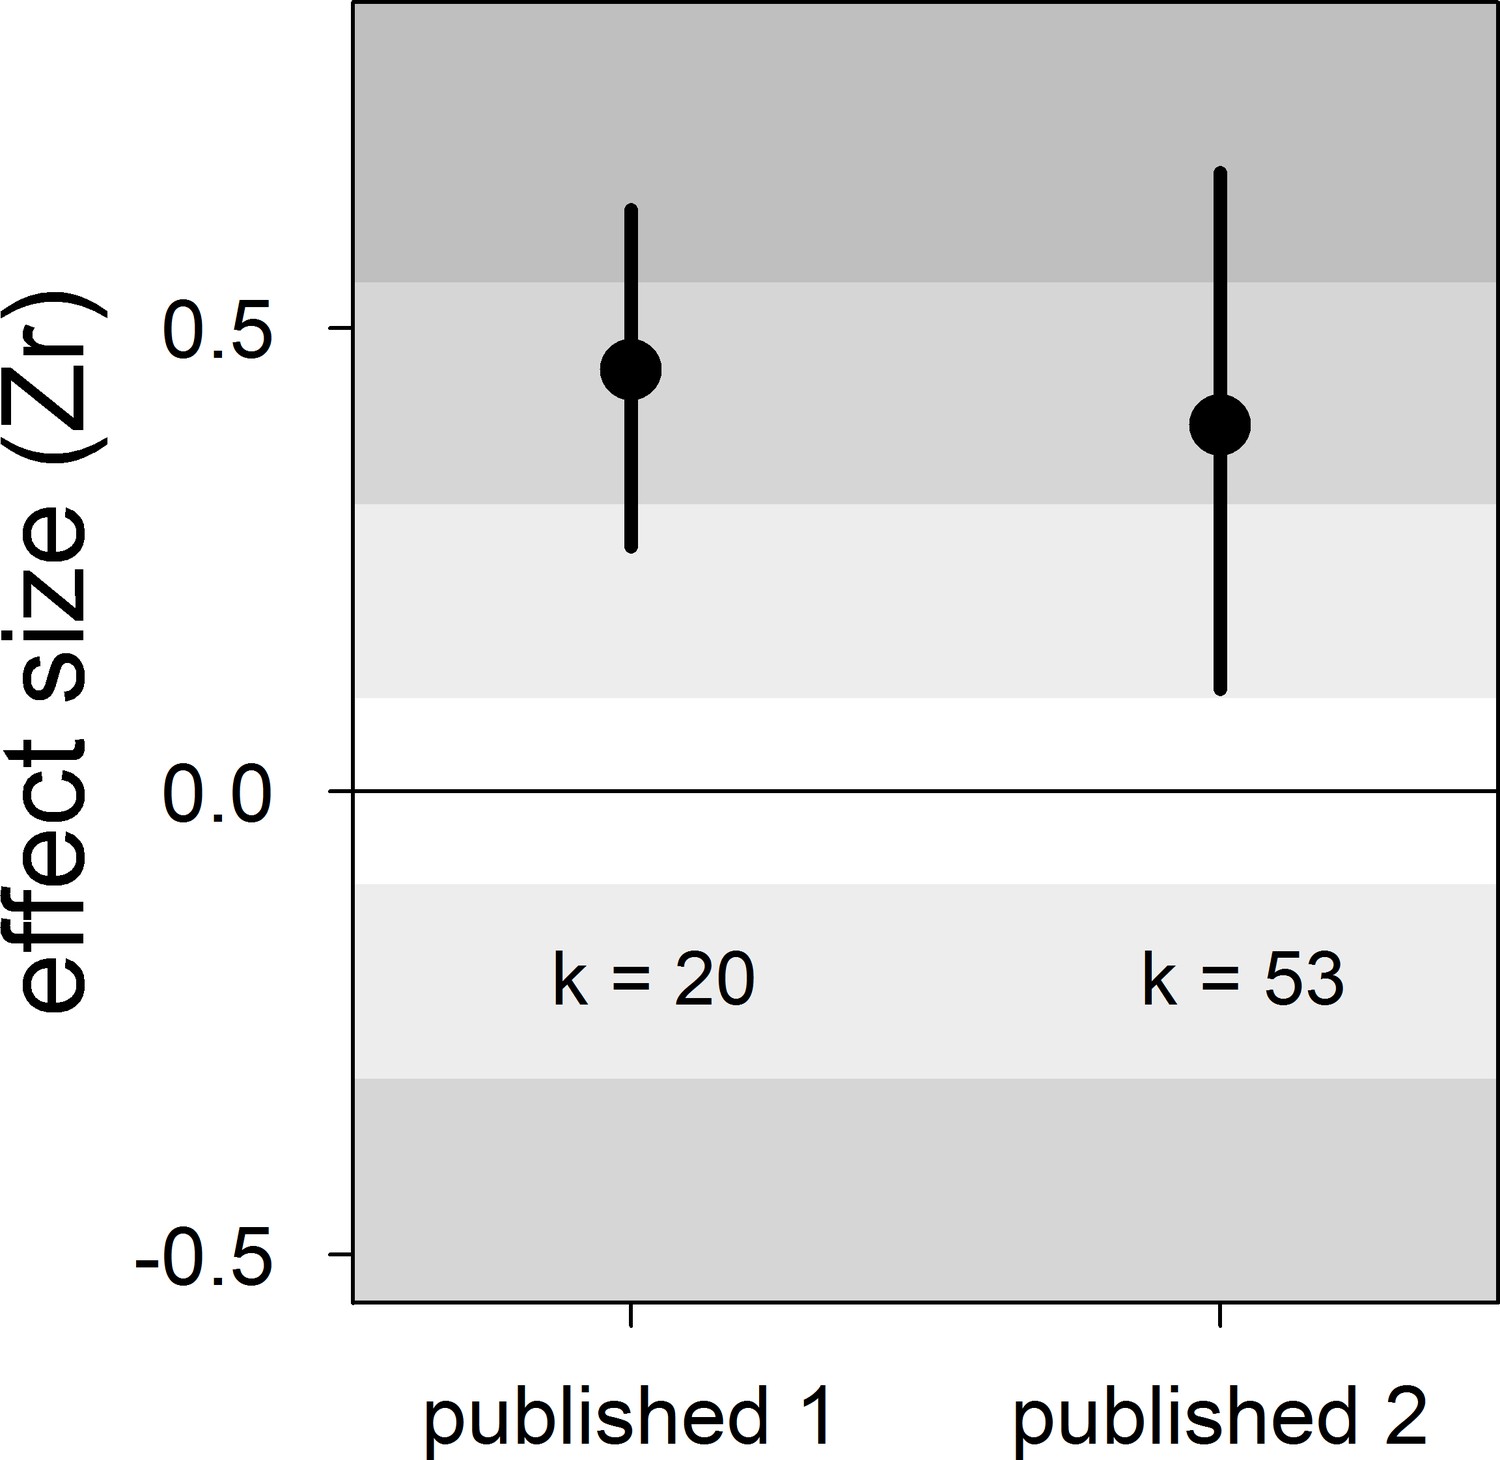
Forest plot showing the overall effect size of the relationship between dominance rank and bib size in male house sparrows based on published studies only.
Published 1 includes published effect sizes obtained from summary data, whereas published 2 includes published re-analysed effect sizes together with the remaining published effect sizes obtained from summary data. We show posterior means and 95% credible intervals from multilevel meta-analyses. Estimates are presented as standardized effect sizes using Fisher’s transformation (Zr). Light, medium and dark grey show small, medium and large effect sizes, respectively (Cohen, 1988). k is the number of estimates.
Appendix 2—figure 2
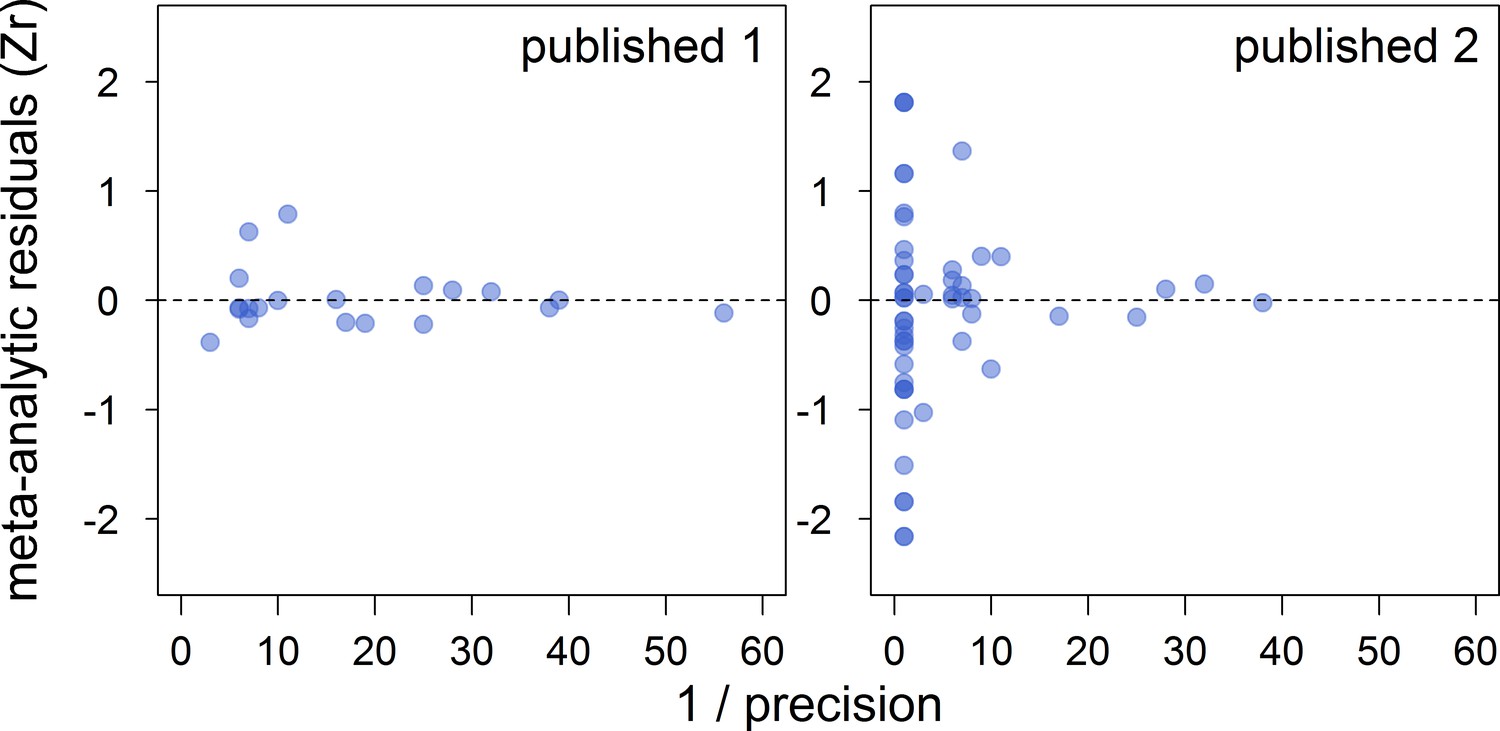
Funnel plots of the meta-analytic residuals against their precision for the meta-analyses based on published studies only.
Published 1 includes published effect sizes obtained from summary data, whereas published 2 includes published re-analysed effect sizes together with the remaining published effect sizes obtained from summary data. Estimates are presented as standardized effect sizes using Fisher’s transformation (Zr). Precision = square root of the inverse of the variance.
Tables
Table 1
Studies used in the meta-analyses and meta-regressions testing the across-study relationship between dominance rank and bib size in male house sparrows.
More information is available in the data files provided (Sánchez-Tójar et al., 2018a).
| Study ID | Reference | Population ID | Primary data? | Number of groups* | Total number of males† | Comments |
|---|---|---|---|---|---|---|
| 1 | Ritchison, 1985 | Kentucky (captivity) | No | 3 | 35 | |
| 2 | Møller, 1987 | Denmark (wild) | Yes | 3 | 37 | |
| 3 | Andersson and Åhlund, 1991 | Sweden (captivity) | No | 10 | 20 | Estimate originally reported as statistically non-significant. |
| 4 | Solberg and Ringsby, 1997 | Norway (captivity) | Yes | 5 | 44 | |
| 5 | Liker and Barta, 2001 | Hungary (captivity) | Yes | 1 | 10 | |
| 6 | Gonzalez et al., 2002 | Spain (captivity) | No | 8 | 41 | |
| 7 | Hein et al., 2003 | Kentucky (wild) | Yes | 4 | 39 | |
| 8 | Riters et al., 2004 | Wisconsin (captivity) | No | 4 | 20 | |
| 9 | Lindström et al., 2005 | New Jersey (captivity) | No | 4 | 28 | Author shared processed data, but group ID was unavailable, so data were not re-analysed. |
| 10 | Bókony et al., 2006 | Hungary (captivity) | Yes | 2 | 19 | |
| 11 | Buchanan et al., 2010 | Scotland (captivity) | No | 14 5 | 56 20 | Groups were tested twice. Post-breeding estimates originally reported as statistically non-significant. |
| 12 | Dolnik and Hoi, 2010 | Austria (captivity) | No | 4 4 | 31 31 | Groups were tested twice. Pre-infection estimates originally reported as statistically non-significant. |
| 13 | Rojas Mora et al., 2016 | Switzerland (captivity) | Yes | 14 | 56 | |
| 14 | Lendvai et al. | Hungary (captivity) | Yes3 | 4 | 46 | Unpublished data part of: Lendvai et al., 2004; Bókony et al., 2012 |
| 15 | Tóth et al. | Hungary (captivity) | Yes3 | 3 | 35 | Unpublished data part of: Tóth et al., 2009; Bókony et al., 2012 |
| 16 | Bókony et al. | Hungary (captivity) | Yes3 | 4 | 26 | Unpublished data part of: Bókony et al., 2010; Bókony et al., 2012 |
| 17 | Sánchez-Tójar et al. | Germany (captivity) | Yes3 | 4 | 95 | Unpublished study conducted in 2014. |
| 18 | Sánchez-Tójar et al. | Lundy Island (wild) | Yes3 | 7 | 172 | Unpublished study conducted from 2013 to 2016. |
| 19 | Westneat | Kentucky (captivity) | Yes3 | 10 | 40 | Unpublished study conducted in 2005. |
-
*for primary data = yes, groups of birds containing less than four individuals were not included (see Materials and methods).
†Note: since most studies analysed more than one group of birds, the total number of males is different from group size in most cases (see below).
-
‡Information for the unpublished datasets is available in Appendix 1—table 5.
Table 2
Results of the multilevel meta-analyses on the relationship between dominance rank and bib size in male house sparrows.
Additionally, the results of the Egger’s regression tests are shown. Estimates are presented as standardized effect sizes using Fisher’s transformation (Zr). Both meta 1 and meta 2 include published and unpublished estimates, with meta 2 including two non-reported estimates assumed to be zero (see section ‘Meta-analyses’).
| Meta-analysis | K | Meta-analytic mean [95% CrI] | I2population ID [95% CrI] (%) | I2study ID [95% CrI] (%) | I2overall [95% CrI] (%) | Egger’s regression [95% CrI] |
|---|---|---|---|---|---|---|
| meta 1 | 85 | 0.23 [−0.01,0.45] | 16 [0,48] | 21 [0,51] | 53 [33,73] | −0.13 [−0.59,0.27] |
| meta 2 | 87 | 0.20 [−0.01,0.40] | 15 [0,46] | 20 [0,49] | 53 [34,74] | −0.12 [−0.55,0.28] |
-
k = number of estimates; CrI = credible intervals; I2 = heterogeneity.
Table 3
Results of the multilevel meta-regressions testing the effect of several moderators on the relationship between dominance rank and bib size in male house sparrows.
Estimates are presented as standardized effect sizes using Fisher’s transformation (Zr).
| Meta-regression | Estimates | Mean [95% CrI] |
|---|---|---|
| meta 1 | intercept | 0.17 [-0.11,0.46] |
| (k = 85) | season | −0.11 [-0.41,0.21] |
| group composition | 0.14 [-0.34,0.59] | |
| type of interactions | 0.33 [-0.17,0.91] | |
| R2marginal= | 23 [2,48] | |
| meta 2 | intercept | 0.15 [-0.10,0.45] |
| (k = 87) | season | −0.08 [-0.42,0.22] |
| group composition | 0.12 [-0.32,0.62] | |
| type of interactions | 0.27 [-0.17,0.85] | |
| R2marginal= | 20 [0,45] | |
| sampling effort | intercept | 0.24 [-0.15,0.55] |
| (k = 61) | sampling effort | 0.11 [-0.49,0.74] |
| sampling effort2 | −0.14 [-0.77,0.43] | |
| R2marginal= | 8 [0,24] |
-
k = number of estimates; CrI = credible intervals; R2marginal = percentage of variance explained by the moderators. The factors season (non-breeding: 0, breeding: 1), group composition (mixed-sex: 0, male-only: 1), and type of interactions (all: 0, aggressive-only: 1) were mean-centred, and the covariates ‘sampling effort’ and its squared term were z-transformed.
Table 4
Results of the multilevel meta-regressions testing for time-lag and publication bias in the literature on status signalling in male house sparrows.
Estimates are presented as standardized effect sizes using Fisher’s transformation (Zr). Credible intervals not overlapping zero are highlighted in bold.
| Meta-regression | Estimates | Mean [95% CrI] |
|---|---|---|
| time-lag bias | intercept | 0.26 [0.03,0.57] |
| (k = 53) | year of publication | −0.21 [-0.41,–0.01] |
| R2marginal= | 29 [0,66] | |
| published vs. | intercept | −0.09 [-0.37,0.18] |
| unpublished (k = 85) | publisheda | 0.50 [0.19,0.81] |
| R2marginal= | 38 [0,68] |
-
k = number of estimates; CrI = credible intervals; R2marginal = percentage of variance explained by the moderators; a relative to unpublished. Year of publication was z-transformed.
Appendix 1—table 1
Summary of key differences in methodology among all studies (published and unpublished) testing the relationship between dominance rank and bib size in male house sparrows (N = 19 studies).
https://doi.org/10.7554/eLife.37385.015| Variable | Levels | Number of studies | Order of preference* |
|---|---|---|---|
| Group composition | Males and females | 11 | - |
| Males only | 8 | - | |
| Resource competed for | Food only | 12 | - |
| Food, water and roosting place | 6 | - | |
| Females | 1 | - | |
| Type of interactions | Aggressive only | 12 | - |
| Aggressive and non-aggressive | 7 | - | |
| Interactions recording protocol | Live observations | 11 | - |
| Video | 6 | - | |
| Live and video observations | 2 | - | |
| Type of bib size measured | Visible | 14 | 1 |
| Hidden | 2 | 2 | |
| Both | 3 | - | |
| Beak angle during measurement | 90° | 8 | 1 |
| 180° | 3 | 2 | |
| Both | 1 | - | |
| Unknown | 7 | - | |
| Season | Non-breeding | 13 | - |
| Breeding | 5 | - | |
| Both | 1 | - | |
| Study location | Captive | 16 | - |
| Wild | 2 | - | |
| Both | 1 | - |
-
*Order of preference used for the analyses (see main text). The order of preference was determined based on how frequently the method was used in previous studies.
Appendix 1—table 2
List of the different methods used to estimate bib size in all studies (published and unpublished) testing the relationship between dominance rank and bib size in male house sparrows (N = 19 studies).
Note that some studies used more than one method to estimate bib size.
| Method to estimate bib size | Number of times used | Order of preference‡ |
|---|---|---|
| Area* | 8 | 1 |
| Møller, 1987’s equation | 6 | 2 |
| Length and width† | 3 | 2 |
| Length only | 2 | 3 |
| Møller, 1987’s drawings | 1 | 4 |
| Veiga, 1993’s equation | 1 | 5 |
-
*Area was measured from pictures (N = 5 studies), by tracing and weighing (N = 2 studies), and by tracing and ranking (N = 1 study).
†If length and width were available, we estimated bib area using Møller, 1987’s equation.
-
‡Order of preference used for the analyses (see main text). The order of preference was determined based on how frequently the method was used in previous studies.
Appendix 1—table 3
List of the different methods used to infer dominance rank from dyadic interactions in published studies that tested the relationship between dominance rank and bib size in male house sparrows (N = 13 published studies, 11 different methods).
Note that some studies used more than one method to estimate dominance rank and that unpublished studies are not included in this summary.
| Method to infer dominance rank | Number of times used | Order of preference* |
|---|---|---|
| Proportion of contests won | 4 | 4 |
| Proportion of initiated contests | 3 | 5 |
| Kendall’s linearity index | 2 | 3 |
| Proportion of contests won per dyad | 2 | 6 |
| Proportion of initiated contests won | 2 | 6 |
| David’s score | 1 | 1 |
| I and SI | 1 | 2 |
| Landau’s linearity index | 1 | 3 |
| Proportion of the received attacks won | 1 | 7 |
| Proportion of birds dominated | 1 | 7 |
| Proportion of contests won per dyad + linear assumption | 1 | 7 |
-
*Order of preference used for the analyses (see main text). The order of preference was determined based on both how frequently the method was used in previous studies and by taking into account the (expected) performance of each of the methods. First, higher order of preference was assigned to methods specifically designed for inferring linear dominance hierarchies (i.e. David’s score, I and SI, Landau’s and Kendall’s linearity indices). We used the information available in Sánchez-Tójar et al., 2018b to rank David’s score and I and SI as first and second methods in preference, respectively. Second, we ranked the remaining (proportion-based) methods based on how frequently they were used in previous studies. Importantly, the order of preference was chosen prior to conducting any statistical analysis, and thus, method selection was blind to the outcome of the analyses.
Appendix 1—table 4
Additional comments on some of the published studies included in the meta-analysis.
https://doi.org/10.7554/eLife.37385.018| Reference | Comments |
|---|---|
| Ritchison, 1985 | According to the original publication, the total number of birds studied was 35, as opposed to the 25 individuals used in the meta-analyses of Nakagawa et al., 2007 and Santos et al., 2011. |
| Hein et al., 2003 | The total number of birds included in our re-analysis of the primary data is smaller than that presented in the original publication. This is because our re-analysis only included fully identified individuals (e.g. birds missing rings could not be included). |
| Dolnik and Hoi, 2010 | 32 males were selected for the experiment, but one bird was excluded before the start of the experiment. Thus, n was set to 31 individuals for this study. |
| Buchanan et al., 2010 | 96 birds were separated in 24 aviaries of four individuals each. The final n of several aviaries was less than four individuals, and therefore, these aviaries were not included in our meta-analyses (see main text, section ‘Materials and Methods’). |
| Rojas Mora et al., 2016 | According to the primary data, one male did not interact, and thus, n was set to 59 individuals in Appendix 2. |
Appendix 1—table 5
Data descriptions for the unpublished data analysed in the meta-analysis.
https://doi.org/10.7554/eLife.37385.019| Study ID* | Data description |
|---|---|
| 14 | 88 individuals were separated into four captive mixed-sex groups. Live observations after mild food deprivation were conducted to record agonistic dyadic interactions (i.e. fights) over (mostly) food for around one week in Feb 2003 (total = 1,563 fights). Bib length and width were measured for each male before the dominance observations using a ruler. More information can be found in Lendvai et al., 2004 and Bókony et al., 2012. |
| 15 | 61 individuals were separated into three captive mixed-sex groups. Live observations after mild food deprivation were conducted to record agonistic dyadic interactions (i.e. fights) over (mostly) food between Oct and Dec 2005 (two groups) and 2006 (one group; total = 2,003 fights). Bib area was measured for each male using standardized pictures taken after the dominance observations. More information can be found in Tóth et al., 2009 and Bókony et al., 2012. |
| 16 | 60 individuals were separated into four captive mixed-sex groups. Live and video observations after mild food deprivation were conducted to record agonistic dyadic interactions (i.e. fights) over (mostly) food for around two weeks per group between Oct 2007 and Feb 2008 (total = 6,641 fights). Bib length and width were measured for each male before the dominance observations using a ruler. More information can be found in Bókony et al., 2010 and Bókony et al., 2012. |
| 17 | 96 males were separated into four captive male-only groups. Videos after mild food deprivation were taken to record agonistic dyadic interactions (i.e. fights) over food for 10 days between Oct and Dec 2014 (total = 3,776 fights). Bib area was measured several times for each male (median = 3 times/male, range = 2 to 6) using standardized pictures taken from Oct to Dec 2014, and the mean bib area of each individual was used in the analyses. |
| 18 | 453 individuals (215 females and 238 males) were observed in seven discrete sampling events in a wild population of house sparrows at Lundy Island, UK. Videos were taken to record agonistic dyadic interactions (i.e. fights) over food for 20 days between Nov 2013 and Dec 2016 (total = 11,063 fights). Bib length was measured several times for each male (median = 1 time/male, range = 1 to 6) from Nov 2013 to Dec 2016 using a calliper, and the mean bib area of each individual in each sampling event was used in the analyses. |
| 19 | 128 individuals were separated into 16 captive mixed-sex groups. Live observations after mild food deprivation were conducted to record agonistic dyadic interactions (i.e. supplants and hold-offs) over food between Mar and Apr 2005 (total = 5,496 fights). Bib length and width were measured for each male before the dominance observations using a calliper as in Morrison et al., 2008. |
-
*Study ID corresponding to Table 1 in main text.
Appendix 2—table 1
Results of two multilevel meta-analyses to test the relationship between dominance rank and bib size in male house sparrows based on published studies only.
Published 1 includes published effect sizes obtained from summary data, whereas published 2 includes published re-analysed effect sizes together with the remaining published effect sizes obtained from summary data. Additionally, the results of the Egger’s regressions are shown. Estimates are presented as standardized effect sizes using Fisher’s transformation (Zr). Credible intervals not overlapping zero are highlighted in bold.
| Meta-analysis | K | Meta-analytic mean [95% CrI] | I2population ID [95% CrI] (%) | I2study ID [95% CrI] (%) | I2overall [95% CrI] (%) | Egger’s regression [95% CrI] |
|---|---|---|---|---|---|---|
| Published 1 | 20 | 0.45 [0.26,0.63] | 17 [0,51] | 17 [0,53] | 46 [15,78] | 0.42 [−0.73,1.48] |
| Published 2 | 53 | 0.40 [0.11,0.67] | 14 [0,46] | 13 [0,42] | 46 [17,72] | −0.25 [−0.73,0.26] |
-
k = number of estimates; CrI = credible intervals; I2 = heterogeneity.
Additional files
-
Supplementary file 1
Decision spreadsheet of the systematic review.
- https://doi.org/10.7554/eLife.37385.011
-
Transparent reporting form
- https://doi.org/10.7554/eLife.37385.012
-
Reporting standard 1
PRISMA statement.
- https://doi.org/10.7554/eLife.37385.013
Download links
A two-part list of links to download the article, or parts of the article, in various formats.
Downloads (link to download the article as PDF)
Open citations (links to open the citations from this article in various online reference manager services)
Cite this article (links to download the citations from this article in formats compatible with various reference manager tools)
Meta-analysis challenges a textbook example of status signalling and demonstrates publication bias
eLife 7:e37385.
https://doi.org/10.7554/eLife.37385


