Research: United States National Postdoc Survey results and the interaction of gender, career choice and mentor impact
- American Medical Association, United States
- University of Arkansas, United States
- University of Tennessee Health Science Center, United States
- Washington University in St. Louis, United States
- University of Chicago, United States
Figures
Figure 1
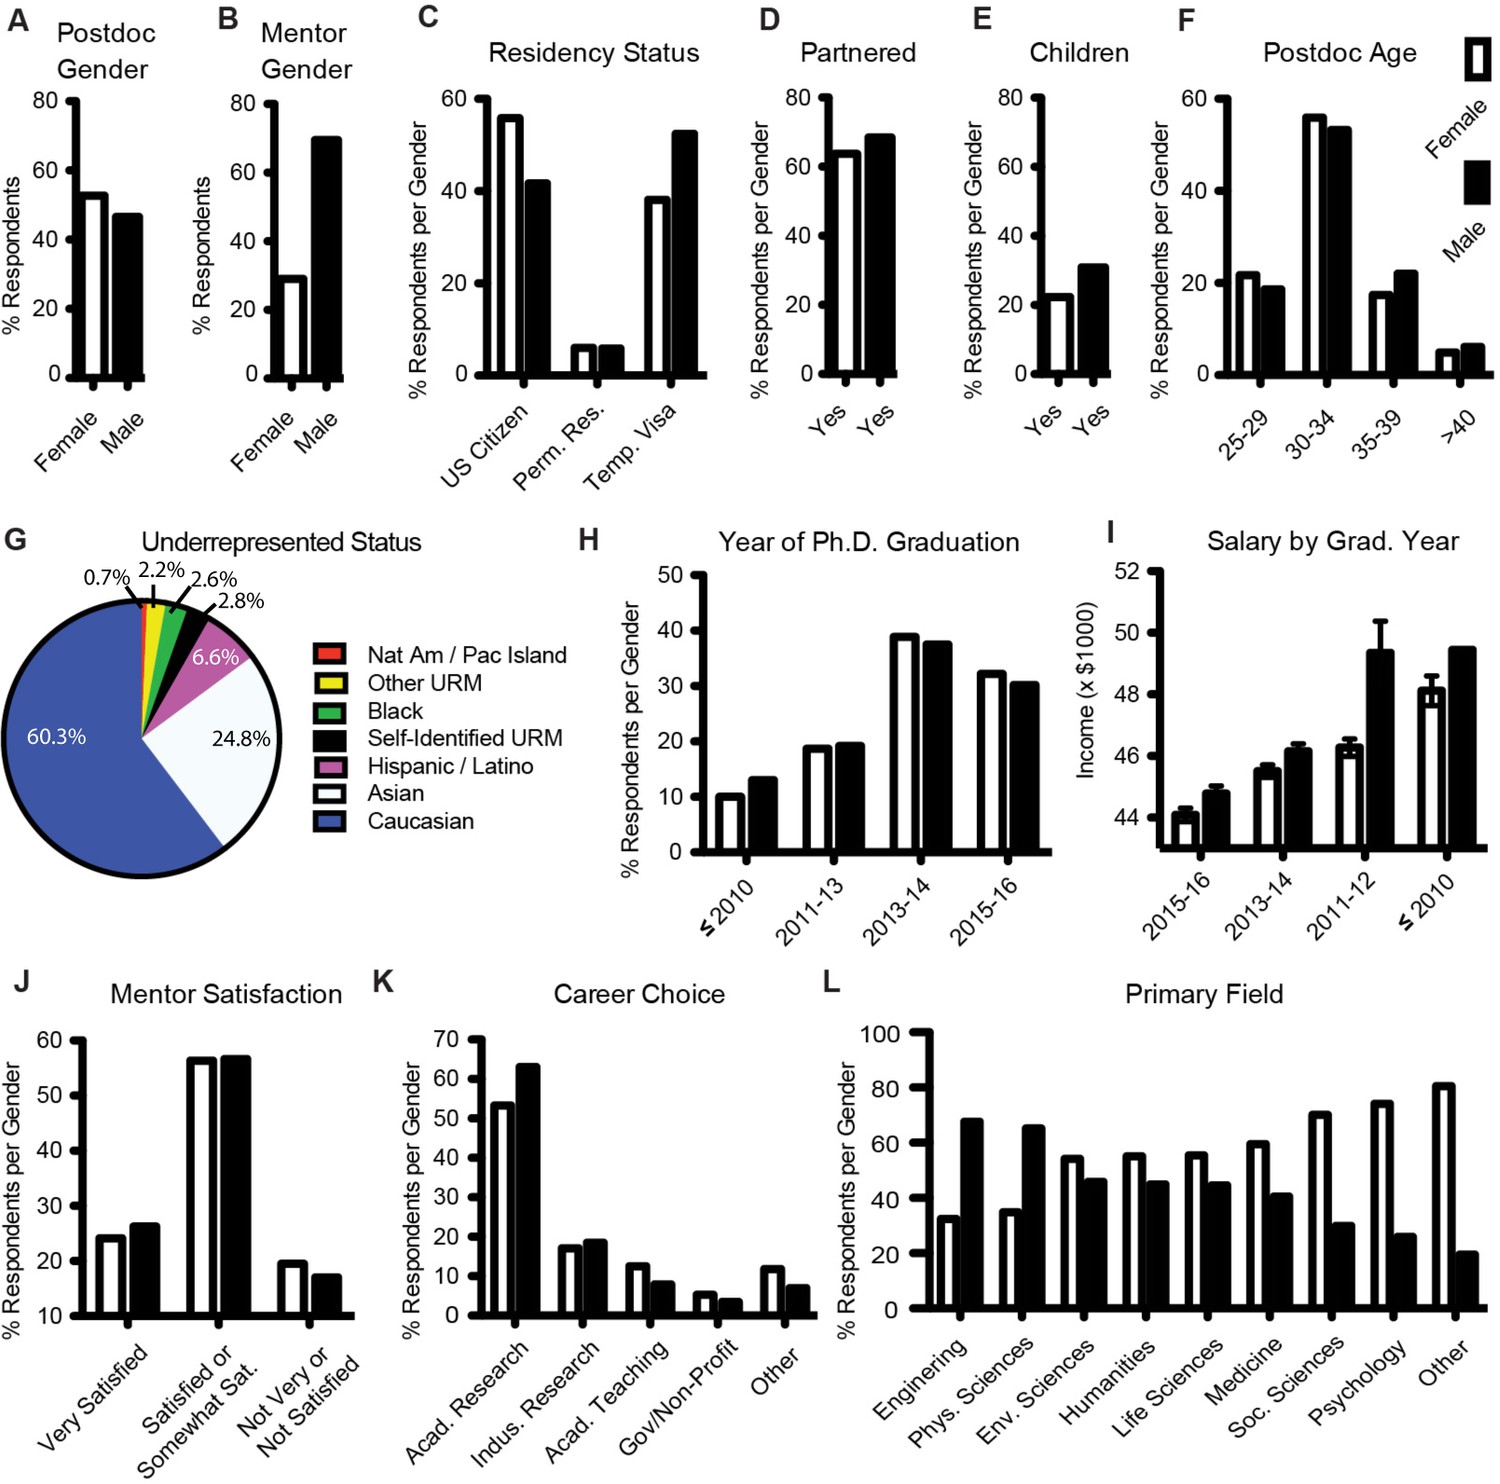
Demographics of the postdoc population surveyed.
(A) Postdoc gender; (B) Mentor gender; (C) Residency status; (D) Partnered/Married; (E) Has children; (F) Age; (G) Race/Ethnicity/Underrepresented status (which may include things other than race and ethnicity, such as LGBTQ or disability status); (H) Year of graduation; (I) Adjusted income, by year of graduation; (J) Postdoc satisfaction with mentor; (K) Primary long-term career plans; and (L) Primary field/discipline. White bars indicate female, black bars indicate male.
Figure 2
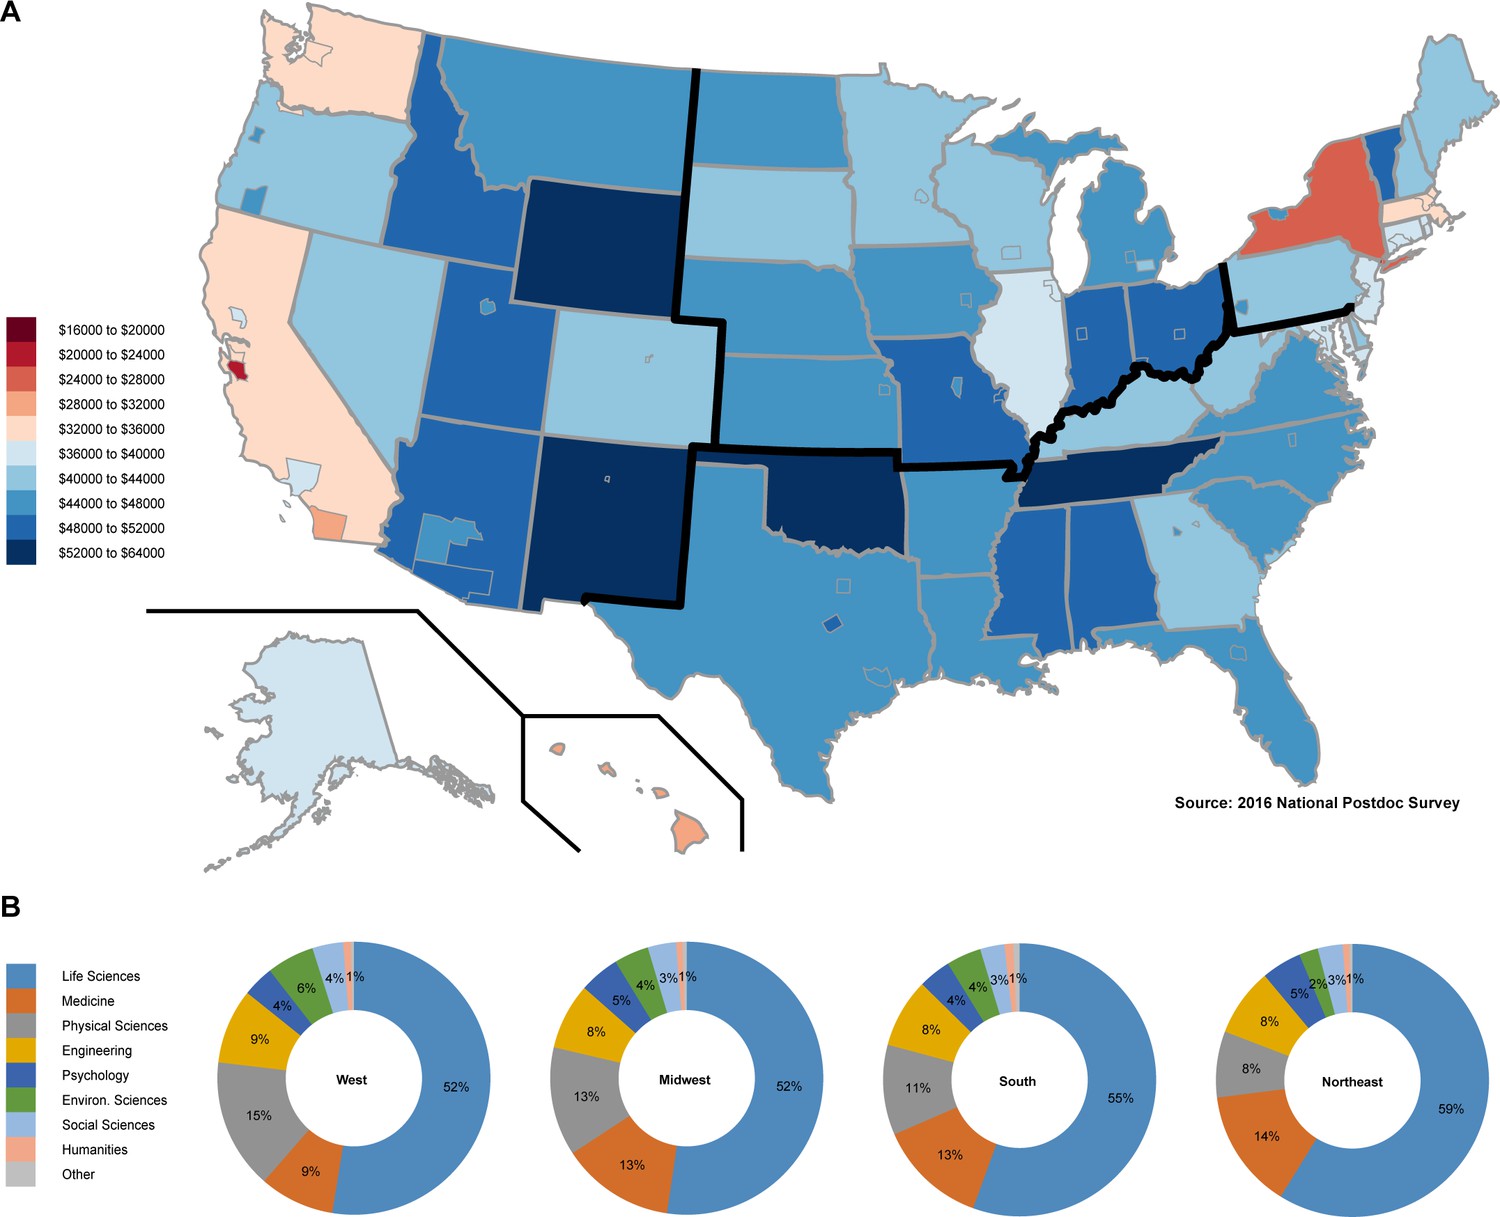
Postdoc cost of living adjusted income and field of study by region.
(A) A map of the United States with the range of reported postdoc gross income adjusted by cost of living (key on the left). The adjusted income data are provided at the state (and when data sufficient to support, county) level. (B) The respondents’ field of study (key on the right) in each of the four major regions: West, Midwest, South, and Northeast (designated by bold lines on the map in A).
Figure 3 with 1 supplement
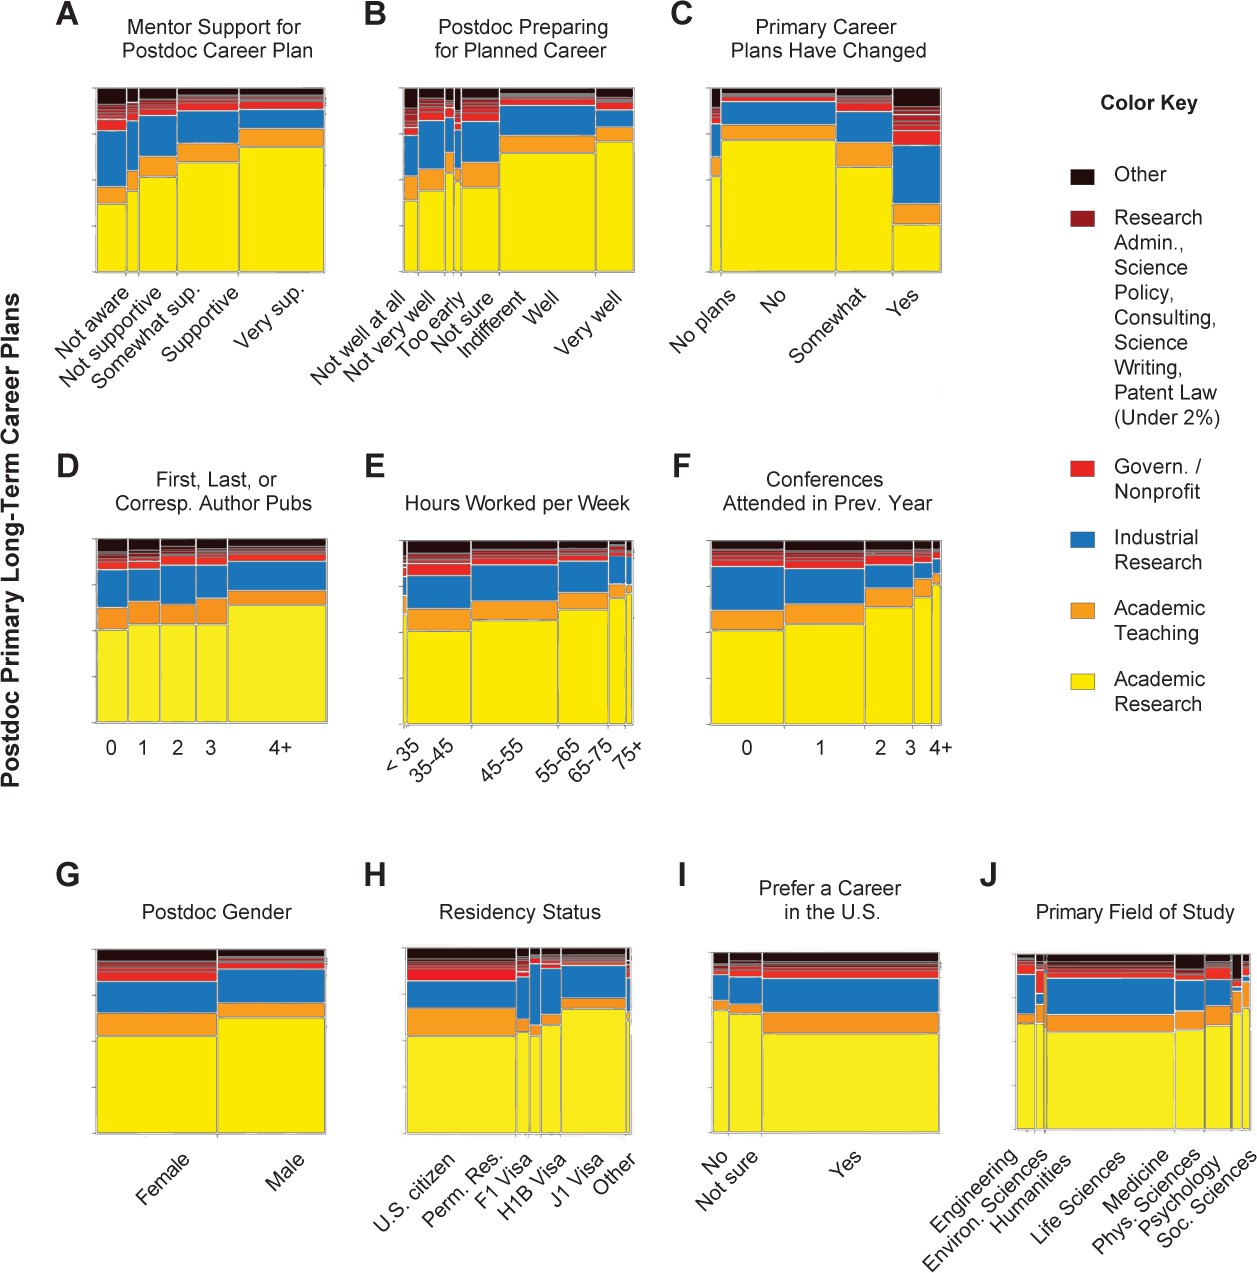
Postdoc career choice.
Illustration of the independent effects of 10 of the 14 significant factors (out of 26) in the nominal logistic regression model of best fit for postdoc primary career choice (See Table 1 for effect statistics). A–C illustrate the effect of postdoc mentor and postdoc confidence on postdoc career choice; D–F illustrate the effect of postdoc productivity on postdoc career choice, and G–J illustrate the effect of demographics on postdoc career choice. In these mosaic plots, the panels show the listed factor and corresponding effect size, and the right-hand color key corresponds to primary career choice. Factors are paraphrased survey questions; please see Source Data 1 and Source Data 2 for specific wording of questions.
Figure 3—figure supplement 1

Additional significant factors influencing career choice, but not depicted in Figure 3.
(A) Mentor rank; (B) whether the postdoctoral respondent was currently looking for a permanent position; (C) number of publications respondent had while a postdoc; (D) whether the postdoc respondent had received training in pedagogy. In these mosaic plots, the panels show the listed factor and corresponding effect size, and the right-hand color key corresponds to primary career choice. Factors are paraphrased survey questions; see Source Data 1 and Source Data 2 for specific wording of questions.
Figure 4
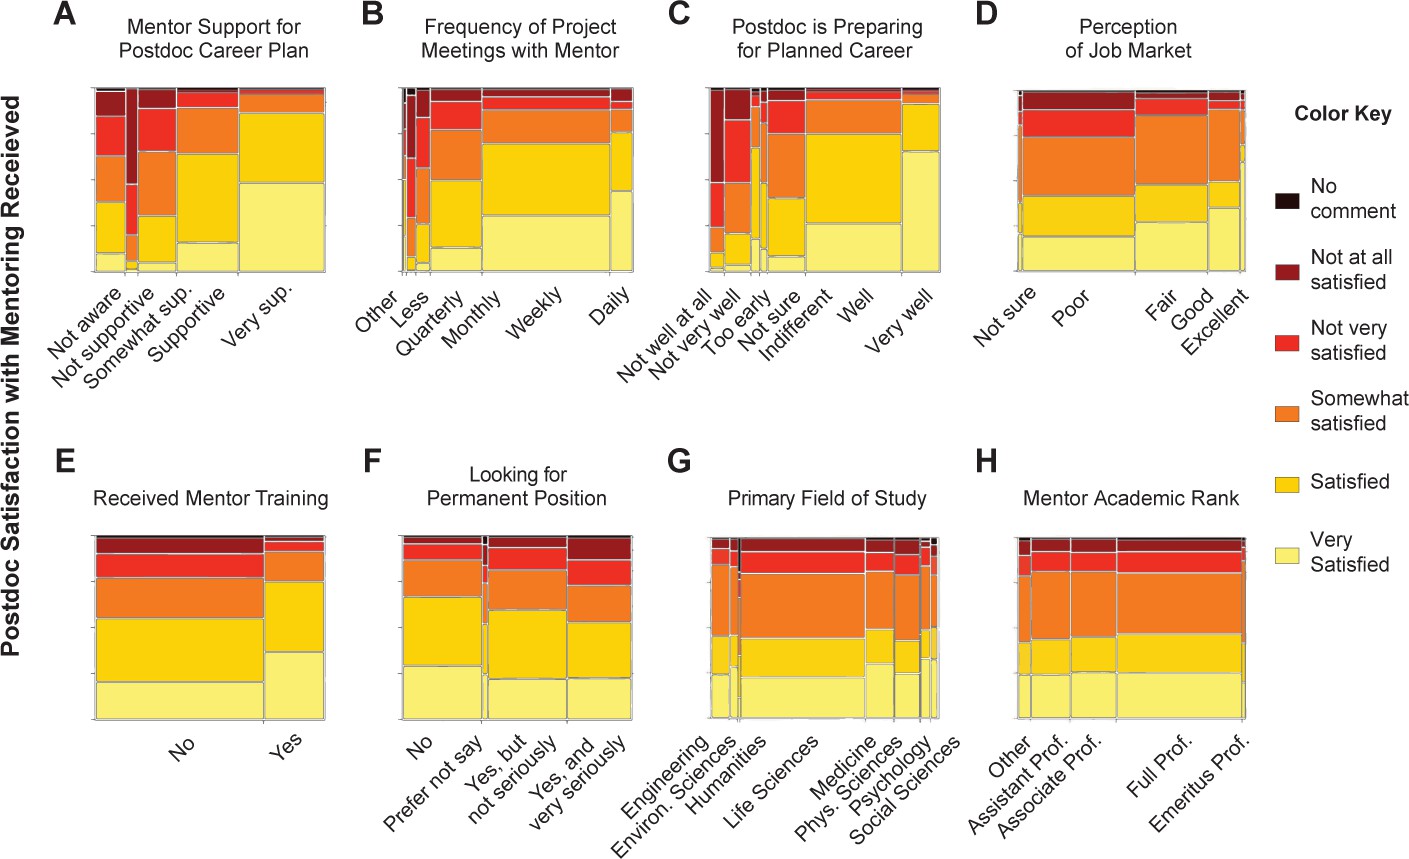
Postdoc satisfaction with mentor.
Illustration of the independent effects of the eight significant factors (out of 26) in the nominal logistic regression model of best fit for satisfaction with postdoc mentor (see Table 2 for effect statistics). In these mosaic plots, the panels show the listed factor and corresponding effect size, and the right-hand color key corresponds to the degree of satisfaction with mentor. Factors are paraphrased survey questions; see Source Data 1 and Source Data 2 for specific wording of questions.
Tables
Table 1
Significant factors influencing postdoc primary career plans.
A nominal logistic regression model that considered 26 factors that might be important for postdoc success and career choice revealed 14 significant factors. Factors are listed in order of decreasing effect size. Nominal logistic regression model, whole model effect: n = 6,504, Model R2 = 0.2017, AICc = 15924, BIC = 21130.
| Factor | χ2 | -log p-value |
|---|---|---|
| Whether long-term career plans have changed | 599.951 | 108.529 |
| Received training in pedagogy | 151.052 | 27.273 |
| Feelings of career preparedness | 161.510 | 11.925 |
| Perceived mentor support of career plan | 130.577 | 11.925 |
| Primary field of study | 191.331 | 10.190 |
| Residency status in US | 133.264 | 9.941 |
| Job search intensity | 98.574 | 9.352 |
| Postdoc gender | 53.654 | 7.658 |
| Number of first, last, or corresponding author publications | 86.193 | 5.274 |
| Conferences attended in last year | 84.468 | 5.043 |
| Hours worked/week | 109.093 | 4.870 |
| Total number of publications while a postdoc | 80.503 | 4.524 |
| Academic rank of mentor | 70.513 | 3.292 |
| Plan to pursue a career in US | 37.452 | 2.340 |
Table 2
Significant factors influencing postdoc satisfaction with mentoring.
A nominal logistic regression model was calculated based on the same 26 factors used to model postdoc primary career plans (Table 1). Eight of these factors were found to be significant; factors are listed in order of decreasing effect size. Nominal logistic regression model, whole model effect: n = 6,504, Model R2 = 0.3007, AICc = 14729, BICc = 17810.
| Factor | χ2 | -log p-value |
|---|---|---|
| Feelings of career preparedness | 960.457 | 181.948 |
| Perceived mentor support of career plan | 904.891 | 178.146 |
| Frequency of mentor meetings | 532.31 | 89.480 |
| Job search intensity | 68.255 | 8.040 |
| Received training in mentorship | 37.088 | 6.240 |
| Primary field of study | 92.193 | 4.368 |
| Perception of academic job market | 48.088 | 3.384 |
| Academic rank of mentor | 41.614 | 2.508 |
Additional files
-
Source data 1
Dataset 1: Pilot National Postdoc Survey used Feb 2–March 30, 2016
- https://doi.org/10.7554/eLife.40189.009
-
Source data 2
Dataset 2: National Postdoc Survey used March 31–Sept 2, 2016
- https://doi.org/10.7554/eLife.40189.010
-
Source data 3
Dataset 3: Changes between pilot and final survey
- https://doi.org/10.7554/eLife.40189.011
-
Supplementary file 1
Tables S1 to S7.
Table S1. Population proportion analysis. Number of individual responses required from a total population of 100,000 for 95% and 99% confidence levels, at a 5% margin of error, assuming the true population proportion being measured is between 3% and 50% of the total population. Response values estimated using a population proportion analysis following equations and definitions described in Tintle et al. (Davis, 2009) and at Select Statistical Services Limited (Fleming et al., 2012). Table S2. National data summarized in main text and Figure 1. Table S3. Percentages of postdoc respondents in primary fields per US census region. There was a small, but significant, correlation between region and field (Pearson χ2, n = 7,585, χ2 = 134.145, p < 0.0001). Table S4. Nominal logistic model of gender disparity in pay. Gender remains a significant factor explaining postdoc salary, even when including year of terminal degree, age, partner status, parental status, type of institution, institution control, and satisfaction with mentor. Whole model n = 7,280, χ2 = 2589.077, p < 0.0001, AICc = 28458.9, BIC = 30056.2. Table S5. Gender salary disparity by field. Table S6. Respondent reported salaries adjusted to cost of living. Table S7. Factors included in nominal logistic regression models of satisfaction with mentor and primary career plan.
- https://doi.org/10.7554/eLife.40189.012
-
Transparent reporting form
- https://doi.org/10.7554/eLife.40189.013
Download links
A two-part list of links to download the article, or parts of the article, in various formats.
Downloads (link to download the article as PDF)
Open citations (links to open the citations from this article in various online reference manager services)
Cite this article (links to download the citations from this article in formats compatible with various reference manager tools)
Research: United States National Postdoc Survey results and the interaction of gender, career choice and mentor impact
eLife 7:e40189.
https://doi.org/10.7554/eLife.40189


