Plant diversity maintains multiple soil functions in future environments
- German Centre for Integrative Biodiversity Research Halle-Jena-Leipzig, Germany
- Leipzig University, Germany
- University of Minnesota, United States
- Freie Universität Berlin, Germany
- Berlin-Brandenburg Institute of Advanced Biodiversity Research, Germany
- Key Laboratory of Vegetation and Management of Degraded Ecosystems, South China Botanical Garden, Chinese Academy of Sciences, China
- University of Chinese Academy of Sciences, China
- Friedrich Schiller University Jena, Germany
- Western Sydney University, Australia
Figures
Figure 1
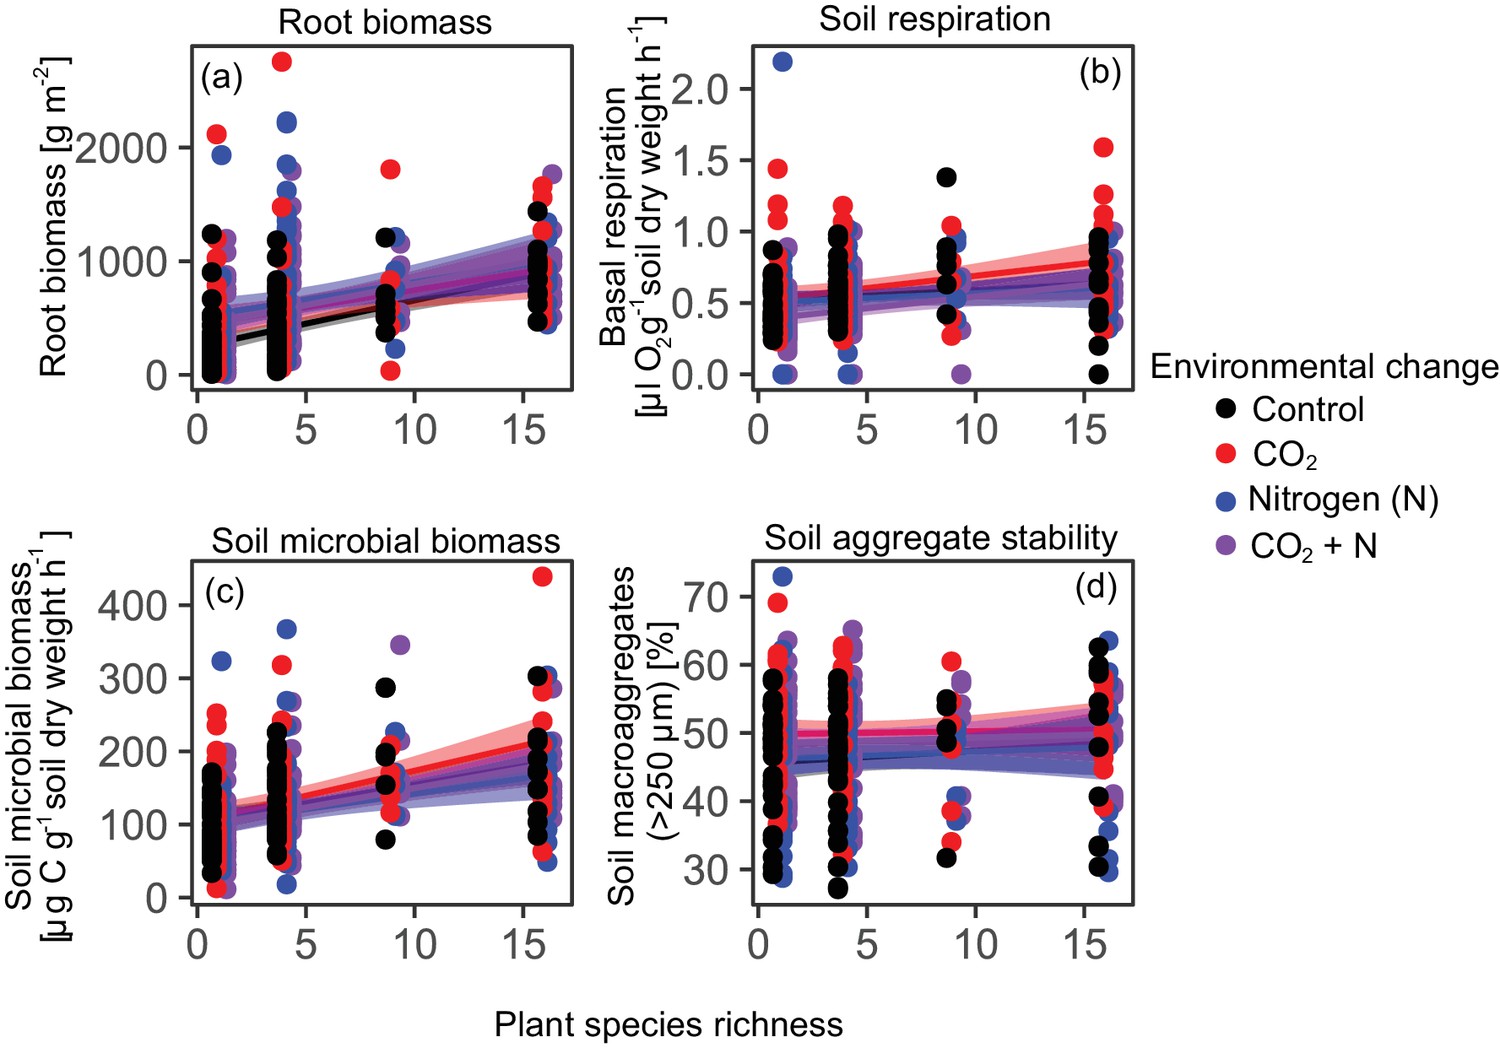
Effects of plant diversity and environmental change drivers on single ecosystem functions.
Plant diversity effects on root biomass (a), soil respiration (b), soil microbial biomass (c), and water-stable soil aggregates (d) under ambient conditions (Control) and three different future environmental conditions (elevated CO2 concentrations, elevated nitrogen availability, and elevated CO2 concentrations and elevated nitrogen availability). Plant diversity effects are significant in (a), (b), and (c), while elevated CO2 and N did not affect any of the soil functions (Table 1). Shown are regression lines with 95% confidence intervals. Points staggered on x-axis for clarity.
Figure 2

Correlations between four soil functions across plant diversity, CO2, and N treatments.
Lower panels show bivariate relationships among standardized values of root biomass, soil basal respiration, soil microbial biomass, and water-stable soil aggregates (>250 µm). Upper panels report Pearson’s correlation coefficient (r) and associated p-values.
Figure 3

Average ecosystem multifunctionality as affected by plant diversity and environmental change drivers.
Average ecosystem multifunctionality (Hector and Bagchi, 2007; Byrnes et al., 2014) calculated from the soil functions root biomass, soil respiration, soil microbial biomass C, and percentage of water-stable soil aggregates under ambient conditions and three different future environmental conditions (elevated CO2 concentrations, elevated nitrogen availability, and elevated CO2 concentrations and elevated nitrogen availability). Plant diversity significantly increased multifunctionality, while CO2 and N effects were not significant (Table 1). Given are regression lines with 95% confidence intervals. Points staggered on x-axis for clarity.
Figure 4 with 5 supplements
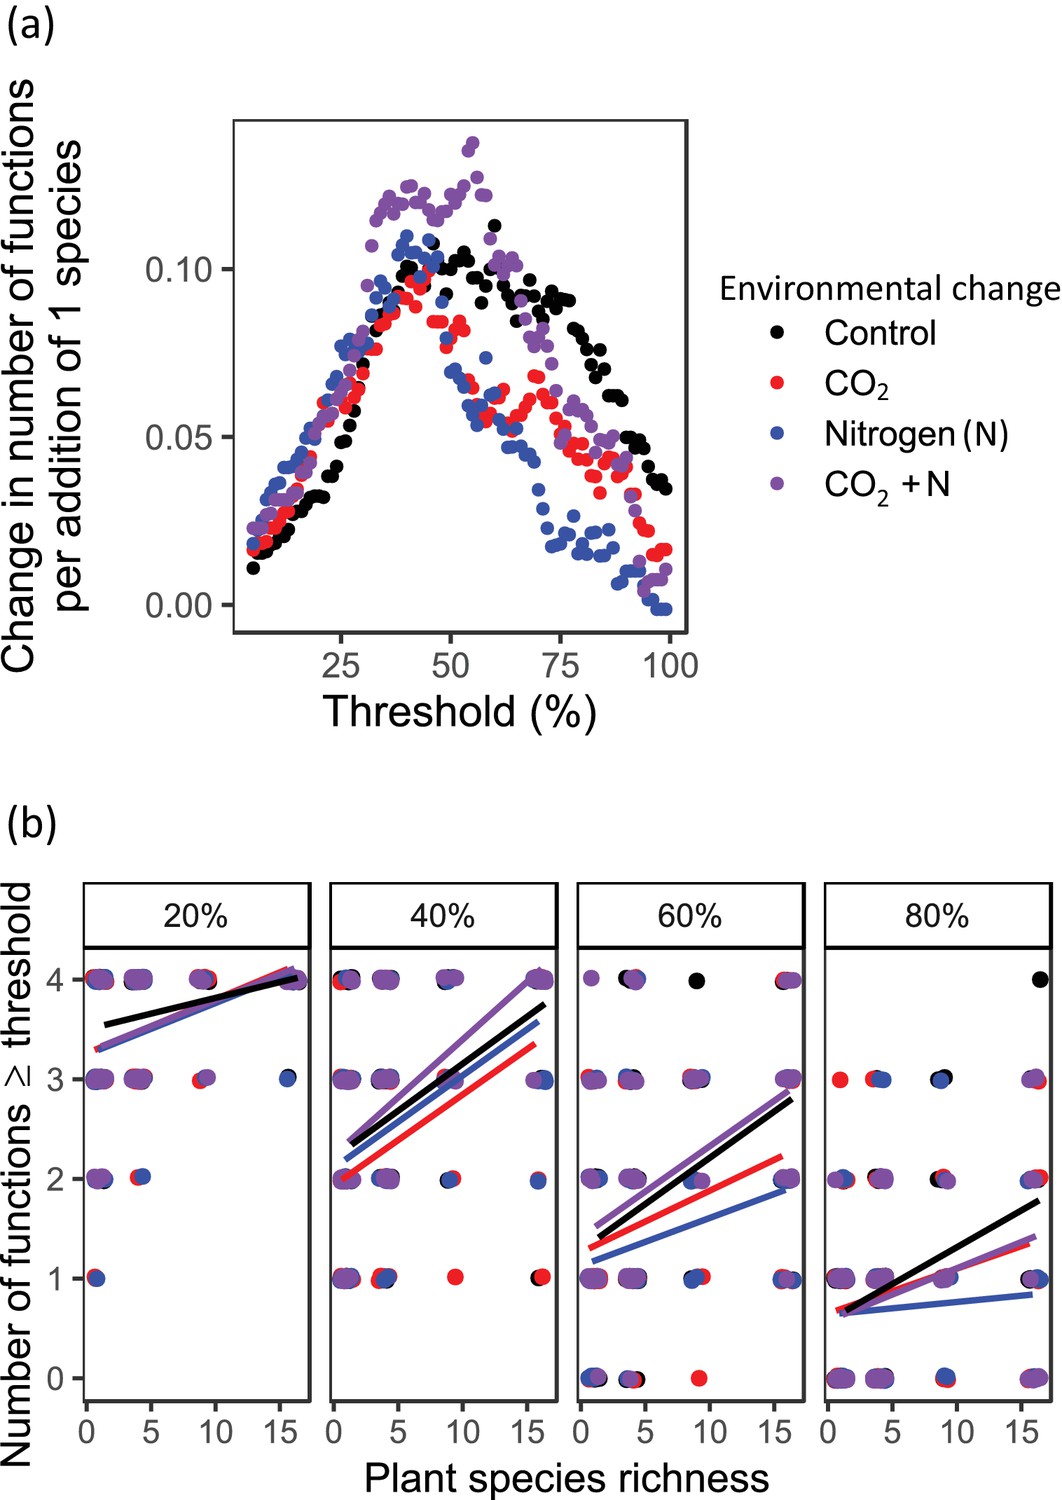
Ecosystem multifunctionality based on the multiple thresholds approach (Byrnes et al., 2014) as affected by plant diversity and environmental change drivers.
The slope of the relationship between planted species richness and multifunctionality, defined as number of functions reaching a threshold of some percentage of the maximum observed function. Panels show the relationship for (a) the number of functions at or above a threshold of some proportion of the maximum observed function for threshold values ranging from 1 to 99% and (b) four different thresholds (20%, 40%, 60%, and 80% of maximum) as affected by plant species richness, CO2, and N in the BioCON experiment (Reich et al., 2001). Points are slightly jiggered to improve readability.
Figure 4—figure supplement 1
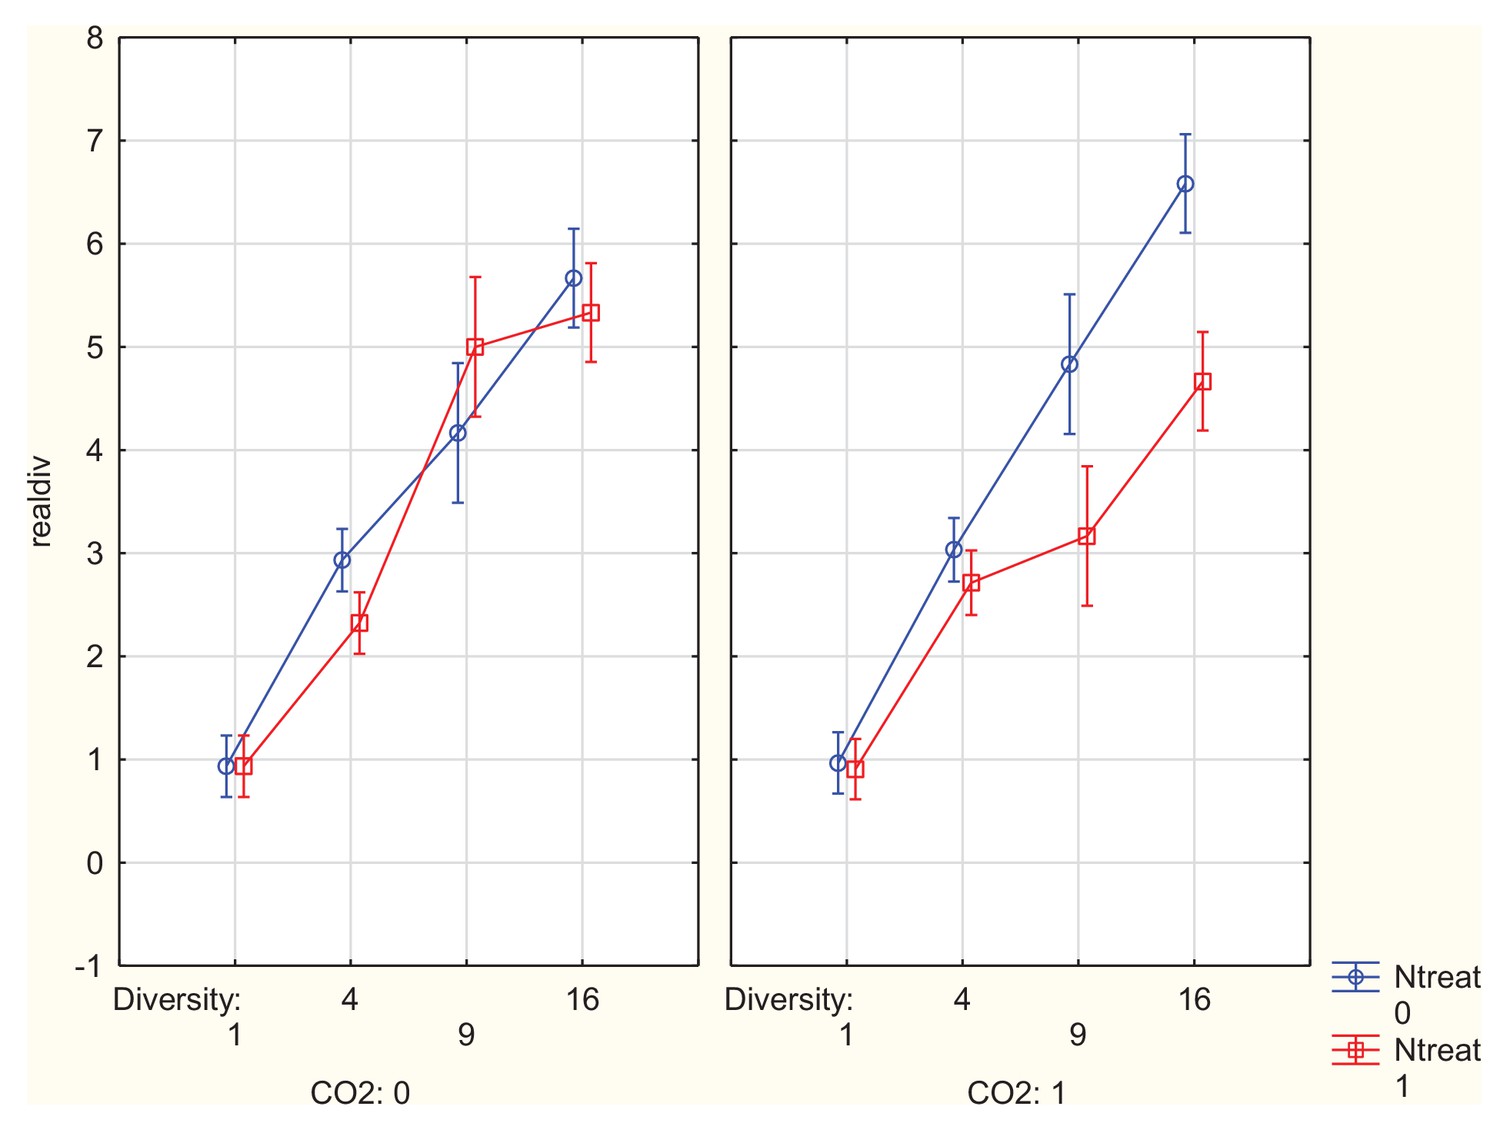
Plant species richness, N addition, and CO2 effects on realized species richness in the BioCON experiment.
For statistical results see main text. Means with 95% confidence intervals.
Figure 4—figure supplement 2
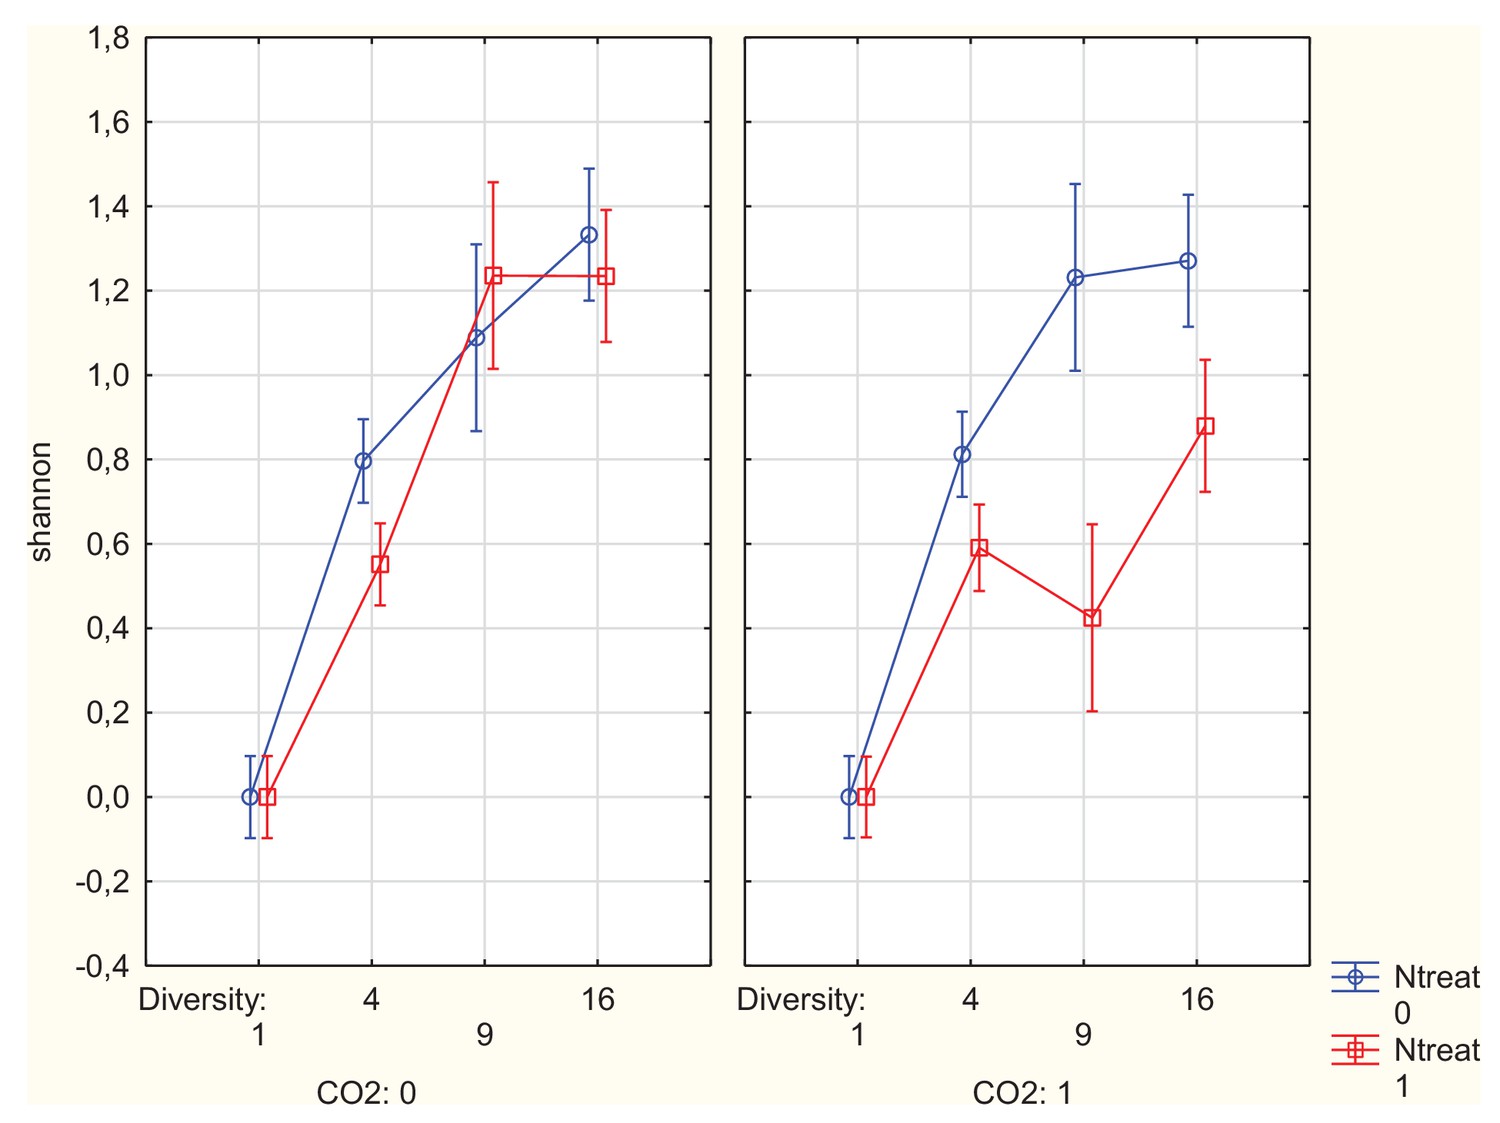
Plant species richness, N addition, and CO2 effects on Shannon diversity in the BioCON experiment.
For statistical results see main text. Means with 95% confidence intervals.
Figure 4—figure supplement 3
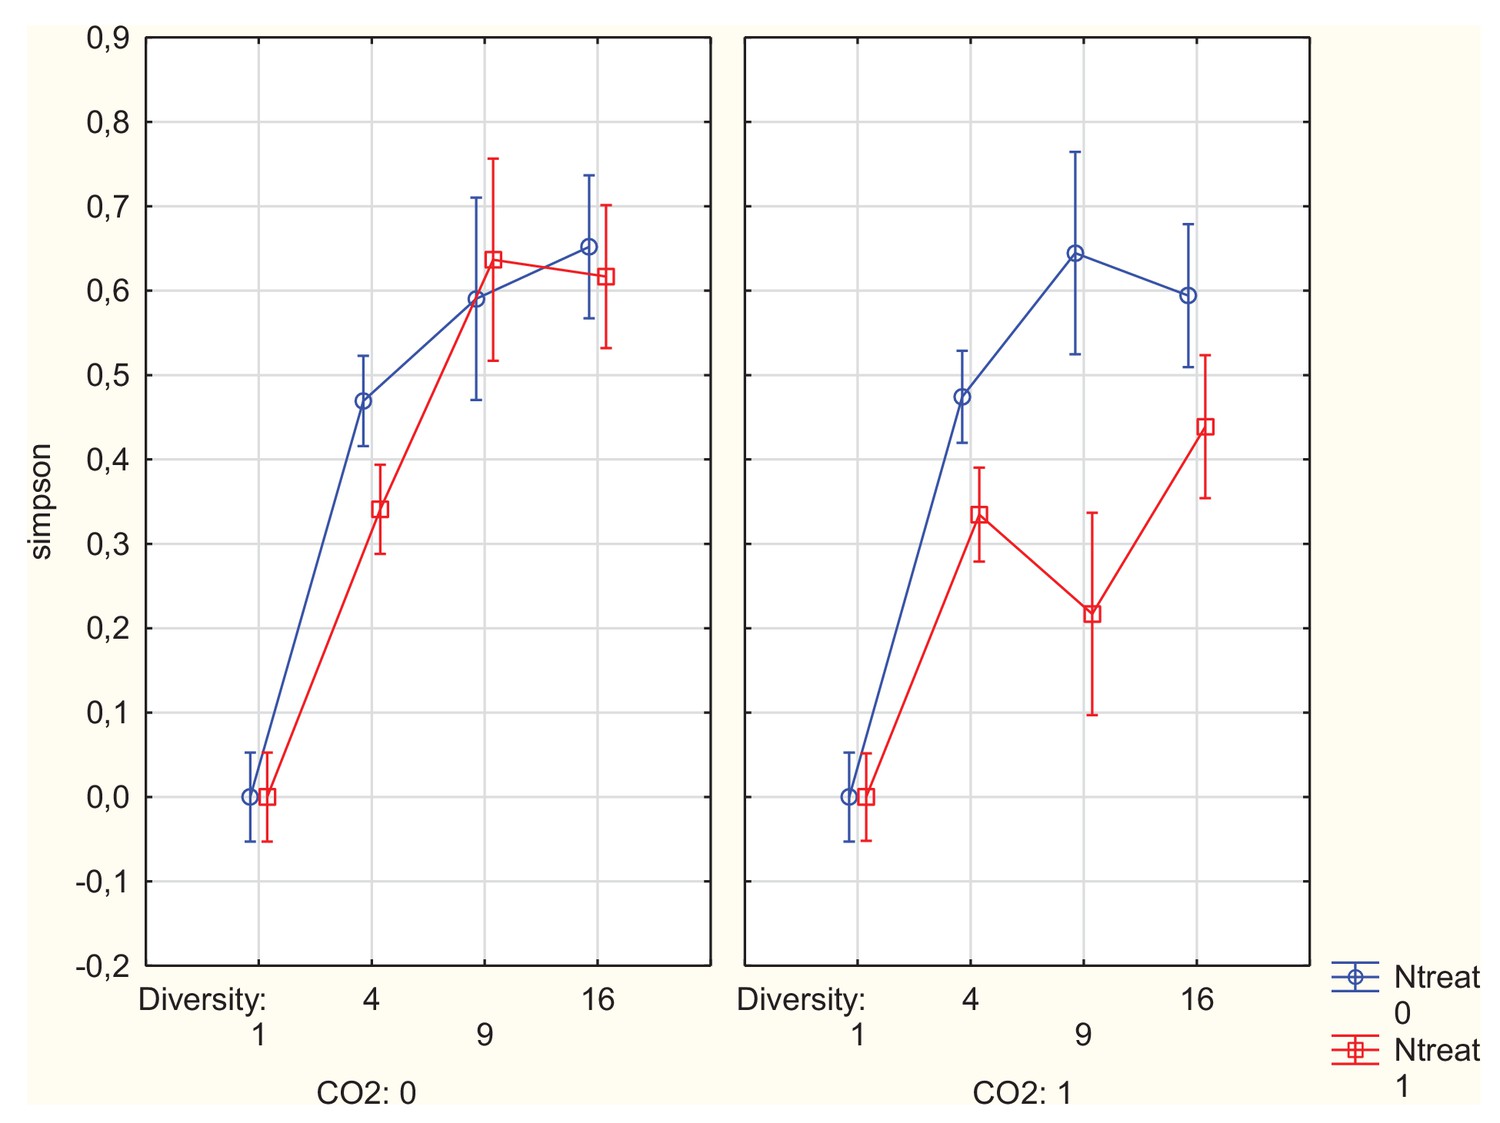
Plant species richness and N addition effects on Simpson evenness in the BioCON experiment.
For statistical results see main text. Means with 95% confidence intervals.
Figure 4—figure supplement 4
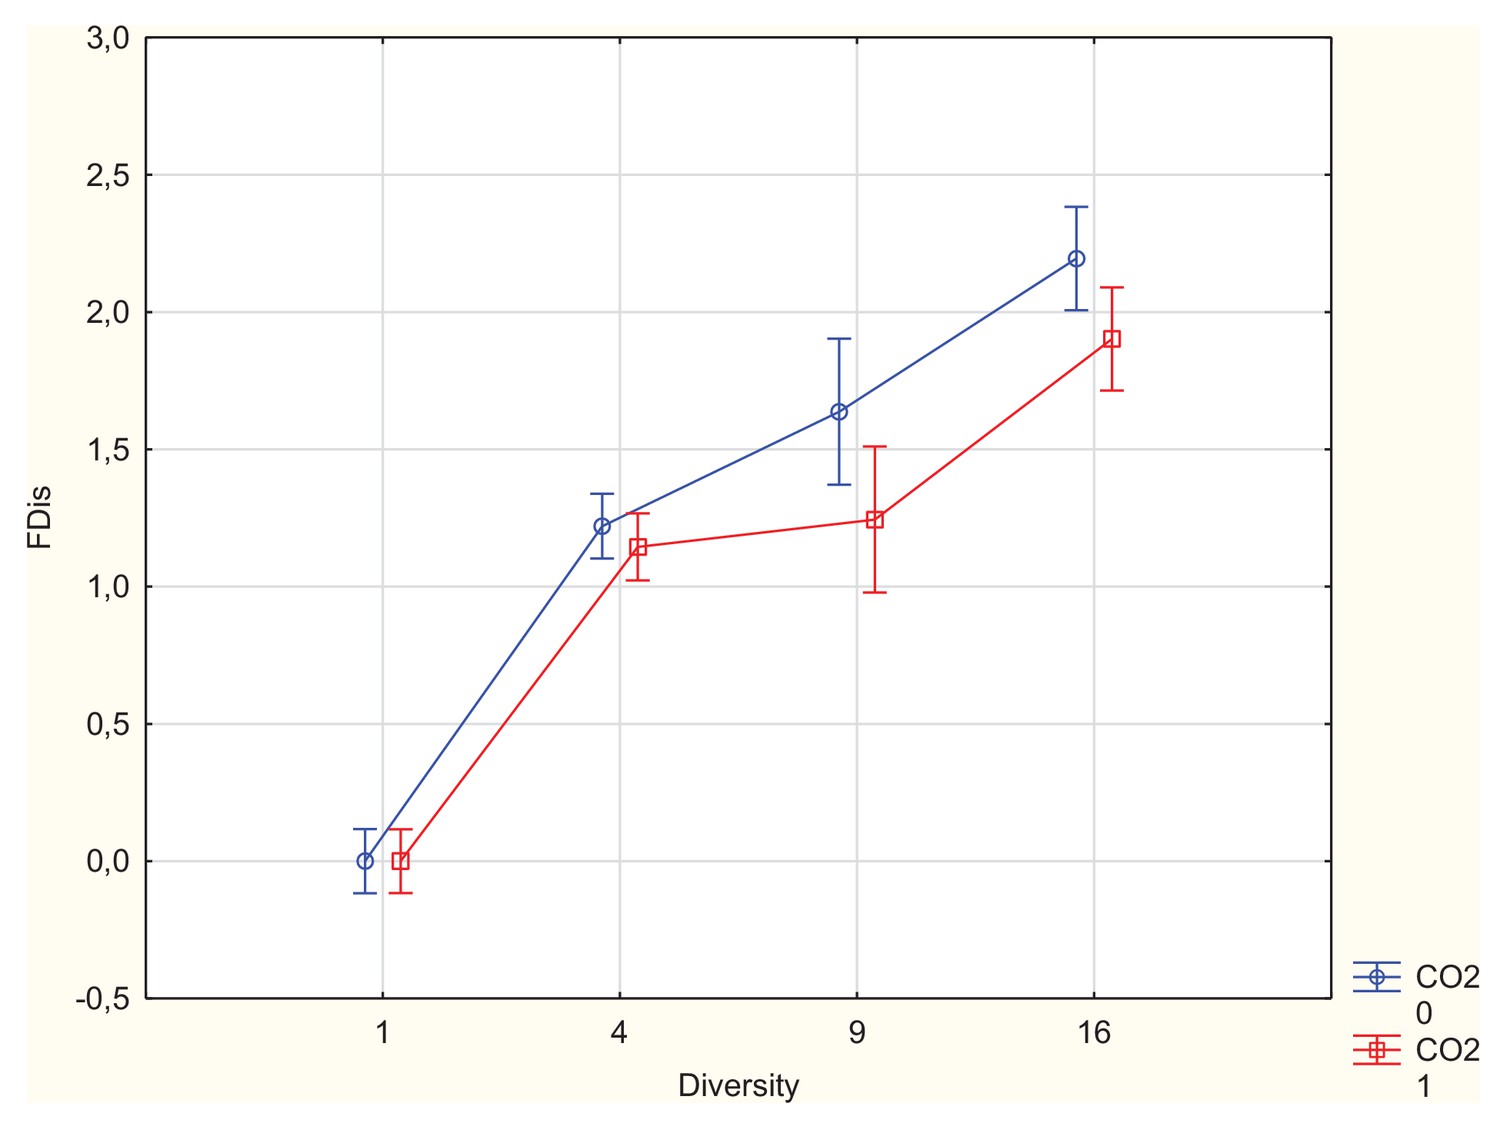
Plant species richness and CO2 effects on Functional Dispersion in the BioCON experiment.
For statistical results see main text. Means with 95% confidence intervals.
Figure 4—figure supplement 5

Plant species richness and N addition effects on Functional Dispersion in the BioCON experiment.
For statistical results see main text. Means with 95% confidence intervals.
Figure 5
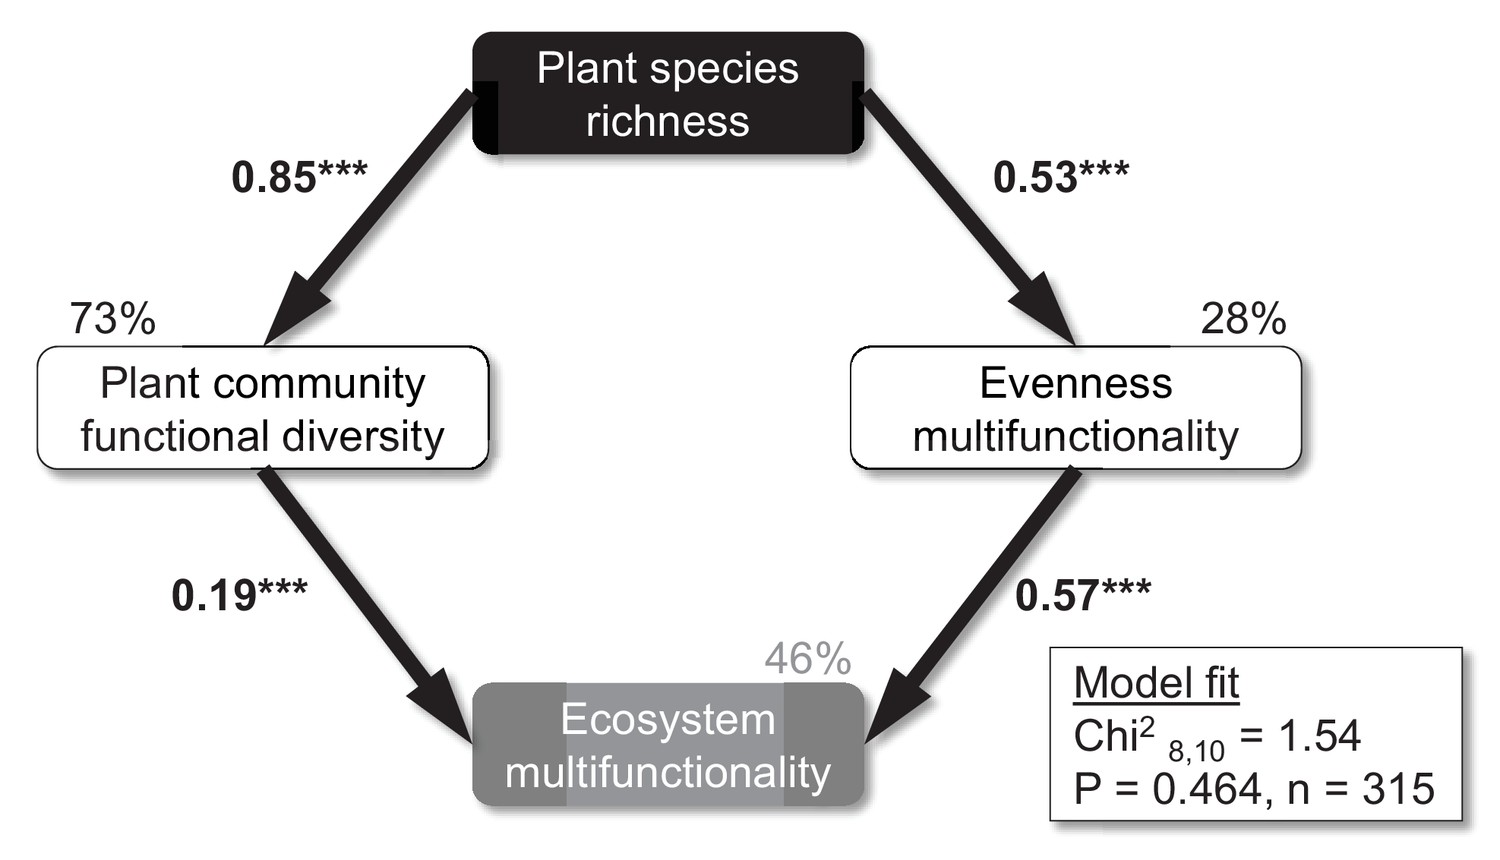
Mechanisms underlying plant diversity effects on ecosystem multifunctionality.
Structural equation model on the effects of sown plant species richness on the functional diversity of the plant community (functional dispersion), evenness of multiple functions, and ecosystem multifunctionality. Numbers on arrows are standardized path coefficients. All paths retained in this final model were significant (p<0.001). Percentages on boxes indicate the variance explained by the model. Modification indices were used to check if additional paths would improve the model. ***p<0.001.
Tables
Table 1
GLM table of F and p values on the effects of CO2 (ambient and elevated), N (ambient and elevated), plant species richness (PSR; one, four, nine, or 16 species; log-linear term), and all possible interactions on soil microbial biomass carbon, soil respiration, root biomass, water stable aggregates, and soil ecosystem multifunctionality using the averaging and the multiple thresholds approach.
Ring effects indicate variation across experimental blocks (six rings). Full model: model degrees of freedom (dfs) = 13 (dfs of all factors and interactions = 1, except for Ring [dfs = 6]), error dfs = 301; error dfs for Ring(CO2)=18.56; reduced model without monocultures: error dfs = 177; error dfs for Ring(CO2)=23.65; significant effects (p≤0.05) are given in bold; effects of ring are given in italics.
| CO2 | Ring(CO2) | N | PSR | CO2 x N | CO2 x PSR | N x PSR | CO2 x N x PSR | ||||||||||
| F | p | F | p | F | p | F | p | F | p | F | p | F | p | F | p | ||
| Single-soil functions | |||||||||||||||||
| Soil microbial biomass | <0.01 | 0.975 | 0.72 | 0.634 | 0.84 | 0.360 | 83.03 | <0.001 | 0.15 | 0.701 | 0.65 | 0.420 | 0.18 | 0.669 | <0.01 | 0.954 | |
| Soil respiration | 0.04 | 0.851 | 5.45 | <0.001 | 2.91 | 0.089 | 22.98 | <0.001 | 3.43 | 0.065 | 1.77 | 0.185 | 0.14 | 0.710 | 0.19 | 0.661 | |
| Root biomass | 0.25 | 0.621 | 1.77 | 0.105 | 1.15 | 0.285 | 80.23 | <0.001 | 2.03 | 0.155 | 0.14 | 0.714 | 0.72 | 0.398 | 0.01 | 0.940 | |
| Soil aggregate stability | 1.03 | 0.346 | 97.33 | <0.001 | 0.56 | 0.454 | 2.81 | 0.095 | 0.76 | 0.383 | 0.30 | 0.582 | 0.07 | 0.792 | 0.05 | 0.825 | |
| Ecosystem multifunctionality (EM) | 0.58 | 0.457 | 7.53 | <0.001 | 0.45 | 0.504 | 112.57 | <0.001 | 3.08 | 0.080 | 0.29 | 0.594 | 0.02 | 0.877 | 0.05 | 0.823 | |
| EM, without monocultures‘ | <0.01 | 0.953 | 8.65 | <0.001 | 2.90 | 0.091 | 26.87 | <0.001 | 2.57 | 0.111 | 0.50 | 0.479 | 3.21 | 0.075 | 1.03 | 0.311 | |
| EM, realized plant species richness‘‘ | 0.57 | 0.460 | 7.27 | <0.001 | <0.01 | 0.976 | 91.95 | <0.001 | 3.75 | 0.054 | 0.07 | 0.788 | 0.01 | 0.904 | 1.13 | 0.290 | |
| # Functions > 20% threshold | 0.45 | 0.503 | 1.58 | 0.152 | 1.85 | 0.175 | 79.44 | <0.001 | 4.34 | 0.038 | 0.80 | 0.373 | 0.86 | 0.355 | 1.46 | 0.222 | |
| # Functions > 40% threshold | 0.03 | 0.866 | 1.86 | 0.088 | 0.03 | 0.857 | 124.84 | <0.001 | 4.24 | 0.041 | 0.22 | 0.636 | 1.57 | 0.211 | 0.02 | 0.876 | |
| # Functions > 60% threshold | <0.01 | 0.993 | 4.35 | 0.003 | 0.20 | 0.657 | 64.47 | <0.001 | 1.18 | 0.278 | 0.03 | 0.867 | 0.02 | 0.889 | 3.87 | 0.050 | |
| # Functions > 80% threshold | 0.08 | 0.787 | 21.95 | <0.001 | 0.43 | 0.514 | 39.21 | <0.001 | 0.17 | 0.682 | 0.01 | 0.971 | 0.76 | 0.384 | 4.71 | 0.031 | |
-
‘without monocultures; only plant species richness levels 4, 9, and 16 used in the analysis
‘‘using realized species richness
Table 2
GLM table of F and p values on the effects of CO2 (ambient and elevated), N (ambient and elevated), plant species richness (PSR; one, four, nine, or 16 species; log-linear term), and all possible interactions on realized plant species richness, Shannon diversity index of plants, Simpson evenness of plants, aboveground plant biomass, Shannon diversity index of soil functions, and evenness of soil functions.
Ring effects indicate variation across experimental blocks (six rings). Model degrees of freedom (dfs) = 13 (dfs of all factors and interactions = 1, except for Ring [dfs = 6]), error dfs = 301; error dfs for Ring(CO2)=18.56; significant effects (p<0.05) are given in bold; effects of ring are given in italics.
| CO2 | Ring(CO2) | N | PSR | CO2 x N | CO2 x PSR | N x PSR | CO2 x N x PSR | |||||||||||||||||
| F | p | F | p | F | p | F | p | F | p | F | p | F | p | F | p | |||||||||
| Plant community responses | ||||||||||||||||||||||||
| Realized plant species richness | 0.01 | 0.938 | 1.11 | 0.355 | <0.01 | 0.949 | 1040.30 | <0.001 | 0.64 | 0.424 | 0.01 | 0.908 | 12.34 | <0.001 | 7.20 | 0.008 | ||||||||
| Shannon diversity | 0.82 | 0.365 | 0.86 | 0.526 | 0.40 | 0.528 | 761.67 | <0.001 | 0.26 | 0.590 | 5.81 | 0.017 | 11.62 | <0.001 | 5.03 | 0.026 | ||||||||
| Shannon evenness | 0.11 | 0.736 | 0.40 | 0.880 | 0.27 | 0.604 | 445.43 | <0.001 | <0.01 | 0.982 | 0.12 | 0.726 | 5.02 | 0.026 | 0.09 | 0.965 | ||||||||
| Simpson evenness | 0.91 | 0.342 | 1.05 | 0.392 | 0.72 | 0.397 | 622.34 | <0.001 | 0.09 | 0.763 | 6.28 | 0.013 | 8.05 | 0.005 | 3.43 | 0.065 | ||||||||
| Functional richness | 0.06 | 0.802 | 0.44 | 0.853 | 0.03 | 0.874 | 597.98 | <0.001 | 0.04 | 0.842 | 0.19 | 0.667 | 0.13 | 0.724 | 1.41 | 0.236 | ||||||||
| Functional evenness | 1.68 | 0.203 | 3.33 | 0.007 | 1.16 | 0.283 | 30.52 | <0.001 | 2.94 | 0.089 | 2.36 | 0.127 | 0.29 | 0.592 | 0.87 | 0.353 | ||||||||
| Functional divergence | 0.46 | 0.498 | 0.96 | 0.455 | 0.61 | 0.434 | 970.50 | <0.001 | 0.11 | 0.740 | 0.67 | 0.415 | 0.15 | 0.703 | 0.51 | 0.475 | ||||||||
| Functional dispersion | 0.57 | 0.453 | 1.12 | 0.353 | 0.35 | 0.555 | 905.91 | <0.001 | 0.02 | 0.893 | 7.71 | 0.006 | 4.71 | 0.031 | 0.71 | 0.399 | ||||||||
| Aboveground plant biomass | 0.99 | 0.323 | 1.52 | 0.171 | 6.71 | 0.010 | 65.37 | <0.001 | 0.54 | 0.463 | 0.28 | 0.596 | 0.01 | 0.926 | 0.20 | 0.657 | ||||||||
| Ecosystem multifunctionality | ||||||||||||||||||||||||
| Shannon diversity index of soil functions | 0.05 | 0.827 | 5.93 | <0.001 | 2.03 | 0.155 | 115.34 | <0.001 | 0.91 | 0.340 | 0.43 | 0.512 | 1.39 | 0.234 | 0.13 | 0.718 | ||||||||
| Evenness of soil functions | 0.11 | 0.652 | 6.24 | <0.001 | 0.58 | 0.449 | 135.63 | <0.001 | 0.80 | 0.371 | 0.46 | 0.500 | 0.96 | 0.327 | 0.51 | 0.477 | ||||||||
Additional files
-
Supplementary file 1
Supplementary Table S1.
- https://doi.org/10.7554/eLife.41228.014
-
Supplementary file 2
Supplementary Document A1.
- https://doi.org/10.7554/eLife.41228.015
-
Supplementary file 3
Supplementary Table S2.
- https://doi.org/10.7554/eLife.41228.016
-
Transparent reporting form
- https://doi.org/10.7554/eLife.41228.017
Download links
A two-part list of links to download the article, or parts of the article, in various formats.
Downloads (link to download the article as PDF)
Open citations (links to open the citations from this article in various online reference manager services)
Cite this article (links to download the citations from this article in formats compatible with various reference manager tools)
Plant diversity maintains multiple soil functions in future environments
eLife 7:e41228.
https://doi.org/10.7554/eLife.41228


