Meta-Research: Centralized scientific communities are less likely to generate replicable results
- University of Chicago, United States
- Stanford University, United States
- Santa Fe Institute, United States
Figures
Figure 1 with 2 supplements
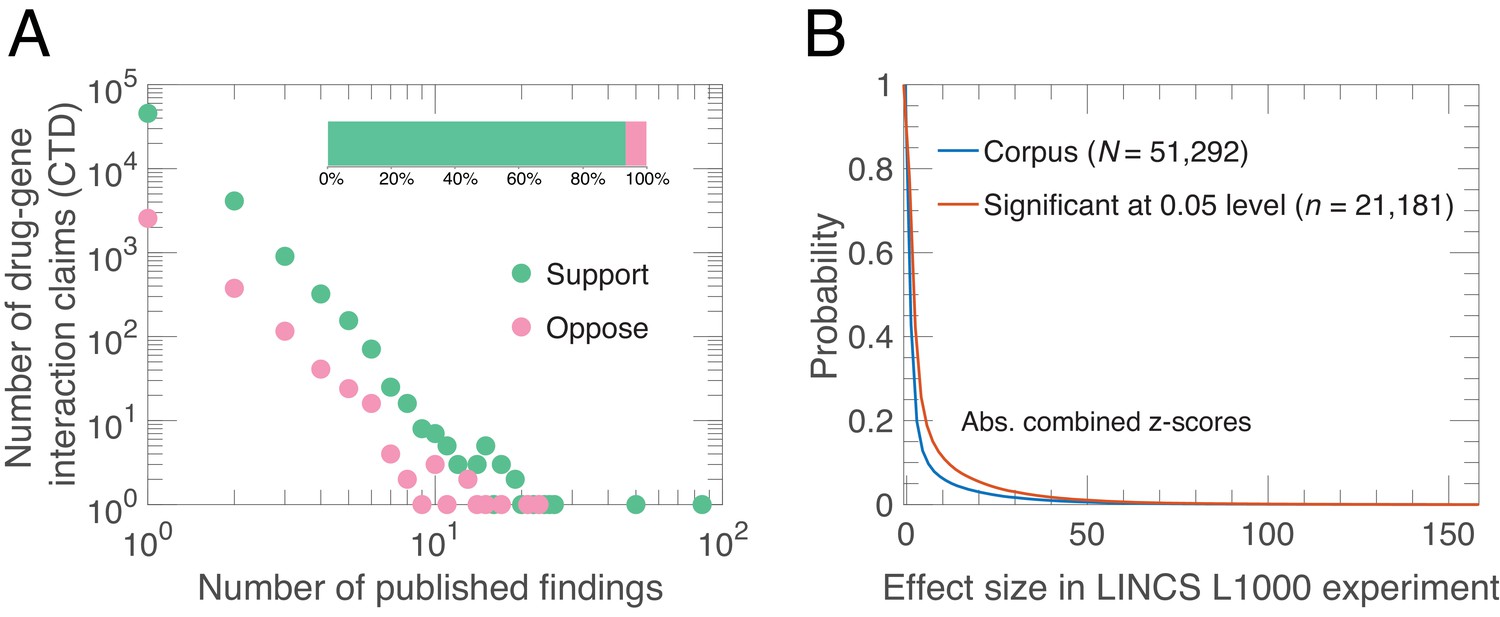
Alignment of drug-gene interaction (DGI) claims reported in the literature with DGI claims from high-throughput experiments.
(A) Our analysis of 51,292 DGI claims (see Supplementary file 1) in the literature revealed 60,159 supporting findings (green) and 4253 opposing findings (pink) in aggregate. These DGI claims co-occurred in both the CTD publication dataset and the LINCS L1000 exerimental dataset. Most claims (45,624) were supported by just one published finding, 4127 claims were supported by two published findings, and the remaining 1541 claims were supported by three or more published findings. Some claims (3154) were both supported and opposed by the published findings, meaning that in addition to the supporting finding(s), there is one or more increase/decrease interactions in the CTD dataset that propose the opposite effect: 2563 claims were opposed by one, 376 by two, and 215 by three or more published findings. Please note that both axes in the main graph are logarithmic. (B) We calculated experimental effect sizes with combined z-scores for the 51,292 DGI triples in the LINCS L1000 dataset. This graph plots the probability (y-axis) versus absolute value of the combined z-score for all triples (blue line) and those that are significant at the 0.05 level (salmon line). Significant in this context means that the drug-gene effect is observed across a range of experiment conditions; the method used to determine significance is described in Materials and methods.
Figure 1—figure supplement 1

Publications that share authors are more likely to agree about the direction of a drug-gene interaction than publications with distinct authors, computed among pairs of papers reporting claims in the sub-corpus of 2493 claims.
(A) Bootstrap samples of agreement (1 = agreement, 0 = disagreement) among pairs of papers that reported findings about the same drug-gene interaction depending on whether the pairs of papers shared (2514 pairs of papers) or did not share author(s) in common (20,846 pairs of papers). (B) A two-tailed bootstrap test of difference between means indicates that papers with one or more authors in common have significantly higher agreement rates than pairs of papers with distinct authors (100,000 samples with replacement). The solid dark line indicates the sample mean, the dashed line indicates 95% CI, and the red line indicates the null hypothesis.
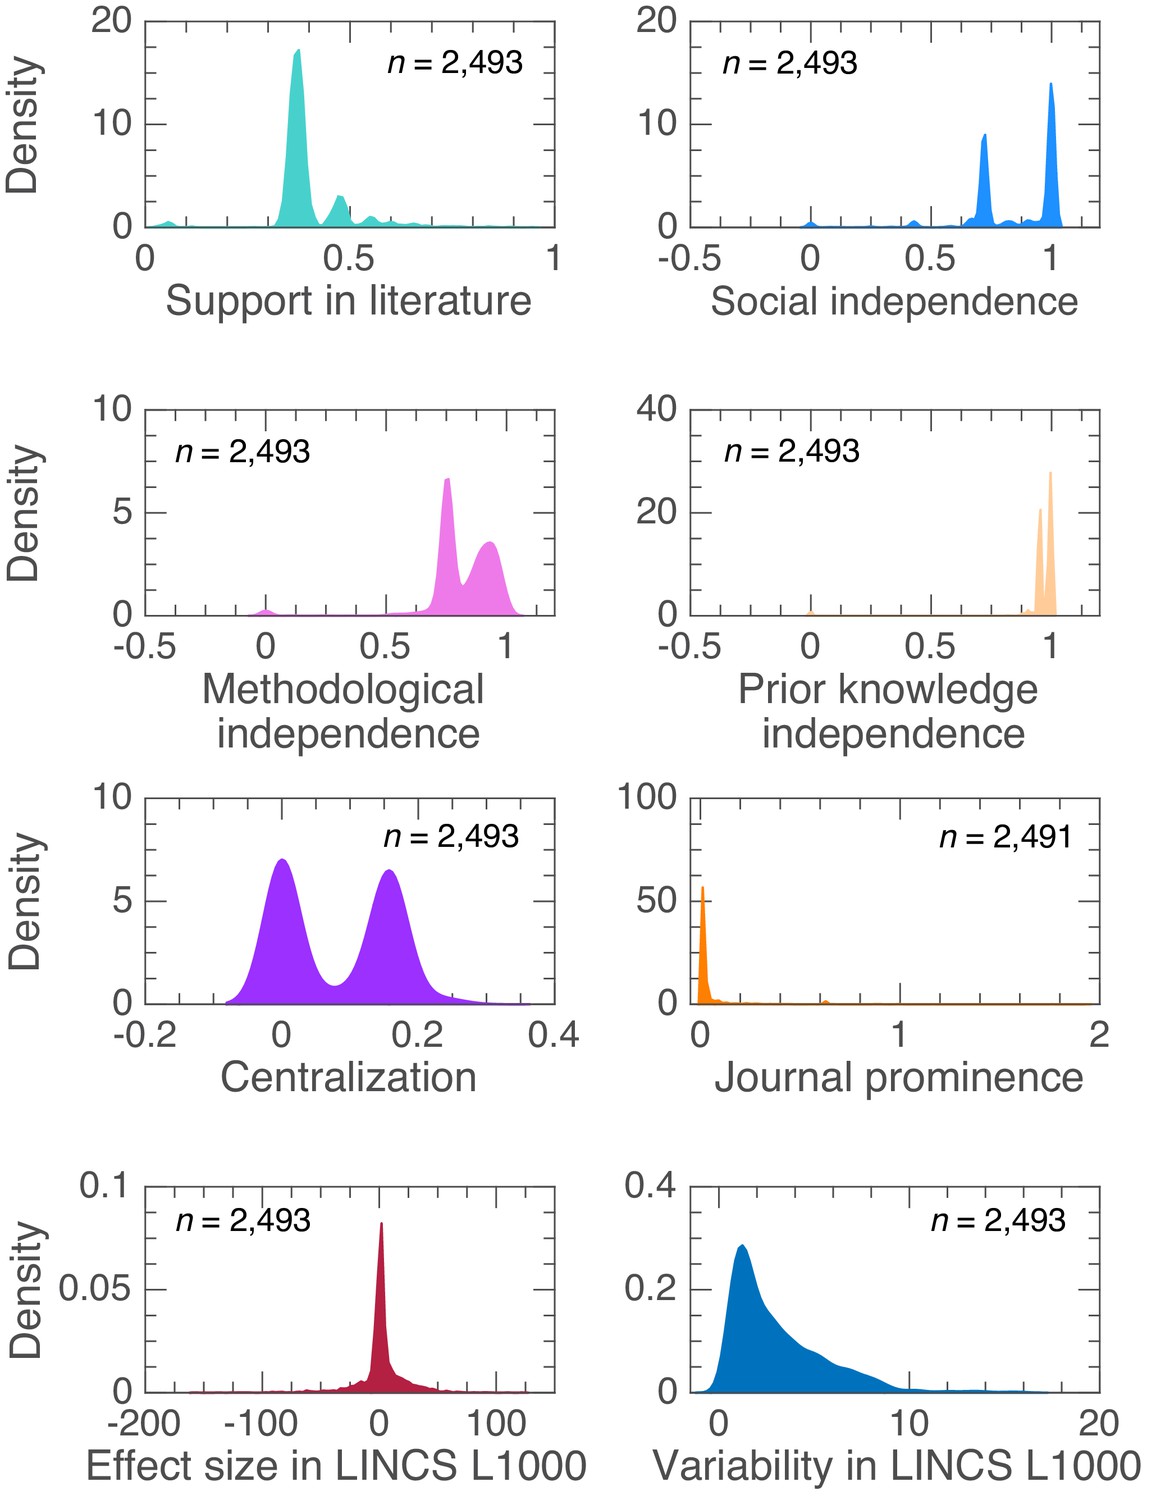
Figure 1—figure supplement 2
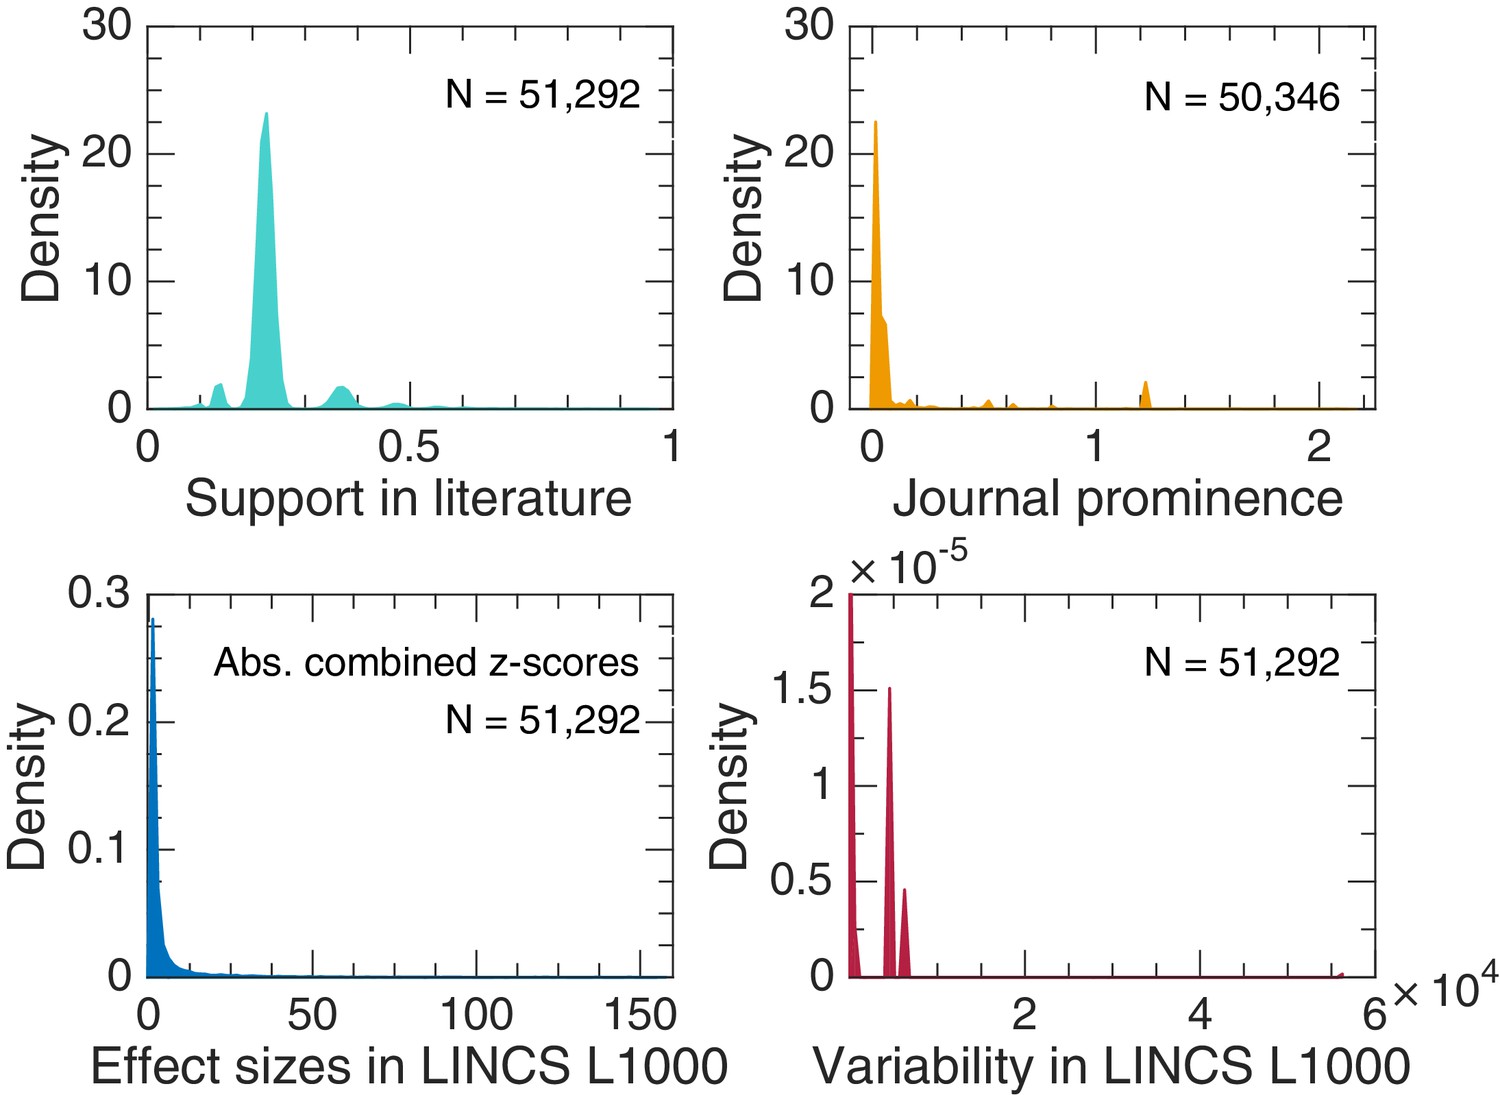
Estimates of probability density functions for variables of interest in our corpus using a normal kernel function.
We used the normal kernel function to estimate probability density functions.
Figure 2 with 2 supplements
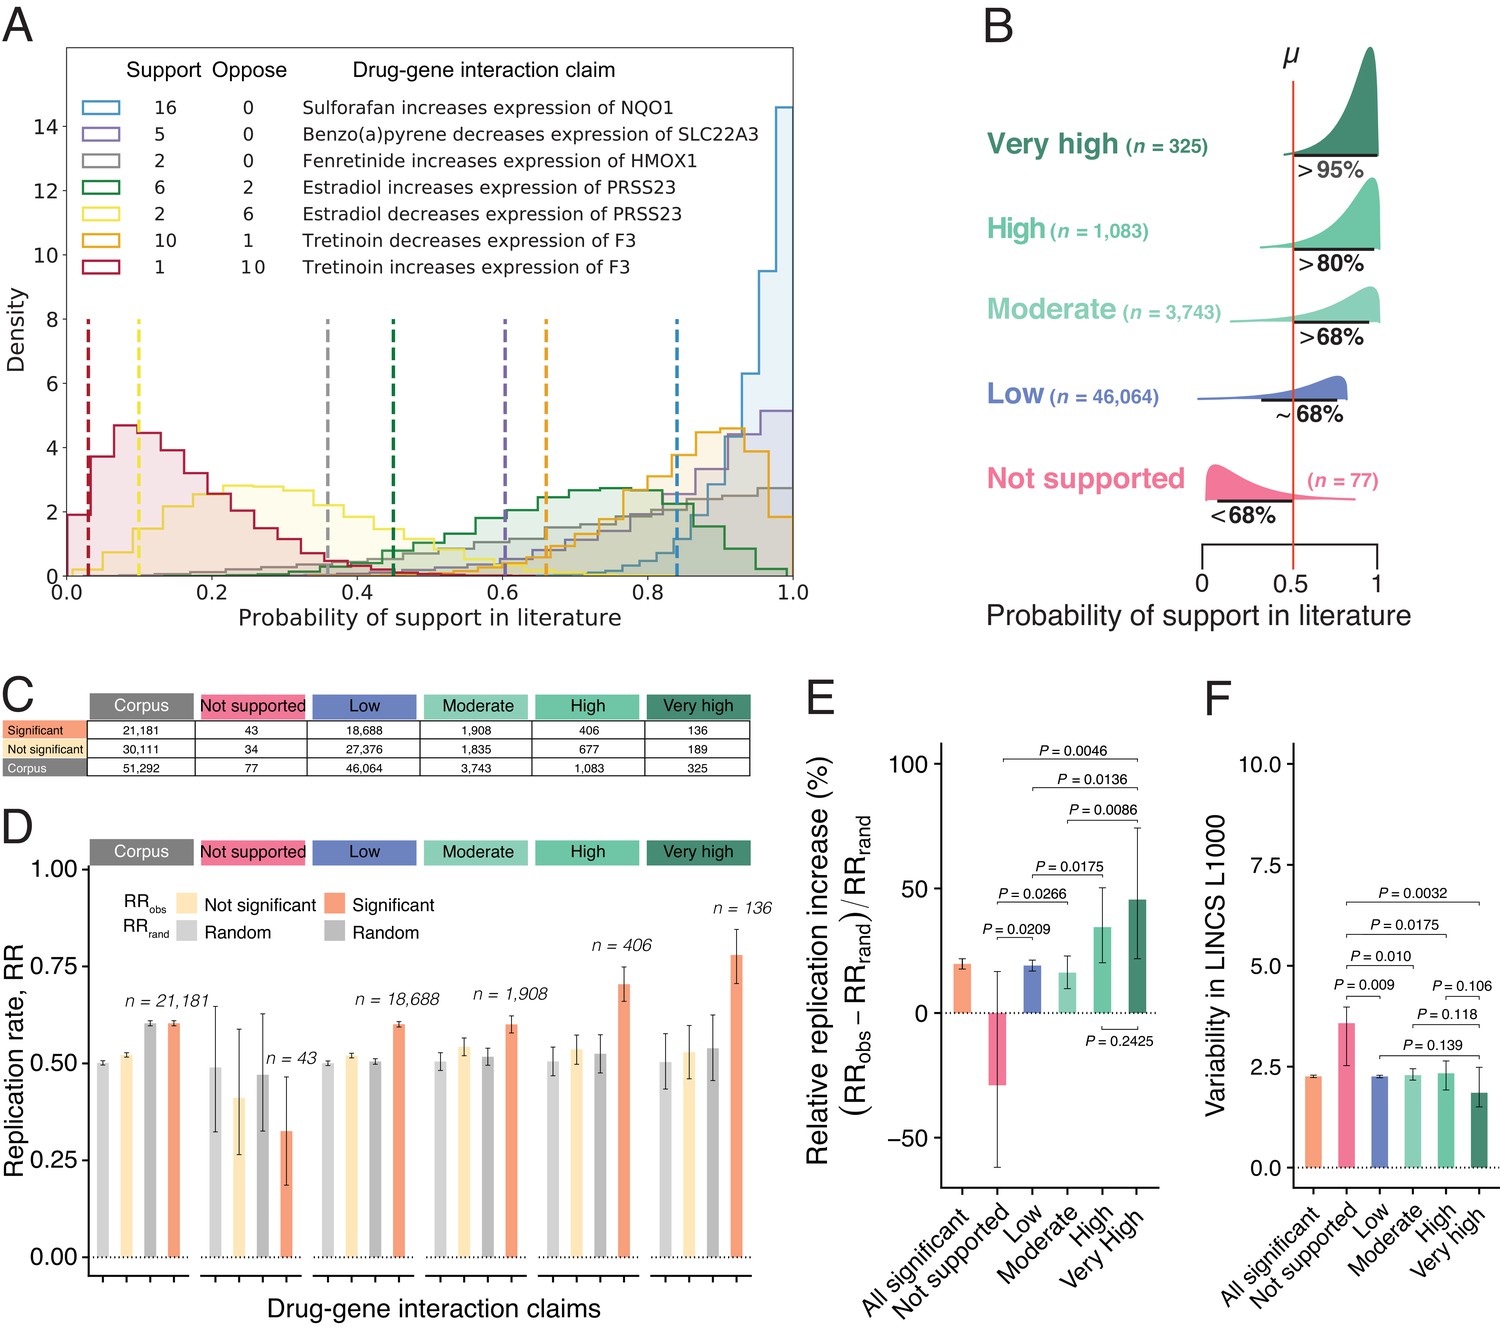
Estimates of claim replication as a function of the probability of support in the literature and generalizability across high-throughput experiments.
(A) Posterior distributions of probability of support in the biomedical literature for a sample of seven DGI claims for which there are at least two findings (supporting and/or opposing). Note that the top three claims receive only supporting findings in the literature, whereas the fourth and fifth claims are opposites (so papers that support the fourth claim oppose the fifth claim, and vice versa), and likewise for the sixth and seventh claims. We obtained model estimates for each claim by performing 10,000 Markov chain Monte Carlo (MCMC) sampling iterations (see Materials and methods). For each claim, we summarize the probability of support (dashed vertical line) using the lower bound on the one-sided 95% posterior credible interval: this value ranges from 0.84 for a claim that is supported by 16 findings and opposed by no findings, to 0.03 for a claim that is supported by one finding and opposed by 10 findings. (B) DGI claims in the literature can be categorized into one of five classes of support (Very High; High; Moderate; Low; Not Supported) on the basis of distributions like those in panel A; the number of claims included in each class is shown in brackets. (C) Number of DGI claims that are significant (second row) and not significant (third row) at the 0.05 level in the LINCS L1000 dataset for the whole corpus (second column) and for each of the five classes of support in the literature (columns 3–7). (D) Observed replication rates (RRobs) and expected replication rates (RRrand) for claims that are significant and non-significant in the LINCS L1000 dataset for the whole corpus (left) and for each of the five classes of support in the literature. (E) The relative replication increase rate () for claims that are significant in the LINCS L1000 dataset (left) and for each of the five classes of support in the literature. (F) Variability (coefficient of variation) in the LINCS L1000 dataset across cell lines, durations and dosages for claims that are significant in this dataset (left) and for each of the five classes of support in the literature. Statistical significance and error bars were determined by bootstrapping (see Materials and methods). All error bars represent 95% CI.
Figure 2—figure supplement 1
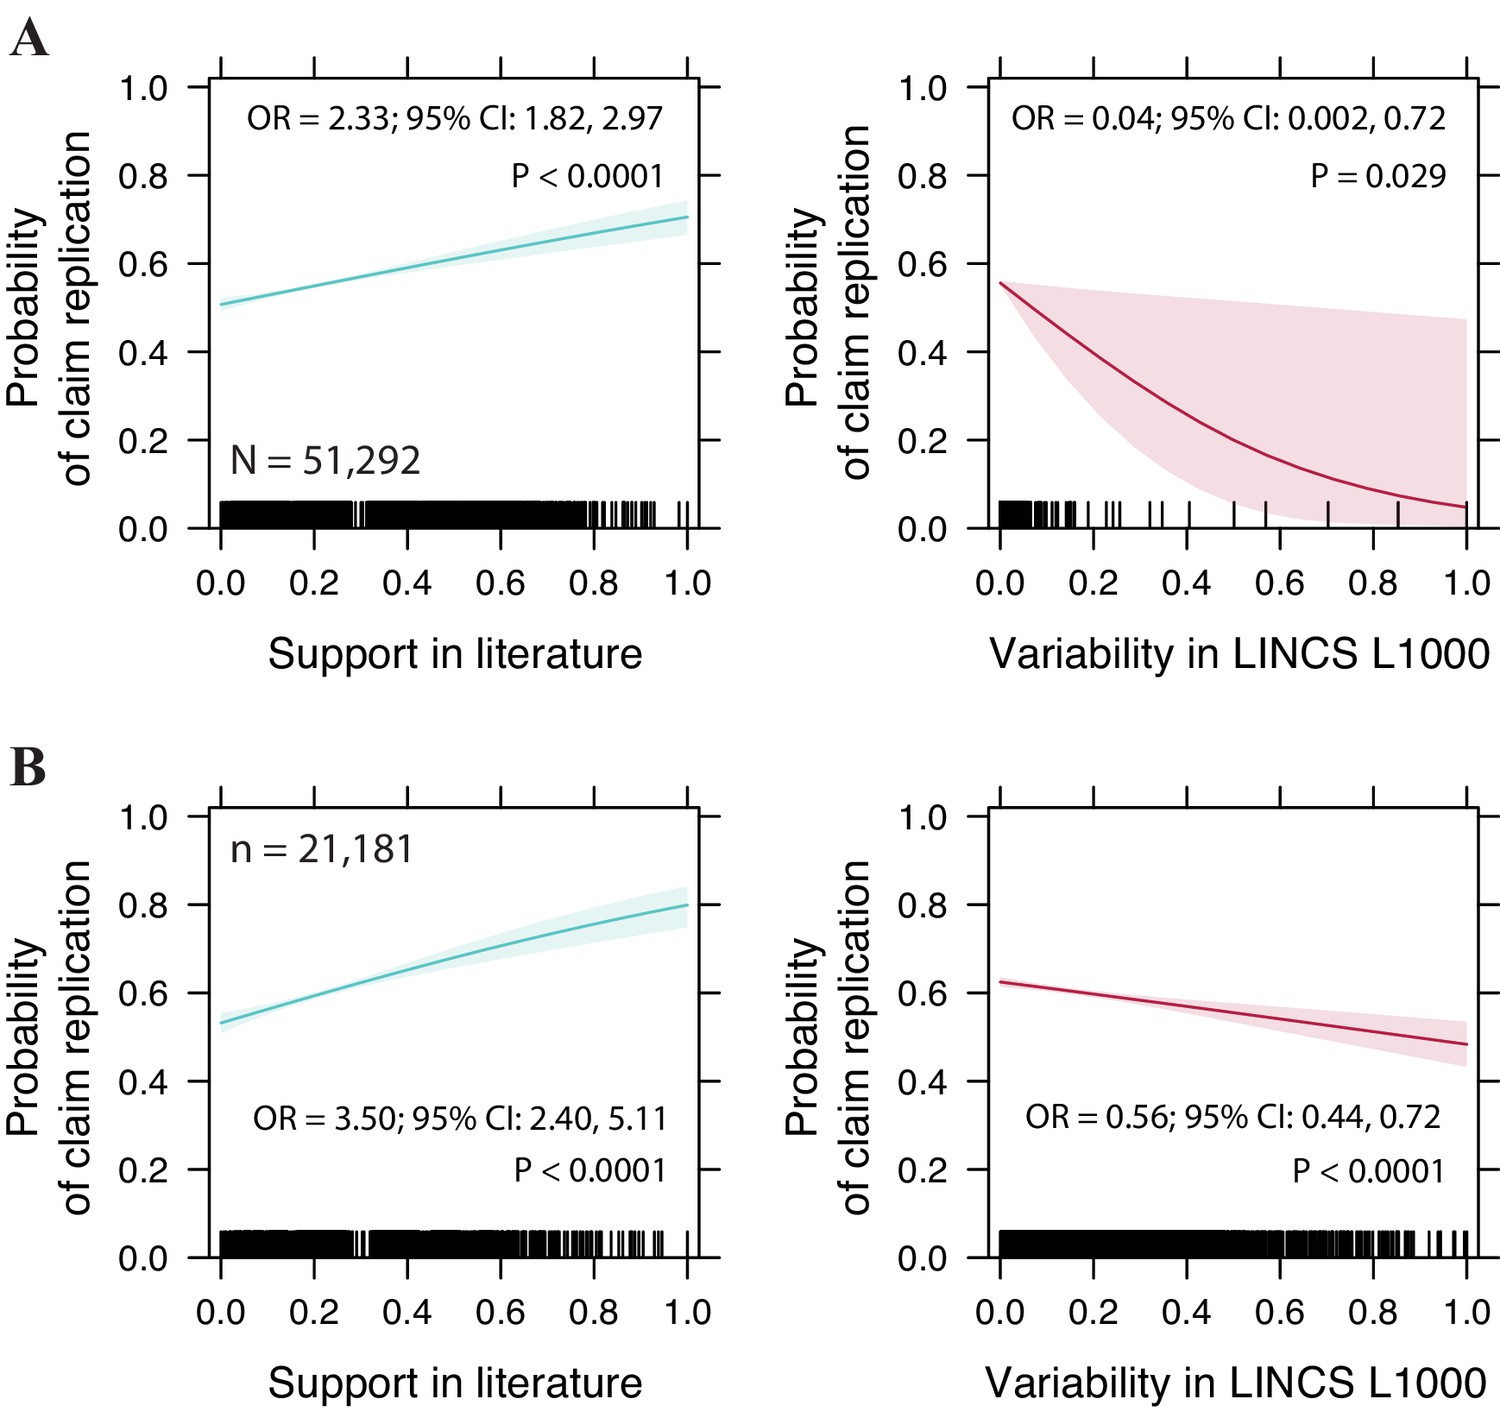
Replication increases with claim’s probability of support in the literature.
(A) Probability of claim replication estimated via a logistic regression model with replication as the response variable and support in the literature and experimental variability as predictors, for the whole corpus of 51,292 claims. (B) Same as A but for the subset of 21,181 significant drug-gene interactions in LINCS L1000. For each variable, we indicate odds ratios (OR), 95% confidence interval, and significance.
Figure 2—figure supplement 2
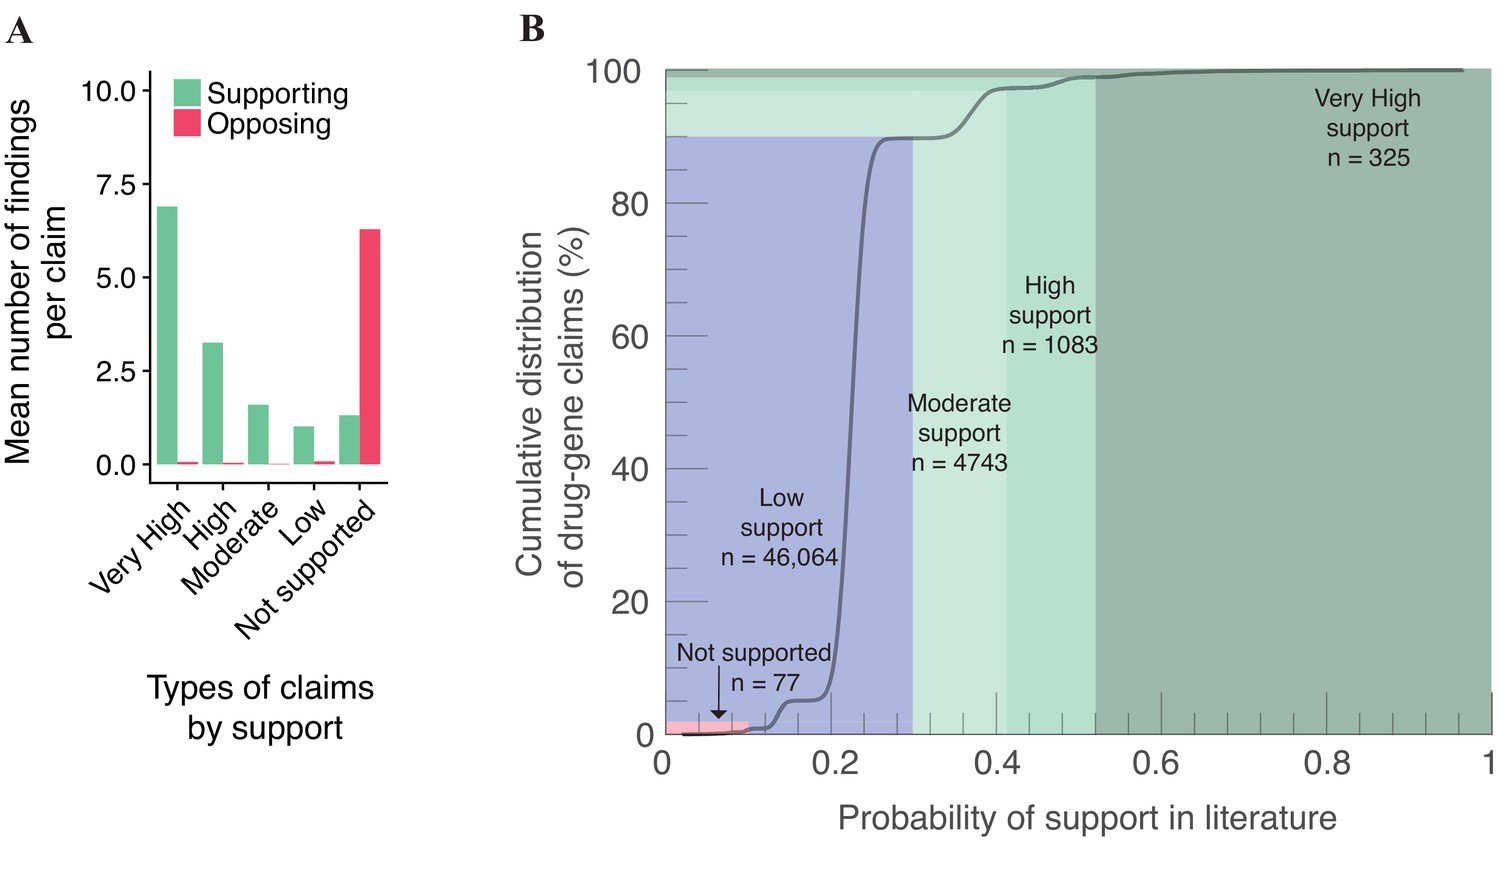
Description of claim types in the whole corpus of 51,292 claims.
(A) Mean number of findings supporting or opposing the direction of the effect for a scientific claim across our typology. (B) Cumulative distribution of the probability of support in the literature, including a schematic of our claim typology.
Figure 3 with 2 supplements
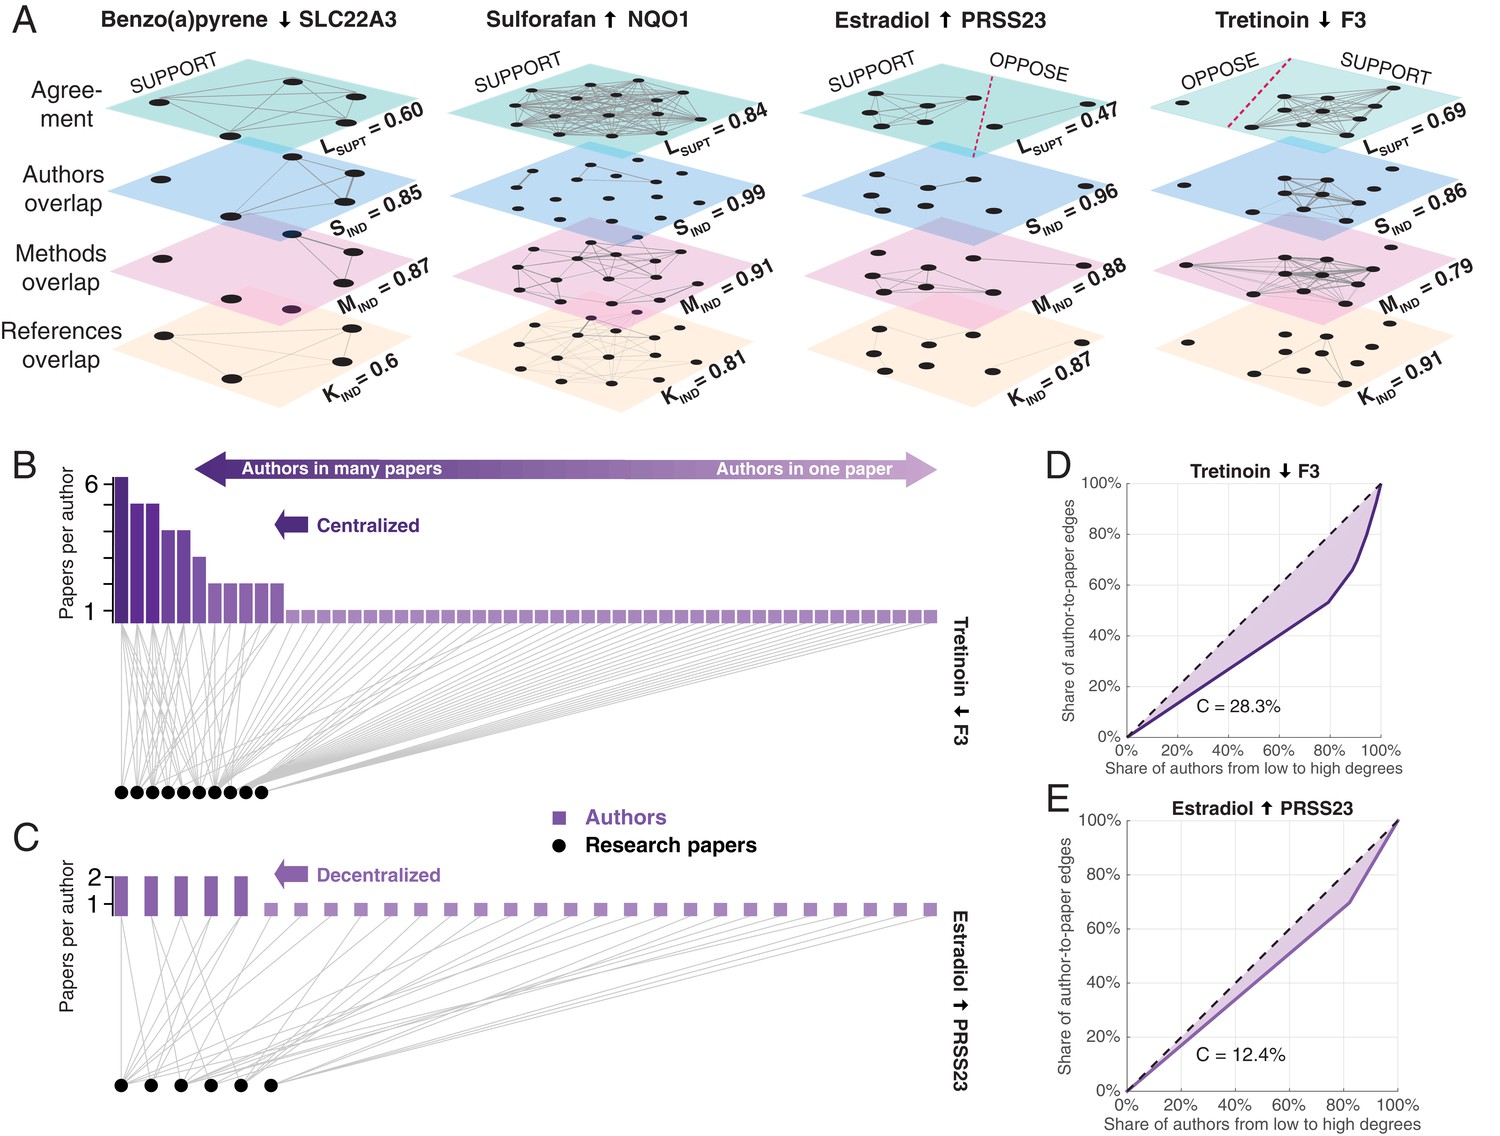
Exemplary networks comprising social, methodological, and references dependences and centralization patterns in scientific communities.
(A) Multilayer networks for four of the claims shown in Figure 2A. The nodes in each layer are scientific papers. Pairs of papers are connected by an unweighted edge in the top layer if they agree on the effect direction, and by a weighted edge in the other layers if there is an overlap of authors (second layer), methodologies (third layer) or references to prior publications (fourth layer): the thickness of the weighted edges is proportional to the overlap (Jaccard coefficient; JC); for clarity, we only plot edges above the mean JC value in the third layer. Dashed red lines in the top layer separate supporting and opposing findings. Each layer is associated with a score: support in the literature Lsupt, social independence Sind, methodological independence Mind, and knowledge independence Kind (see ‘Network dependencies and centralization’ in Methods and materials). Figures plotted with Pymnet (Kivelä, 2017). (B) Bipartite network with edges connecting authors (rectangles) to the papers they published (circles) for the 10 papers that support the claim shown in the fourth panel of Figure 3A. A small group of investigators author most of these papers, while most investigators author only one paper, making this a centralized network. The Gini coefficient (see Materials and methods) for this network is 28.3%. (C) Bipartite network for the six papers that support the claim shown in the third panel of Figure 3A. Here all investigators author relatively comparable numbers of papers: this decentralized network has a Gini coefficient of 12.4%. (D, E) Lorenz curves for the examples shown in B and C.
Figure 3—figure supplement 1
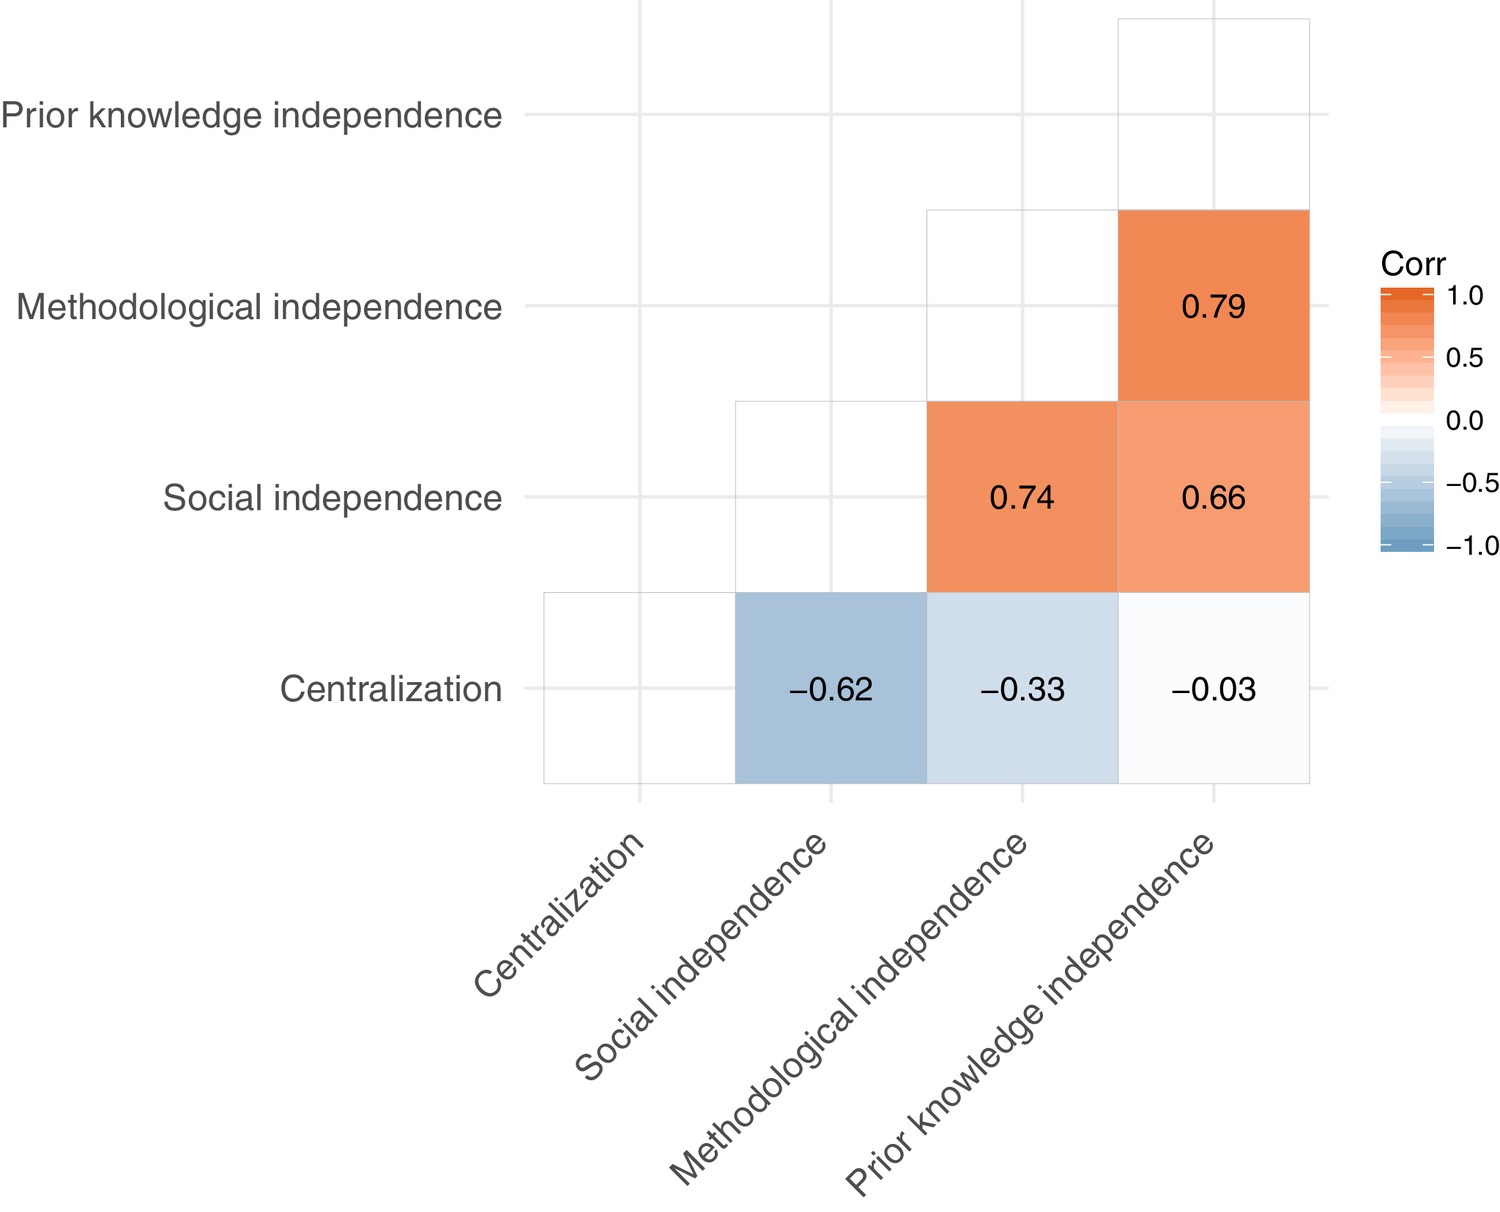
Pearson correlation coefficients between network indices.
Social, methodological, and prior knowledge independencies are positively correlated with each other and negatively correlated with the network centralization of scientific communities. n = 2493 claims.
Figure 3—figure supplement 2

Papers and pairs of papers are differentiated by the number of findings they report (in the sub-corpus of 2493 claims).
(A) Distribution of papers against the number of supporting findings they report. (B) Distribution of pairs of papers against the number of supporting findings they report.
Figure 4 with 5 supplements
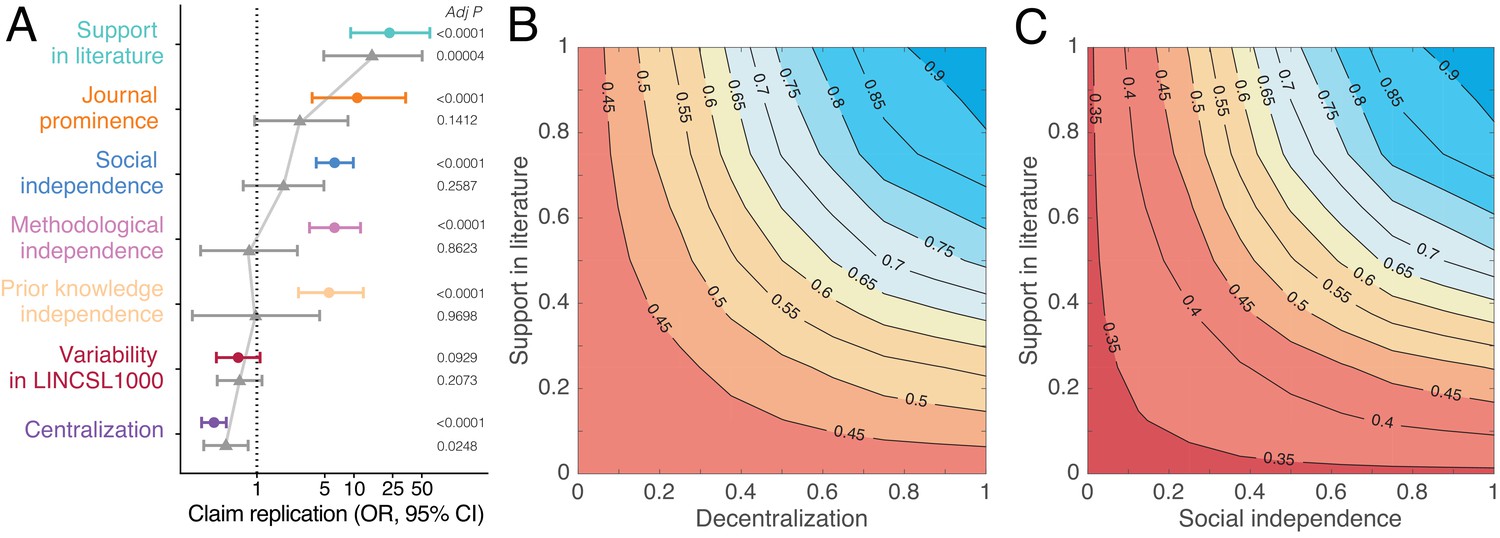
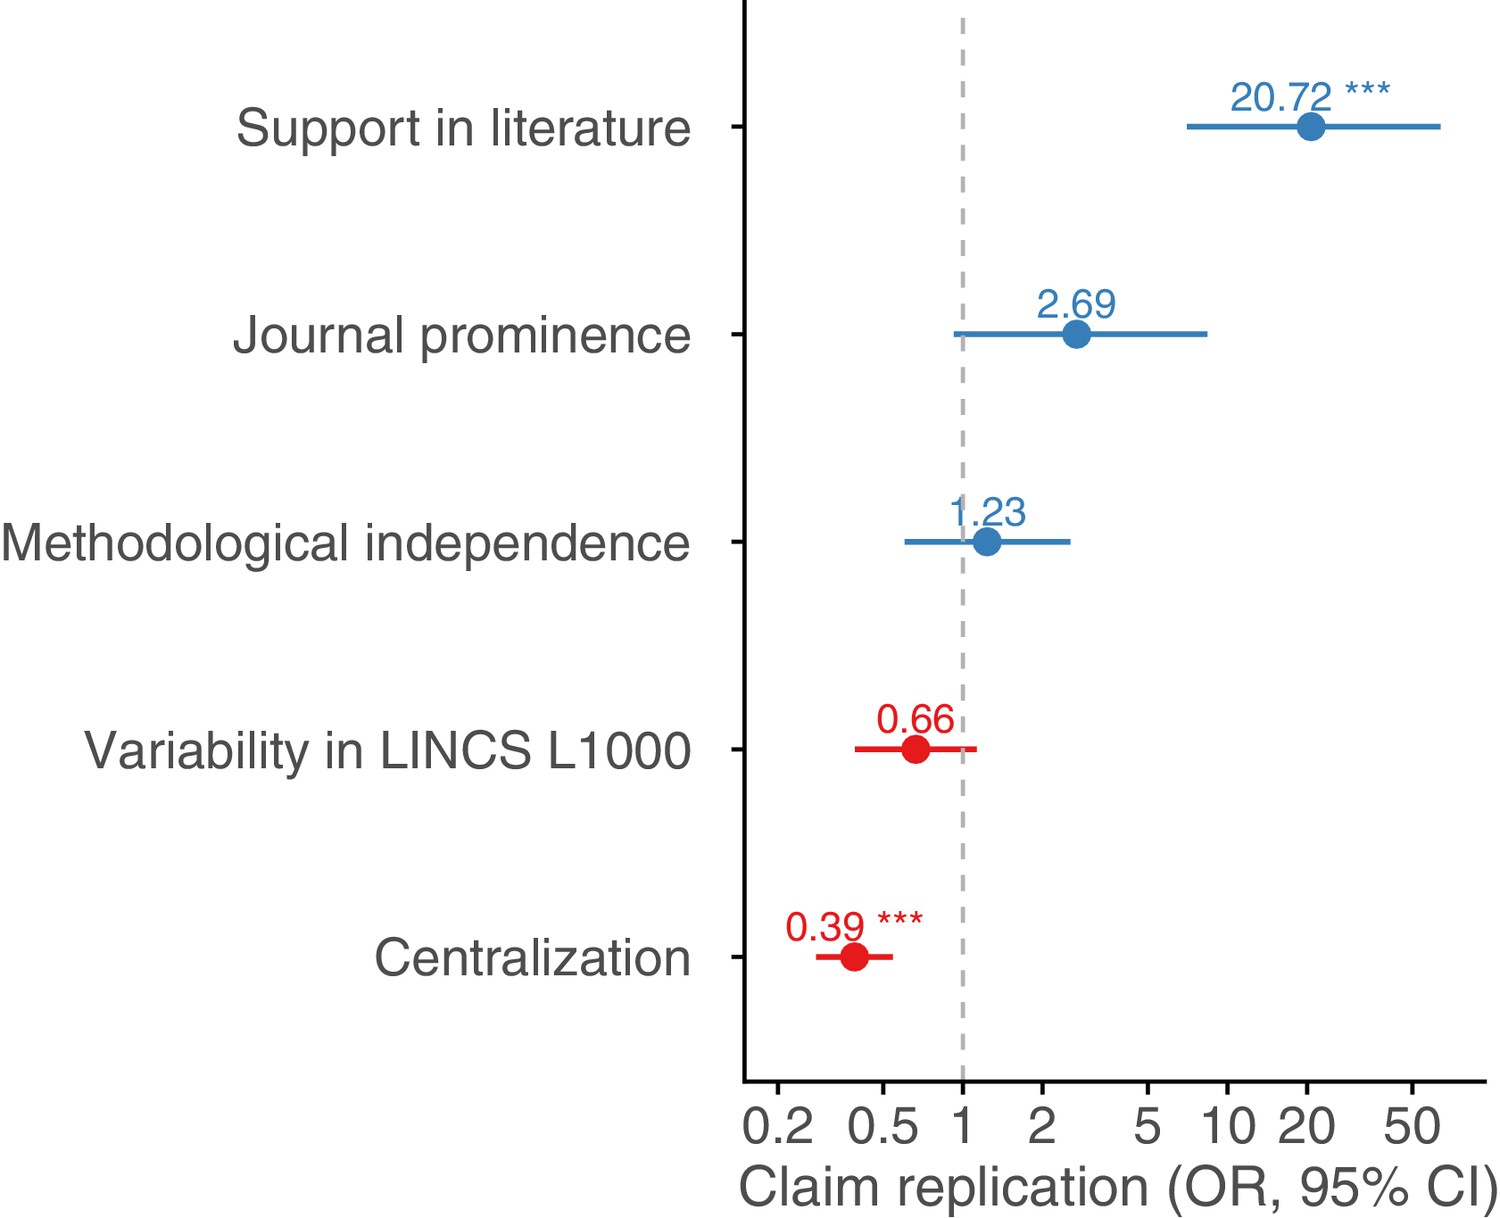
Predictors of replication success.
(A) Odds ratios derived from logistic regression models with claim replication as the response variable and seven predictors modeled independently (disconnected colored dots; n = 2493) and simultaneously (connected grey triangles; n = 2491). Predictors are rescaled for comparability. P-values are adjusted for multiple comparisons using the Benjamini–Hochberg (Benjamini and Hochberg, 1995) procedure. (B–C) Contour plots showing that the predicted probability of claim replication (derived from logistic regression models with interaction terms, see also Figure 4—figure supplements 2,3) increases with decentralization and support in the literature (B), and with social independence and support in the literature (C), after adjusting for variability in LINCS L1000.
Figure 4—figure supplement 1
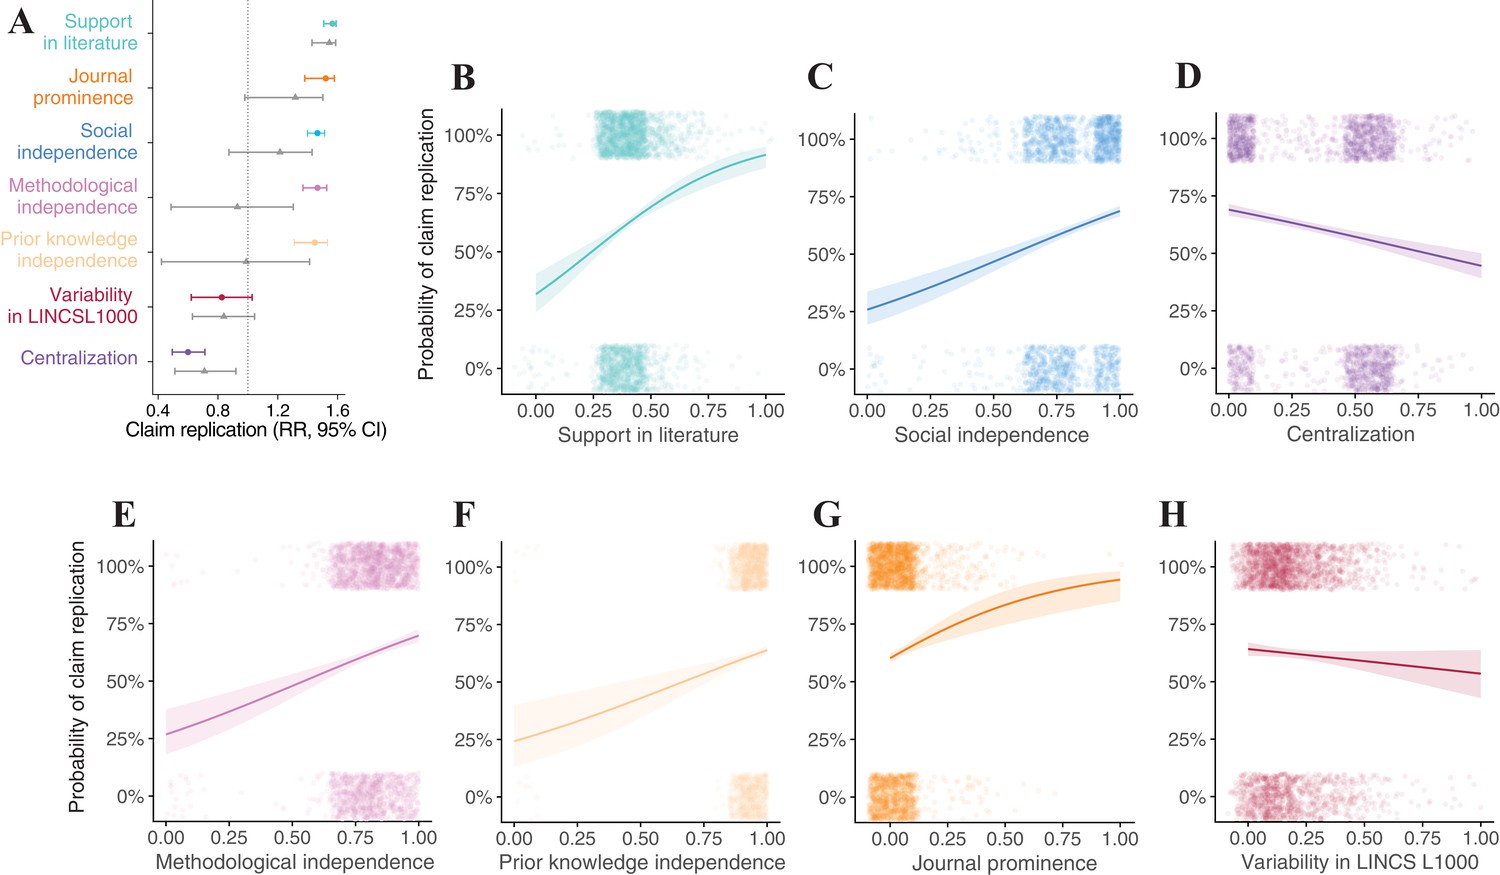
Predictors of replication success.
(A) Relative risk (RR) of claim replication derived from the logistic regression models in Figure 4A. (B–H) Predicted probabilities (PP) of claim replication for the logistic regression models in Figure 4A of independent predictors with 95% error bounds. n = 2493 claims (n = 2491 in the Journal prominence model).
Figure 4—figure supplement 2
Claims reported by centralized communities less likely replicate.
(A–C) Logistic interaction model with claim replication as the response variable regressed on support in the literature and author centralization as interacting predictors, controlling for variability in LINCS L1000 across cell lines, durations, and dosages. Predictors are rescaled for comparability. n = 2493 claims. *** p < 0.001; ** p < 0.01; * p < 0.05.
Figure 4—figure supplement 3
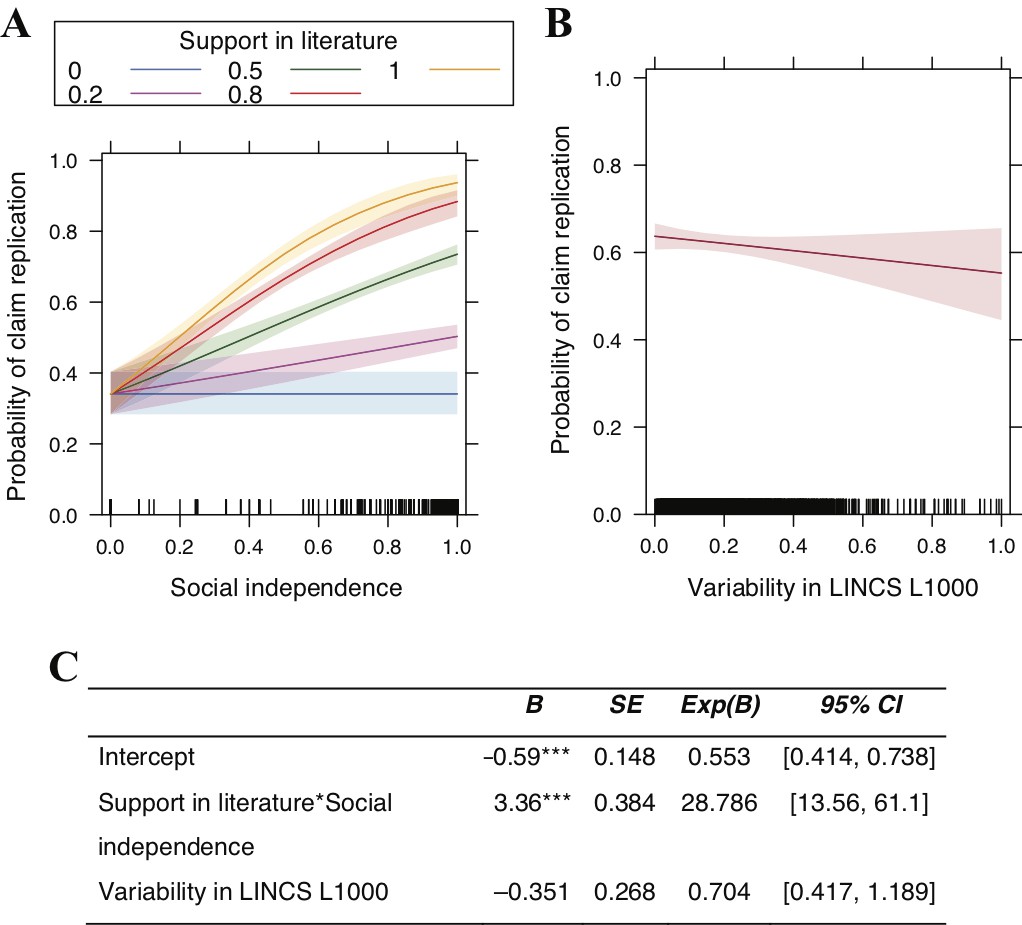
Claims reported by multiple socially independent teams more likely replicate.
(A–C) Logistic interaction model with claim replication as the response variable regressed on support from the literature and social independence as interacting predictors, controlling for variability in LINCS L1000 across cell lines, durations, and dosages. Predictors are rescaled for comparability. n = 2493 claims. *** p < 0.001; ** p < 0.01; * p < 0.05.
Figure 4—figure supplement 4
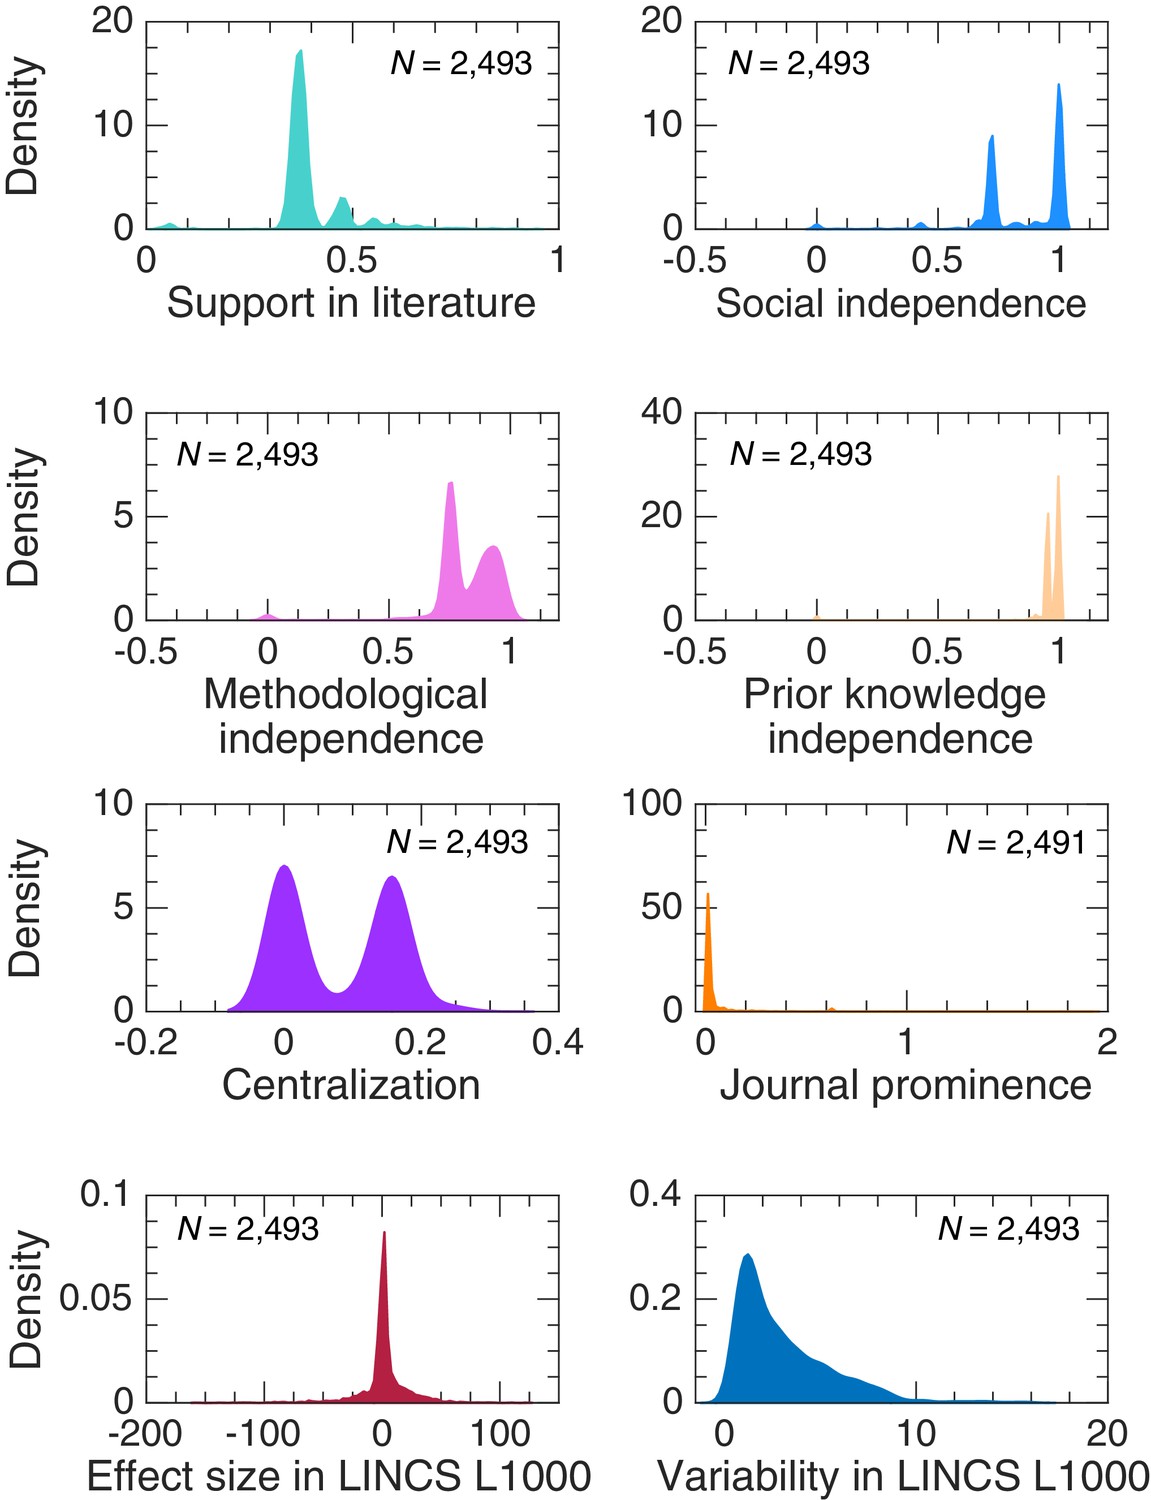
Estimates of probability density functions for our variables on the sub-corpus of claims with determined direction of the drug-gene effect in CTD and LINCS L1000.
We used the normal kernel function to estimate probability density functions.
Figure 4—figure supplement 5
Support in the literature and decentralization of scientific communities remain strong and significant predictors of claim replication success after we account for multicollinearity.
Odds ratios derived from logistic model with replication as the response variable, including only predictors with relatively low variance inflation factor (VIF <4). Predictors are rescaled for comparability. n = 2491 claims. *** p < 0.001; ** p < 0.01; * p < 0.05.
Additional files
-
Supplementary file 1
Data about the corpus of 51,292 drug-gene interaction claims.
- https://doi.org/10.7554/eLife.43094.017
-
Supplementary file 2
Data about the sub-corpus of 2493 drug-gene interaction claims for which there are two or more published findings.
- https://doi.org/10.7554/eLife.43094.018
-
Supplementary file 3
Logistic regression models with claim replication R [Replicated = 1, Non-replicated = 0] as response variable and predictors modelled independently.
- https://doi.org/10.7554/eLife.43094.019
-
Supplementary file 4
Logistic regression models with claim replication R [Replicated = 1, Non-replicated = 0] as response variable and predictors modelled simultaneously.
- https://doi.org/10.7554/eLife.43094.020
Download links
A two-part list of links to download the article, or parts of the article, in various formats.
Downloads (link to download the article as PDF)
Open citations (links to open the citations from this article in various online reference manager services)
Cite this article (links to download the citations from this article in formats compatible with various reference manager tools)
Meta-Research: Centralized scientific communities are less likely to generate replicable results
eLife 8:e43094.
https://doi.org/10.7554/eLife.43094


