Comment on 'Valid molecular dynamics simulations of human hemoglobin require a surprisingly large box size'
- Max-Planck Institute for Biophysical Chemistry, Germany
Figures
Figure 1 with 1 supplement
Hemoglobin simulation analysis.
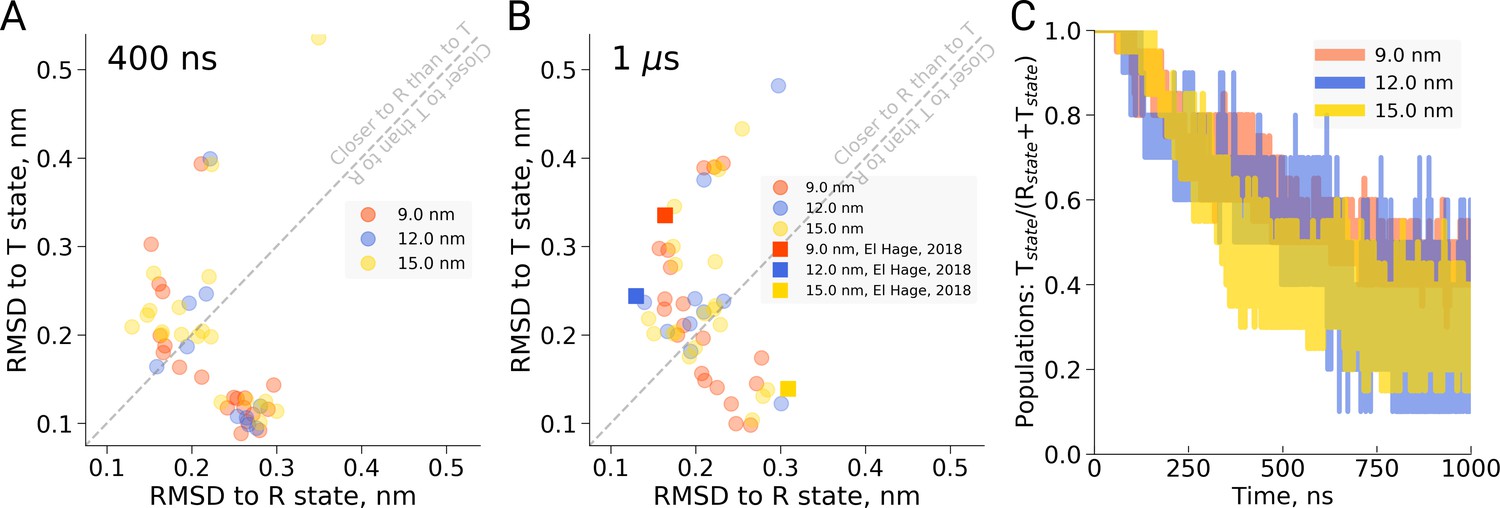
(A) RMSD of the simulation snapshots after 400 ns to the crystallographic T (2dn2) and R (2dn3) states. (B) RMSD of the simulation snapshots after 1 µs. Note that the simulations reported by El Hage et al. (2018) (squares) scatter indistinguishably from the other replicas. (C) Fraction of trajectories remaining in T for simulations in the boxes of different size. Simulations were counted to have left the T state if more than half of the distance from the T state had been covered, as projected onto the difference vector between the T and R crystallographic states. Each simulation reached 1 µs and comprised the following replicas: 20 for 9 nm and 15 nm boxes, 10 for 12 nm box.
-
Figure 1—source data 1
Source files for RMSD and transition analysis.
The zip archive contains a README file describing which source files correspond to the different panels.
- https://doi.org/10.7554/eLife.44718.005
Figure 1—figure supplement 1
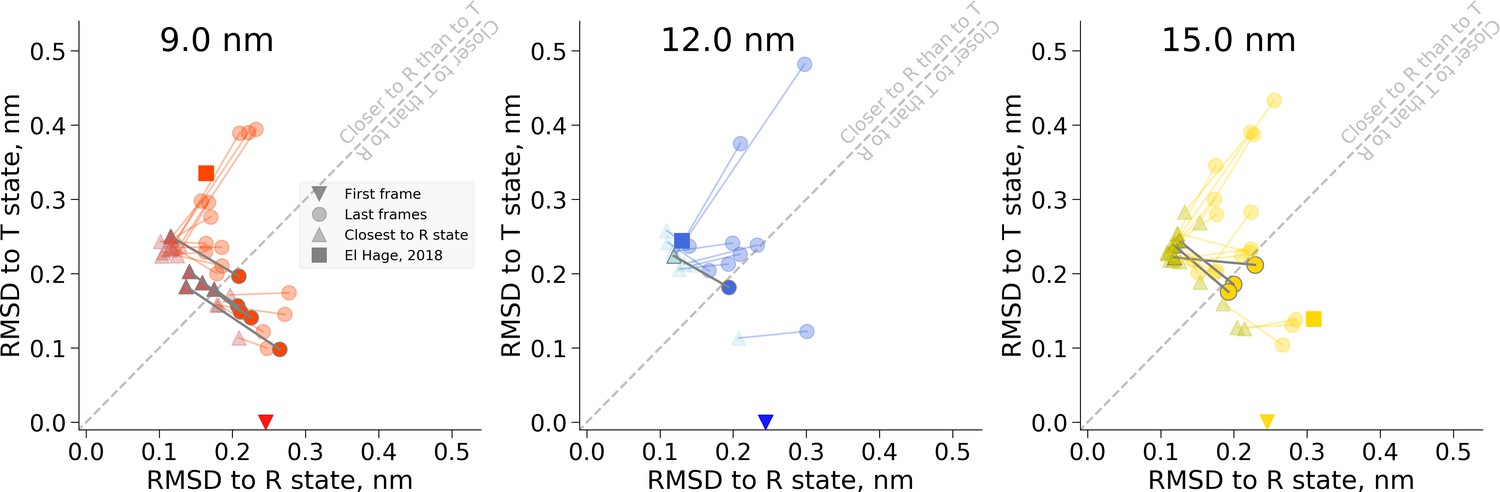
RMSD values for the snapshots of hemoglobin simulations in 9 nm (left), 12 nm (middle) and 15 nm (right) boxes.
The simulations start from the T state and are marked by a down-pointing triangle symbol. The last frames of the trajectories are depicted as circles. The frames in every trajectory that approach the R state the closest are shown as up-pointing triangles. Connecting the frames that belong to the same trajectory (lines between triangles and circles) allows tracking the possible back transitions where hemoglobin approaches the R state and afterwards returns closer to the T state. These back transitions cross the diagonal line and are highlighted in darker gray.
-
Figure 1—figure supplement 1—source data 1
This figure is made from the same data as Figure 1.
- https://doi.org/10.7554/eLife.44718.004
Figure 2 with 1 supplement
Radial distribution function (RDF), water diffusion and hydrogen bonds in hemoglobin simulations.
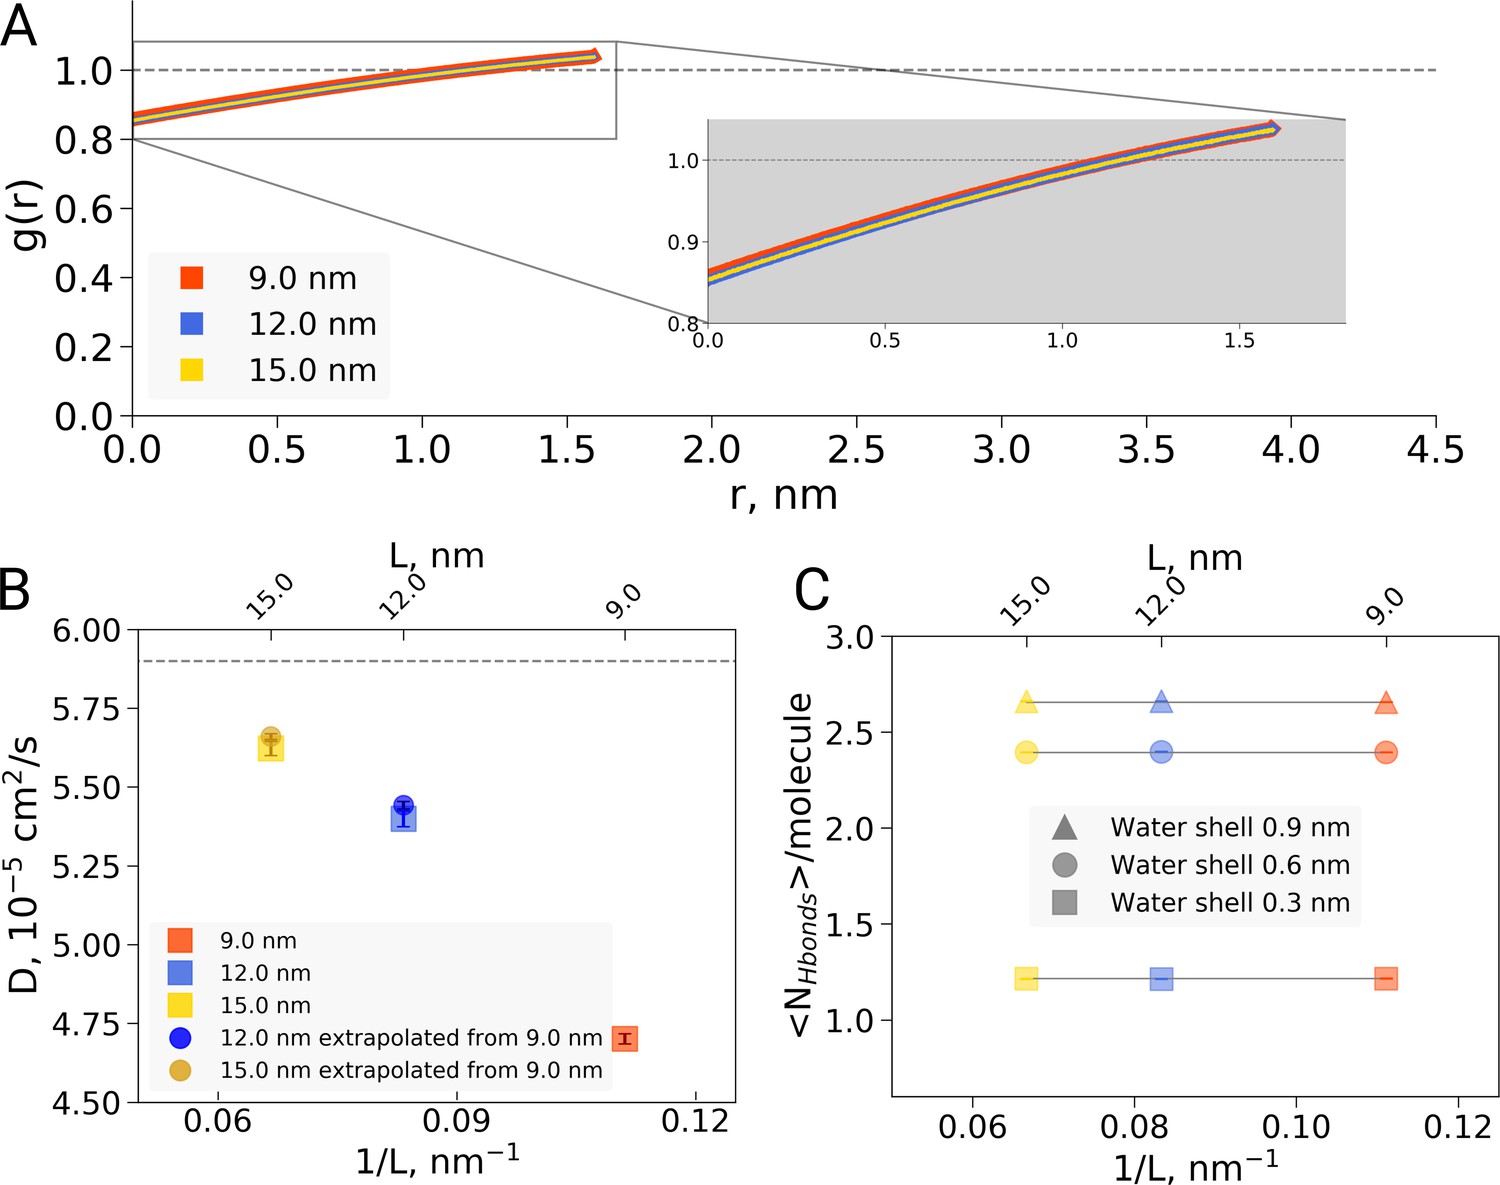
(A) RDF for water oxygen atoms was calculated for the simulations in the boxes of different sizes. An equivalent volume for estimating the RDFs was used for every box size by cutting out a cubic box with an edge of 9 nm around the protein. (B) The water diffusion coefficient is plotted as a function of the box edge length. The square symbols mark the results obtained directly from simulations. The circles denote diffusion coefficients calculated from the value obtained from the 9 nm box simulations by means of extrapolation by adding a corresponding number of bulk water molecules (see main text). (C) Average number of water-water hydrogen bonds (cutoff value for the donor-acceptor distance of 0.33 nm) for three solvation shells around the protein: 0.3, 0.6 and 0.9 nm.
-
Figure 2—source data 1
Source files for RDF, diffusion and hydrogen bond analysis.
The zip archive contains a README file describing which source files correspond to the different panels.
- https://doi.org/10.7554/eLife.44718.009
Figure 2—figure supplement 1
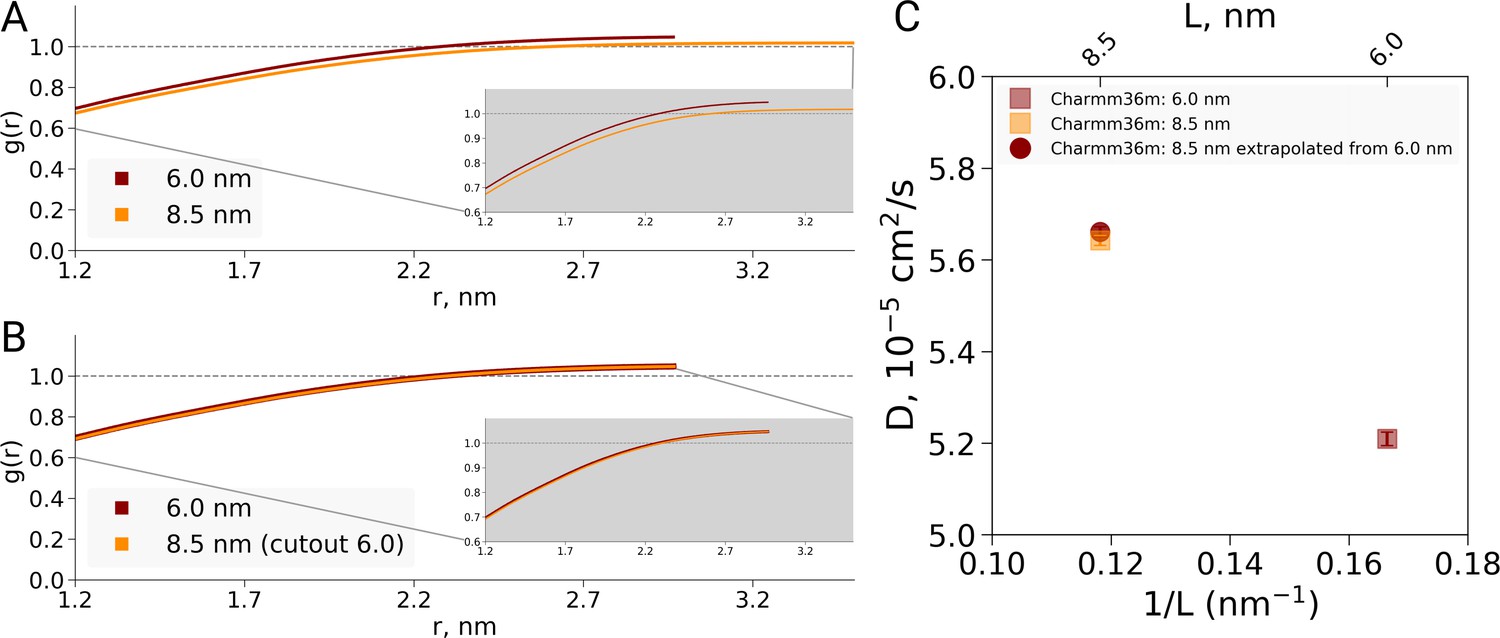
Radial distribution function (RDF) and water diffusion for ubiquitin simulations with the Charmm36m force field.
(A) RDFs calculated using the approach by El Hage et al., that is the normalization over different box volumes. When changes in the protein-to-water ratio between 6.0 and 8.5 nm boxes are not taken into account, the RDF curves differ, similarly as observed by El Hage et al for hemoglobin. (B) RDFs normalized using equivalent volume. In this case protein-to-water ratio remains constant and the RDFs are equivalent. (C) The water diffusion coefficients depicted in squares were calculated directly from simulations. The diffusion coefficient shown as circle was extrapolated from the value calculated for the smaller 6.0 nm box and the bulk water diffusion constant. The correspondence between the directly determined and extrapolated results demonstrates that the dilution effect due to a modified protein-to-water ratio is sufficient to explain the data, as in the hemoglobin case.
-
Figure 2—figure supplement 1—source data 1
Source files for RDF, and diffusion analysis of ubiquitin.
The zip archive contains a README file describing which source files correspond to the different panels.
- https://doi.org/10.7554/eLife.44718.008
Figure 3
Kinetic analysis of hemoglobin, ubiquitin and alanine dipeptide.
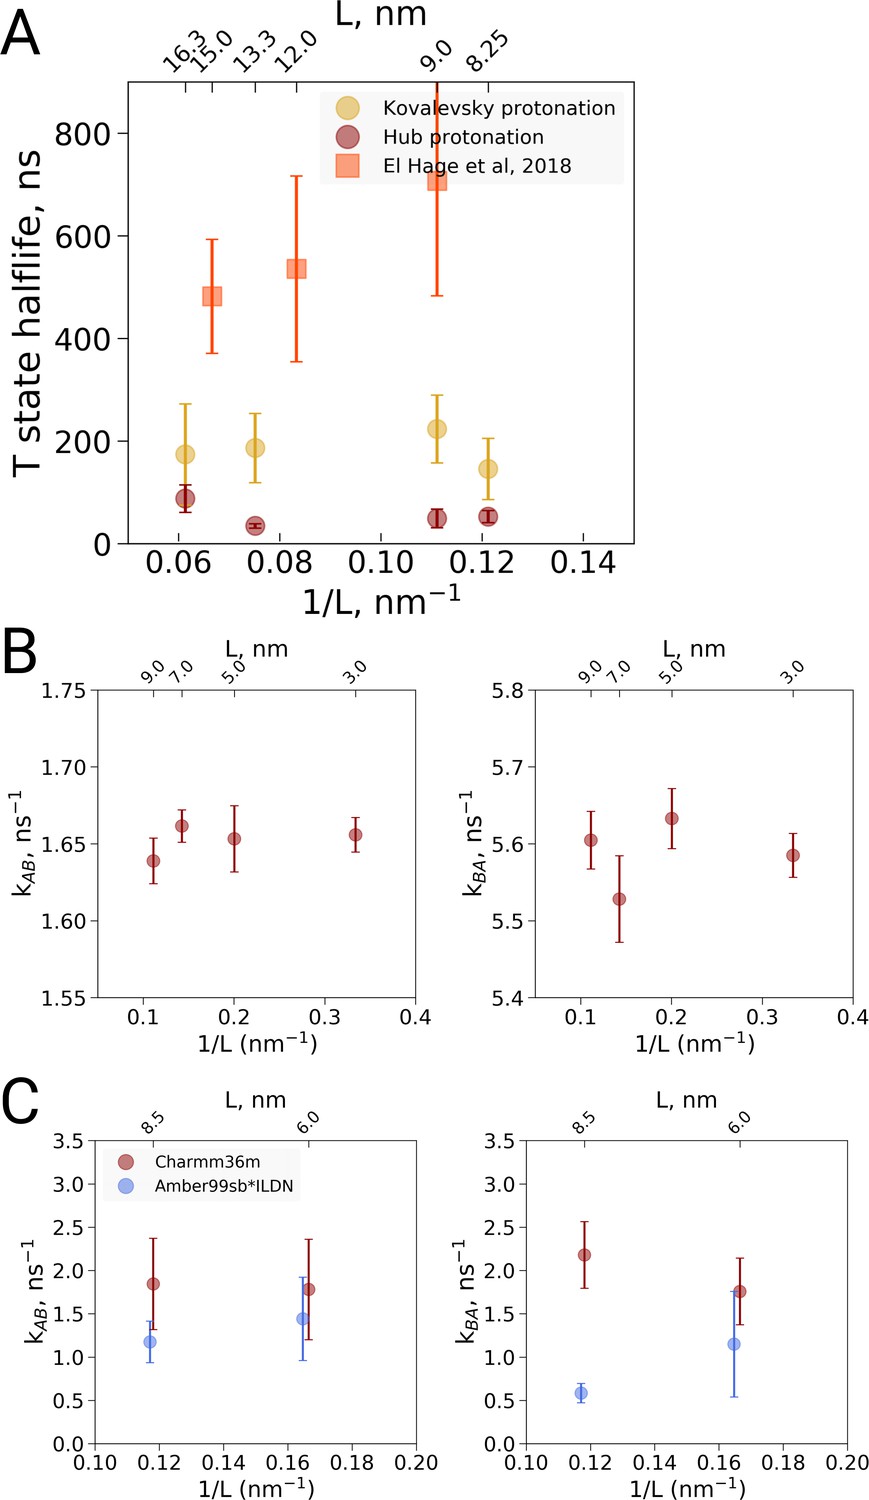
(A) Hemoglobin: average transition time from T to R, expressed as the time in which half of the replicas displayed the T to R transition, as a function of the simulation box size. Three different system setups were used for simulations. The Kovalevsky and Hub setups differ in the protonation of hemoglobin (Vesper and de Groot, 2013), both model the iron-proximal histidine interaction as a covalent bond. The El Hage setup is obtained from El Hage et al and thus identical to the one used in El Hage et al. (2018), where the iron-histidine were not covalently bound. Note that the difference in size of the error bars is explained by the difference in transition times: larger transition times are accompanied by larger absolute uncertainties. (B) Transition rates between the two minima in ubiquitin: rates from A to B (left) and from B to A (right). The reaction coordinate with the minima is depicted in Figure 4E,F. (C) Transition rates between the two minima in alanine dipeptide: rates from A to B (left) and from B to A (right). The reaction coordinate with the minima is depicted in Figure 4B,C.
-
Figure 3—source data 1
Source files for kinetics analysis.
The zip archive contains a README file describing which source files correspond to the different panels.
- https://doi.org/10.7554/eLife.44718.011
Figure 4
Thermodynamic analysis of hemoglobin, ubiquitin and RGGGD peptide.
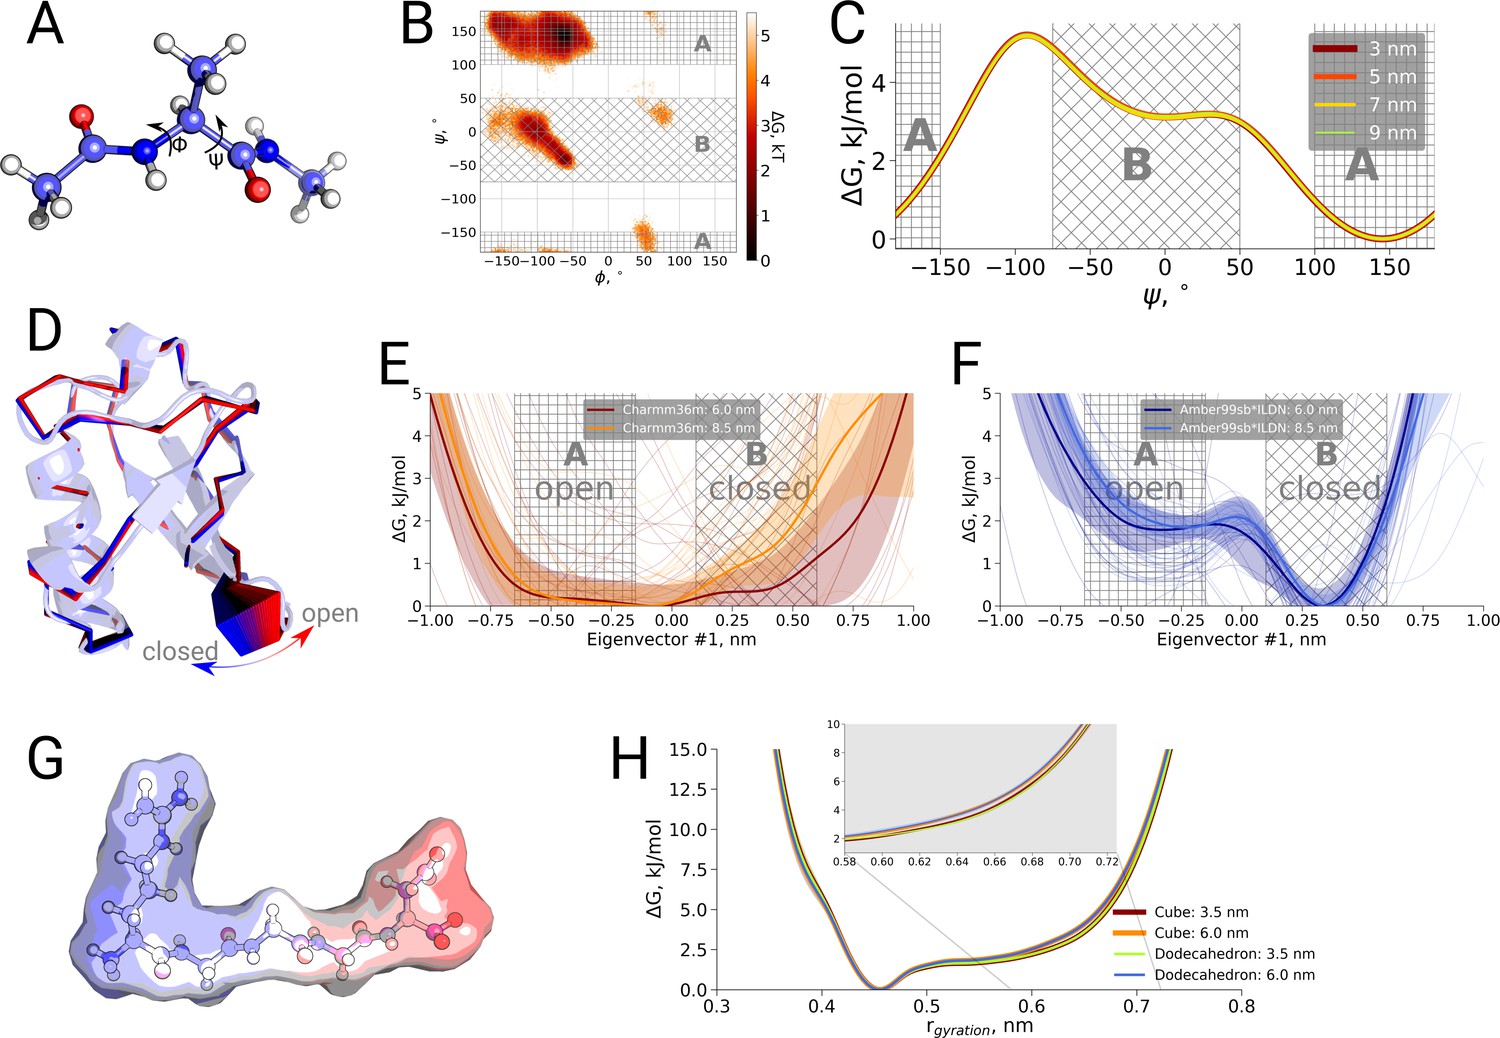
(A) Structure of the alanine dipeptide. (B) Free energy surface for alanine dipeptide simulated in the smallest box projected onto the backbone dihedrals marked in the panel (A). (C) Free energy profile along the dihedral angle. (D) Structure of ubiquitin and an interpolation of the motion along the principal component with the largest variance (pincer mode). (E) Free energy profile projected on the pincer mode for ensembles generated with the Charmm36m force field. (F) Free energy profile for the Amber99sb*ILDN force field. (G) Structure of the RGGGD pentapeptide with the surface color corresponding to the surface charge: blue - positive, red - negative. (H) Free energy profiles for the pentapeptide projections as a function of the radius of gyration.
-
Figure 4—source data 1
Source files for thermodynamics analysis.
The zip archive contains a README file describing which source files correspond to the different panels.
- https://doi.org/10.7554/eLife.44718.013
Download links
A two-part list of links to download the article, or parts of the article, in various formats.
Downloads (link to download the article as PDF)
Open citations (links to open the citations from this article in various online reference manager services)
Cite this article (links to download the citations from this article in formats compatible with various reference manager tools)
Comment on 'Valid molecular dynamics simulations of human hemoglobin require a surprisingly large box size'
eLife 8:e44718.
https://doi.org/10.7554/eLife.44718


