Comment on 'Naked mole-rat mortality rates defy Gompertzian laws by not increasing with age'
- University of Duisburg-Essen, Germany
- University Hospital, University of Duisburg-Essen, Germany
- Jena University Hospital, Germany
- Moscow Society of Naturalists, Russia
- Leibniz Institute on Aging – Fritz Lipmann Institute, Germany
- Leibniz Institute for Zoo and Wildlife Research, Germany
- Czech University of Life Sciences, Czech Republic
- Ulm University, Germany
Figures
Figure 1
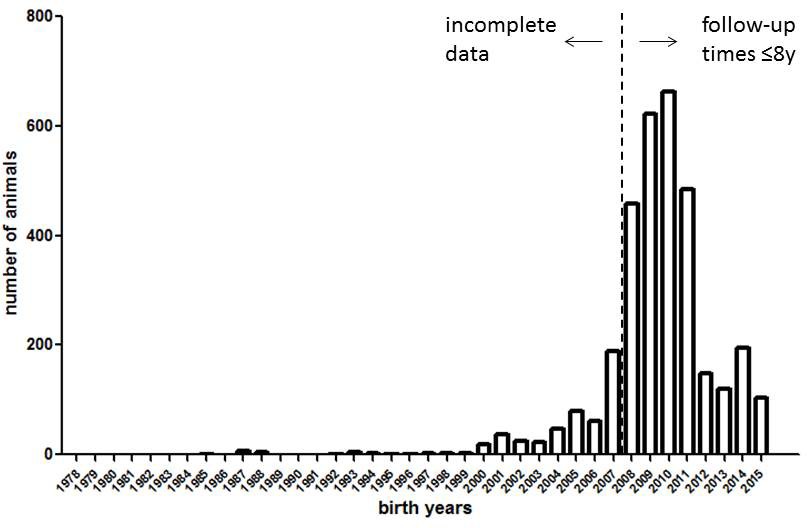
Histogram of birth years in the naked mole-rat dataset (3299 data points) underlying Figure 1 of Ruby et al. (2018).
https://doi.org/10.7554/eLife.45415.002
Figure 2
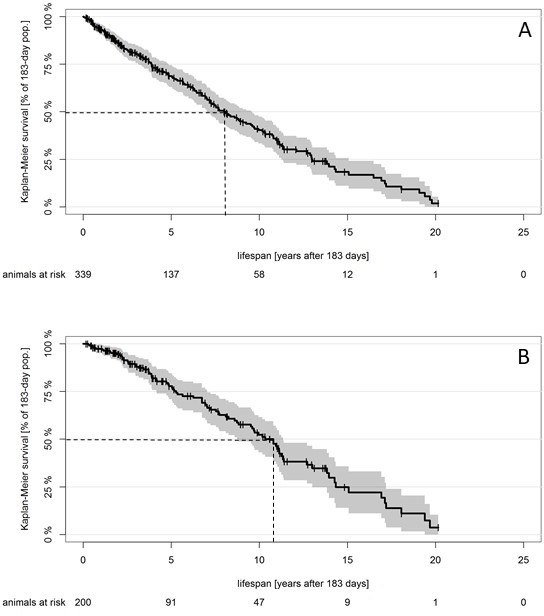
Survival curve for small Zambian mole-rats.
Kaplan–Meier survival curve for small Zambian mole-rats (Fukomys anselli and Fukomys anselli x kafuensis) that reach the same age as that used as a starting point in Ruby et al. (2018); 95% confidence intervals for the Kaplan–Maier curve and animals at risk are included, as suggested by Pocock et al. (2002). Dotted lines represent median survival after onset of the study at 0.5 years. (A) Original data from 339 animals; median survival after 0.5 years, 7.99 years (95% CI, 7.04–9.60 years). (B) Biased data presentation: animals that died before 2010 have been (artificially) deleted from the dataset. Median survival after 0.5 years, 10.80 years (95% CI, 8.82–11.39 years).
-
Figure 2—source code 1
This script reads the data from Figure 2—source data 1 to create the reported Kaplan–Meier estimators (Figure 2A,B).
- https://doi.org/10.7554/eLife.45415.004
-
Figure 2—source data 1
This xlxs-file contains the lifespan data for small Zambian Fukomys-mole rats that underlie Figure 2A,B.
Each row in the file contains data for one individual animal. Columns inform about individual animal IDs, birth date/year, sex, death date, the date on which data for that animal was compiled ('DataDate'), censorship, lifespan (in days) and additional notes whenever specific circumstances for that specific animal had to be reported. 'DeathDate' is empty if the animal was still alive at the time of data compilation ('DataDate'). In such cases, 'DataDate' was used as the date-of-censorship.
- https://doi.org/10.7554/eLife.45415.005
Download links
A two-part list of links to download the article, or parts of the article, in various formats.
Downloads (link to download the article as PDF)
Open citations (links to open the citations from this article in various online reference manager services)
Cite this article (links to download the citations from this article in formats compatible with various reference manager tools)
Comment on 'Naked mole-rat mortality rates defy Gompertzian laws by not increasing with age'
eLife 8:e45415.
https://doi.org/10.7554/eLife.45415


