Biophysical and physiological processes causing oxygen loss from coral reefs
- San Diego State University, United States
- University of Hawaii at Mānoa, United States
- Rio de Janeiro Federal University, Brazil
- University of Alicante, Spain
- CARMABI Foundation, Curaçao
- University of Amsterdam, Netherlands
- Monterey Bay Aquarium Research Institute, United States
- Utrecht University, Netherlands
Figures
Figure 1 with 3 supplements
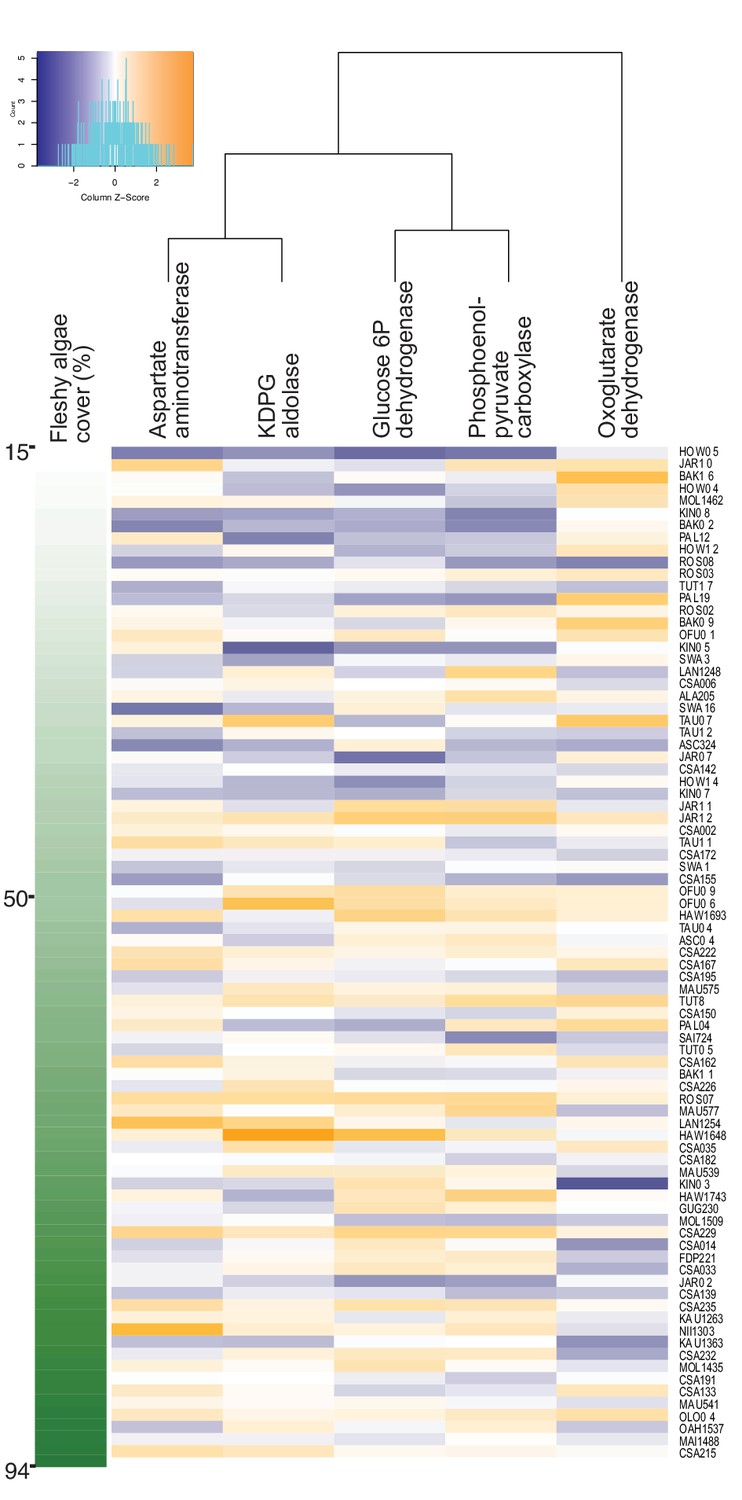
Increase in genes encoding anabolic pathways and decrease in genes encoding carbon oxidation reactions with increasing fleshy algae cover in situ.
Relative abundances of genes encoding rate-limiting enzymes in reef metagenomes are plotted in relation to fleshy algae cover (sum of fleshy turf and macroalgae). Individual metagenomes are listed as rows and sorted by the fleshy algae cover, ranging from 15% to 94.1%. Enzyme gene abundance was scaled by column to allow between-enzyme comparisons as indicated by the z-score, where blue indicates low relative abundance and orange indicates high relative abundance. Only enzyme genes significantly predicting fleshy algae cover in the random forest analysis are shown. A complete list of enzymes and abundances is provided as Figure 1—source data 1.
-
Figure 1—source data 1
Geographic location, microbial biomass, benthic cover and metagenomic data of 87 reef sites in the Pacific and Caribbean.
- https://cdn.elifesciences.org/articles/49114/elife-49114-fig1-data1-v1.csv
Figure 1—figure supplement 1

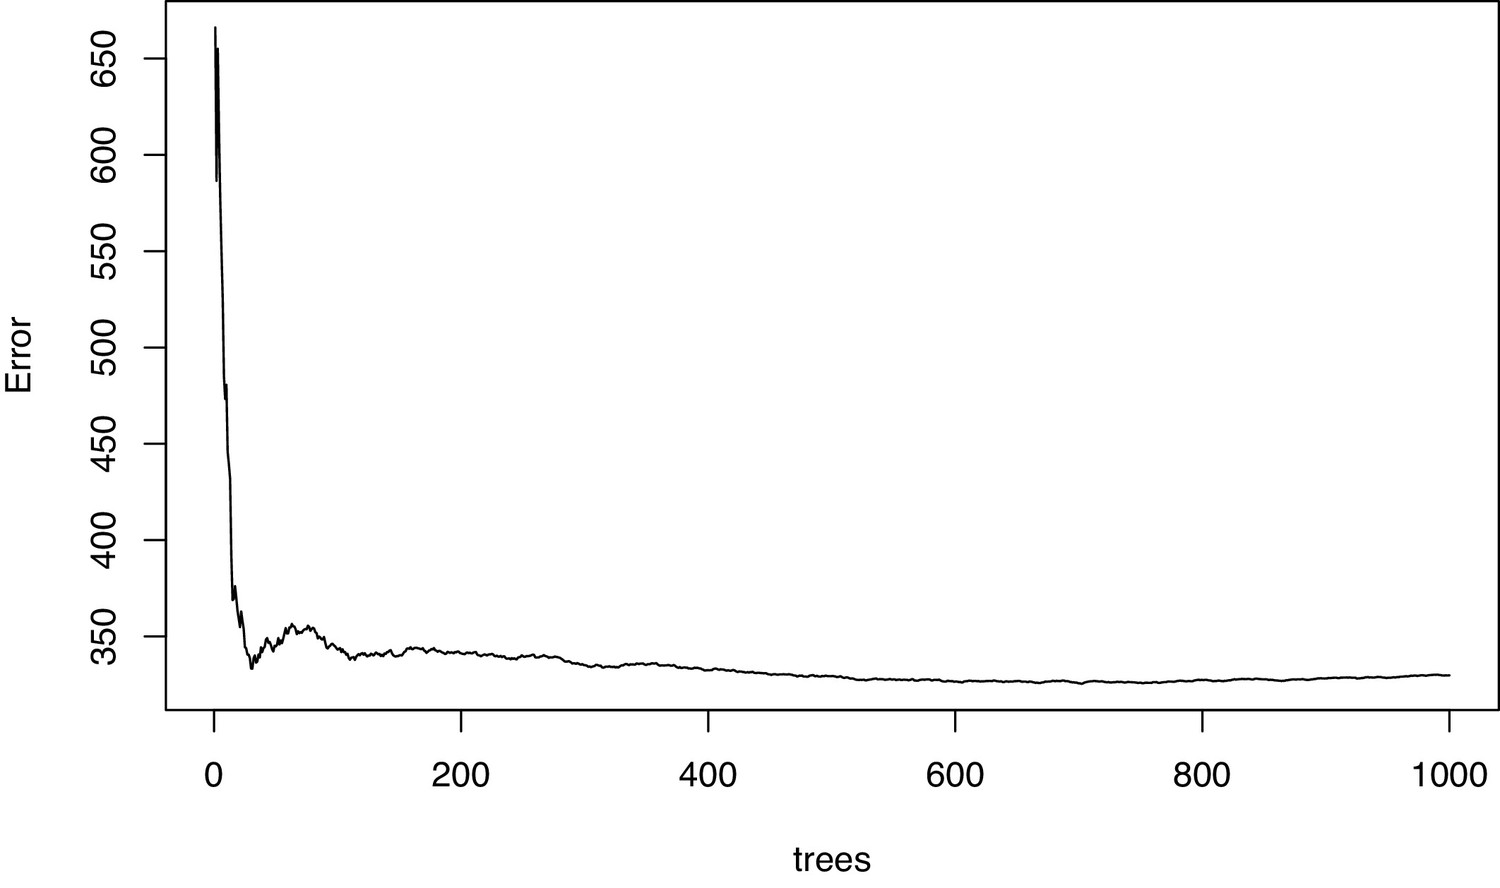
Diagnostic plot of the mean squared error in the permutational regression random forest analysis of enzyme gene relative abundances using percent fleshy algae cover as response variable.
The error settled down indicating that enough trees were grown.
Figure 1—figure supplement 2

Most abundant species in the microbial metagenomes.
Relative abundances were calculated by mapping the metagenomic reads to a Bacterial RefSeq database at 97% identity and normalizing the number of hits by genome size using the FRAP method (Fragment Recruitment, Assembly, Purification; Cobián Güemes et al., 2016).
Figure 1—figure supplement 3
Diagnostic plot of the mean squared error in the permutational regression random forest analysis of bacterial species using percent fleshy algae cover as response variable.
The error settled down indicating that enough trees were grown.
Figure 2
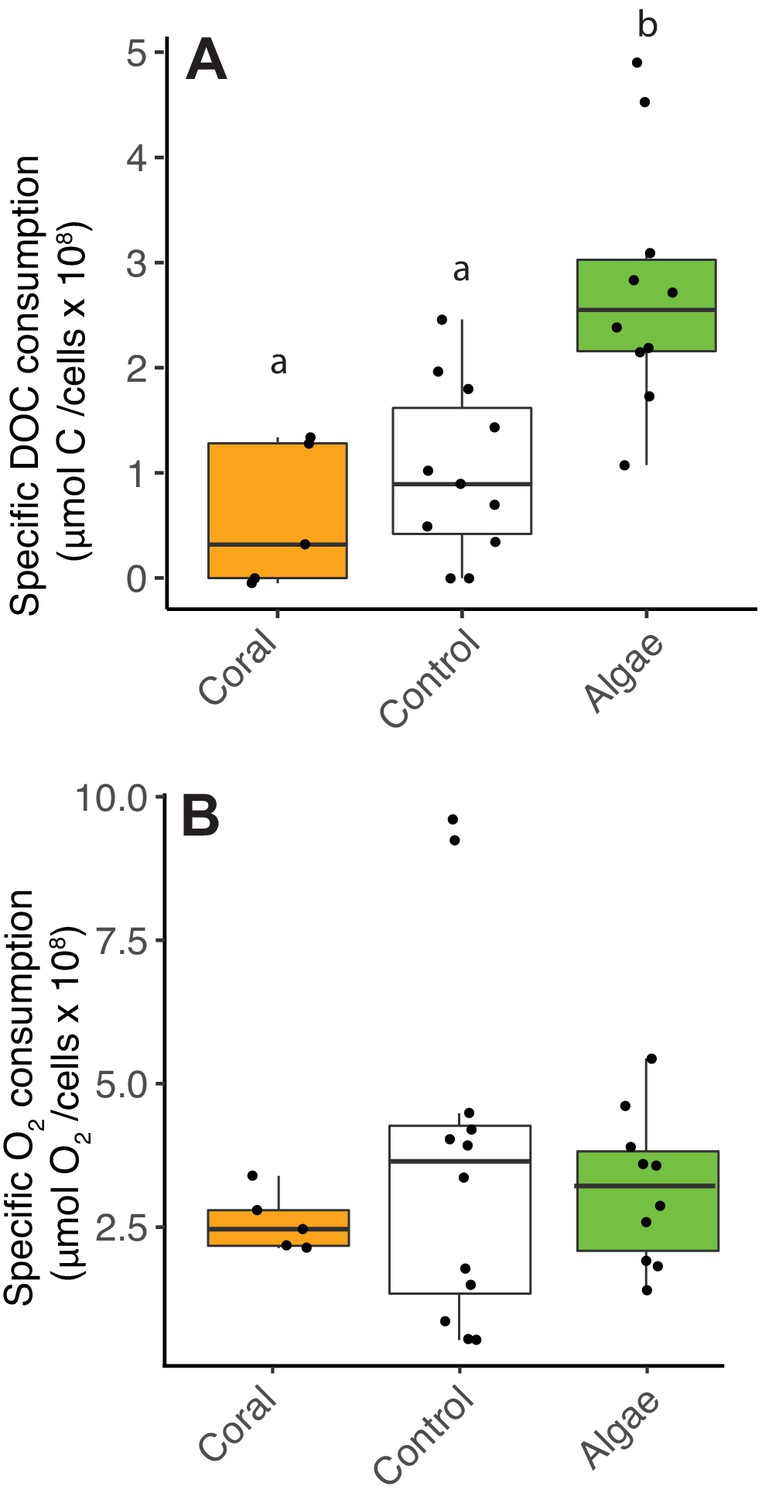
Decoupling between microbial DOC and O2 consumption in fleshy macroalgae exudates.
Cell-specific carbon and O2 consumption data from Experiment 4: dark incubations of microbial communities in primary producer exudates. (A) Cell-specific DOC consumption. (B) Cell-specific O2 consumption. Primary producer treatments had a significant effect on specific DOC consumption only (Kruskal-Wallis p<0.05) and letters above boxes indicate p<0.05 for Wilcoxon pairwise tests with FDR correction. Orange indicates calcifying and green indicates fleshy organisms. Boxes depict the median and the first and third quartiles. Whiskers extend to 1.5 times the size of the interquartile ranges. Outliers are represented as dots above or below whiskers.
-
Figure 2—source data 1
Changes in DOC, O2 and cell abundances in experimental bottles.
- https://cdn.elifesciences.org/articles/49114/elife-49114-fig2-data1-v1.csv
Figure 3 with 1 supplement
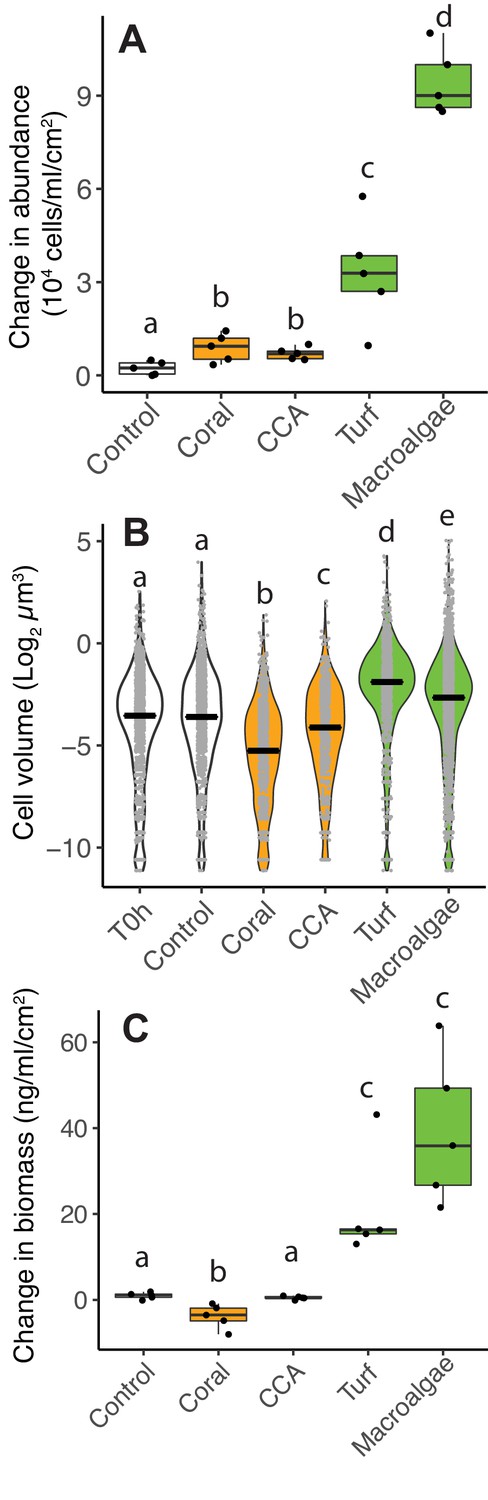
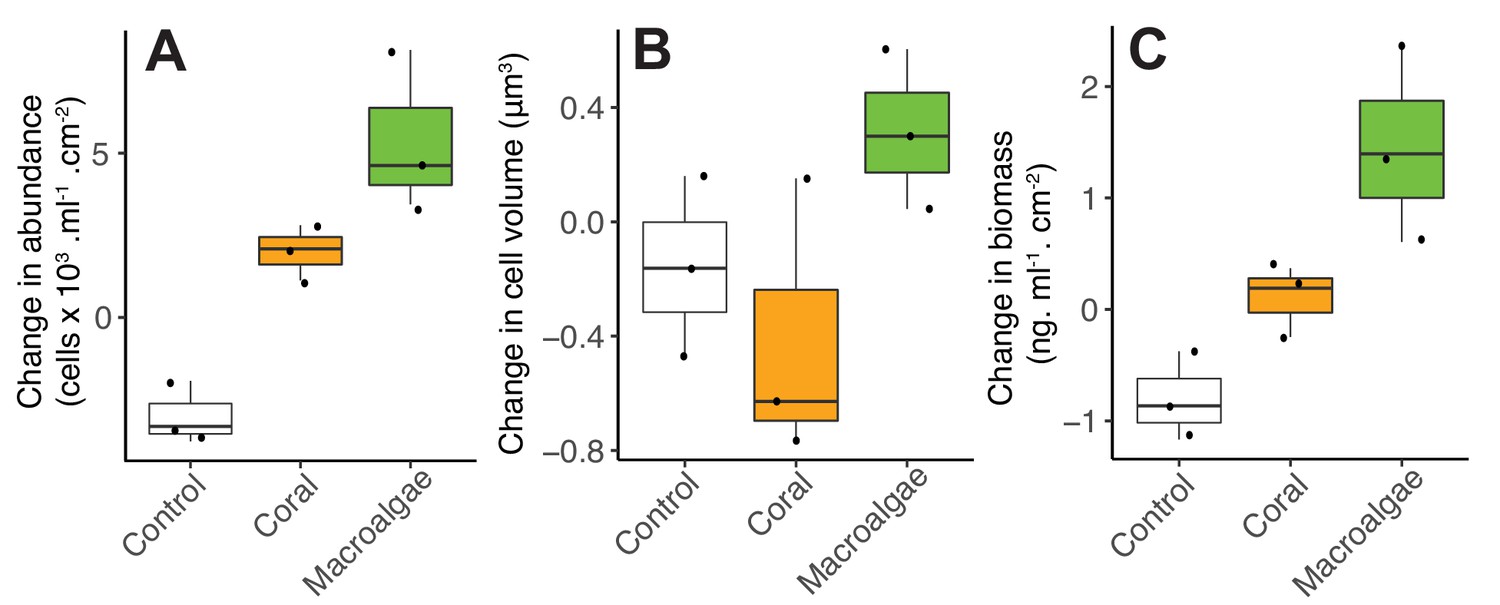
Differences in microbial biomass accumulation in primary producer exudates.
(A) Changes in microbial abundance normalized by primary producer surface area. (B) Cell volume distributions. (C) Changes in total microbial biomass, accounting for abundance and cell volume, normalized by primary producer surface area. Primary producer treatments had a significant effect on all three microbial variables (Kruskal-Wallis p<0.05), and letters above boxes indicate p<0.05 for Wilcoxon pairwise tests with FDR correction. Orange indicates calcifying and green indicates fleshy organisms. Boxes depict the median and the first and third quartiles. Whiskers extend to 1.5 times the size of the interquartile ranges. Outliers are represented as dots above or below whiskers.
-
Figure 3—source data 1
Cell abundances and biomass in experimental bottles.
- https://cdn.elifesciences.org/articles/49114/elife-49114-fig3-data1-v1.csv
-
Figure 3—source data 2
Microbial cell volumes in experimental bottles.
- https://cdn.elifesciences.org/articles/49114/elife-49114-fig3-data2-v1.csv
Figure 3—figure supplement 1
Changes in microbial abundance (A), cell volume (B) and total biomass (C) stimulated by coral and algal exudates.
This experiment was performed at the Hawaiian Institute of Marine Biology with the coral species Favia sp. and the algae species Gracilaria sp.
Figure 4
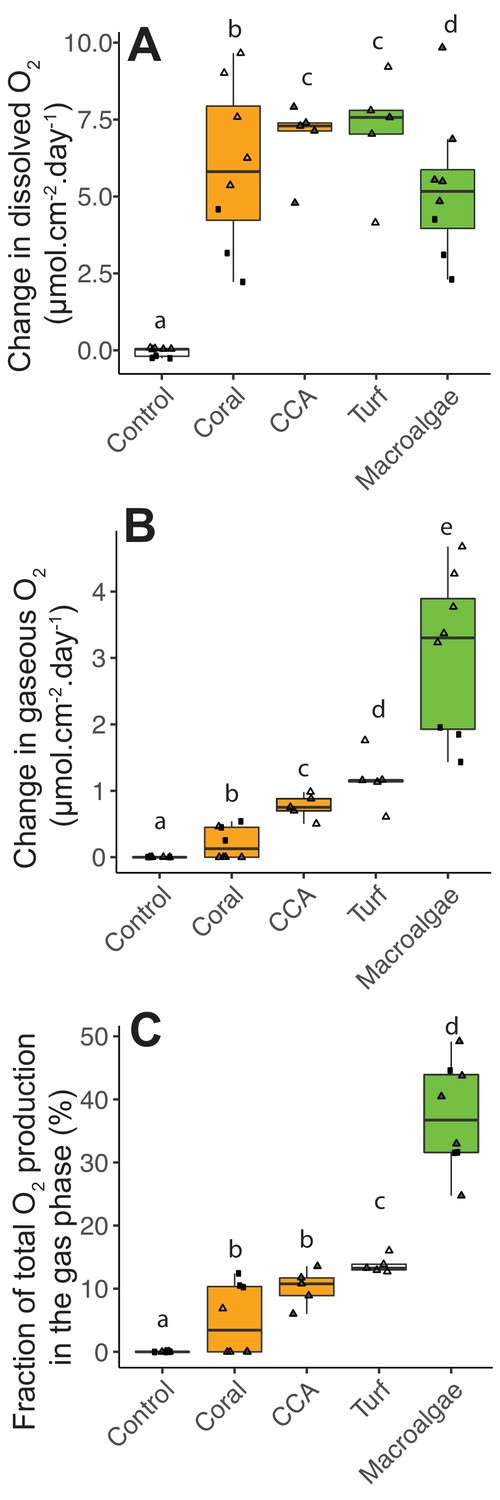
Photosynthetic O2 loss as gas from fleshy macroalgae.
(A) Dissolved O2 production rates normalized by organism surface area. (B) Gaseous O2 production rates normalized by organism surface area. (C) Fraction of total photosynthetic O2 production in the form of gas. Solid squares correspond to Experiment 1 and triangles to Experiment 2. In A, the gray-filled triangles indicate replicates where dissolved oxygen was above the accuracy range of the probe used, and lower bound values (within probe accuracy range) were utilized. In C, the gray-filled triangles indicate the estimated values associated with lower bound values from A. Primary producer had a significant effect on all three variables (Kruskal-Wallis p<0.05), and letters above boxes indicate p<0.05 for Wilcoxon pairwise tests with FDR correction. Orange indicates calcifying and green indicates fleshy organisms. Boxes depict the median and the first and third quartiles. Whiskers extend to 1.5 times the size of the interquartile ranges. Outliers are represented as dots above or below whiskers.
-
Figure 4—source data 1
O2 concentrations in dissolved and gas phases in POP incubation bottles.
- https://cdn.elifesciences.org/articles/49114/elife-49114-fig4-data1-v1.csv
Figure 5 with 1 supplement
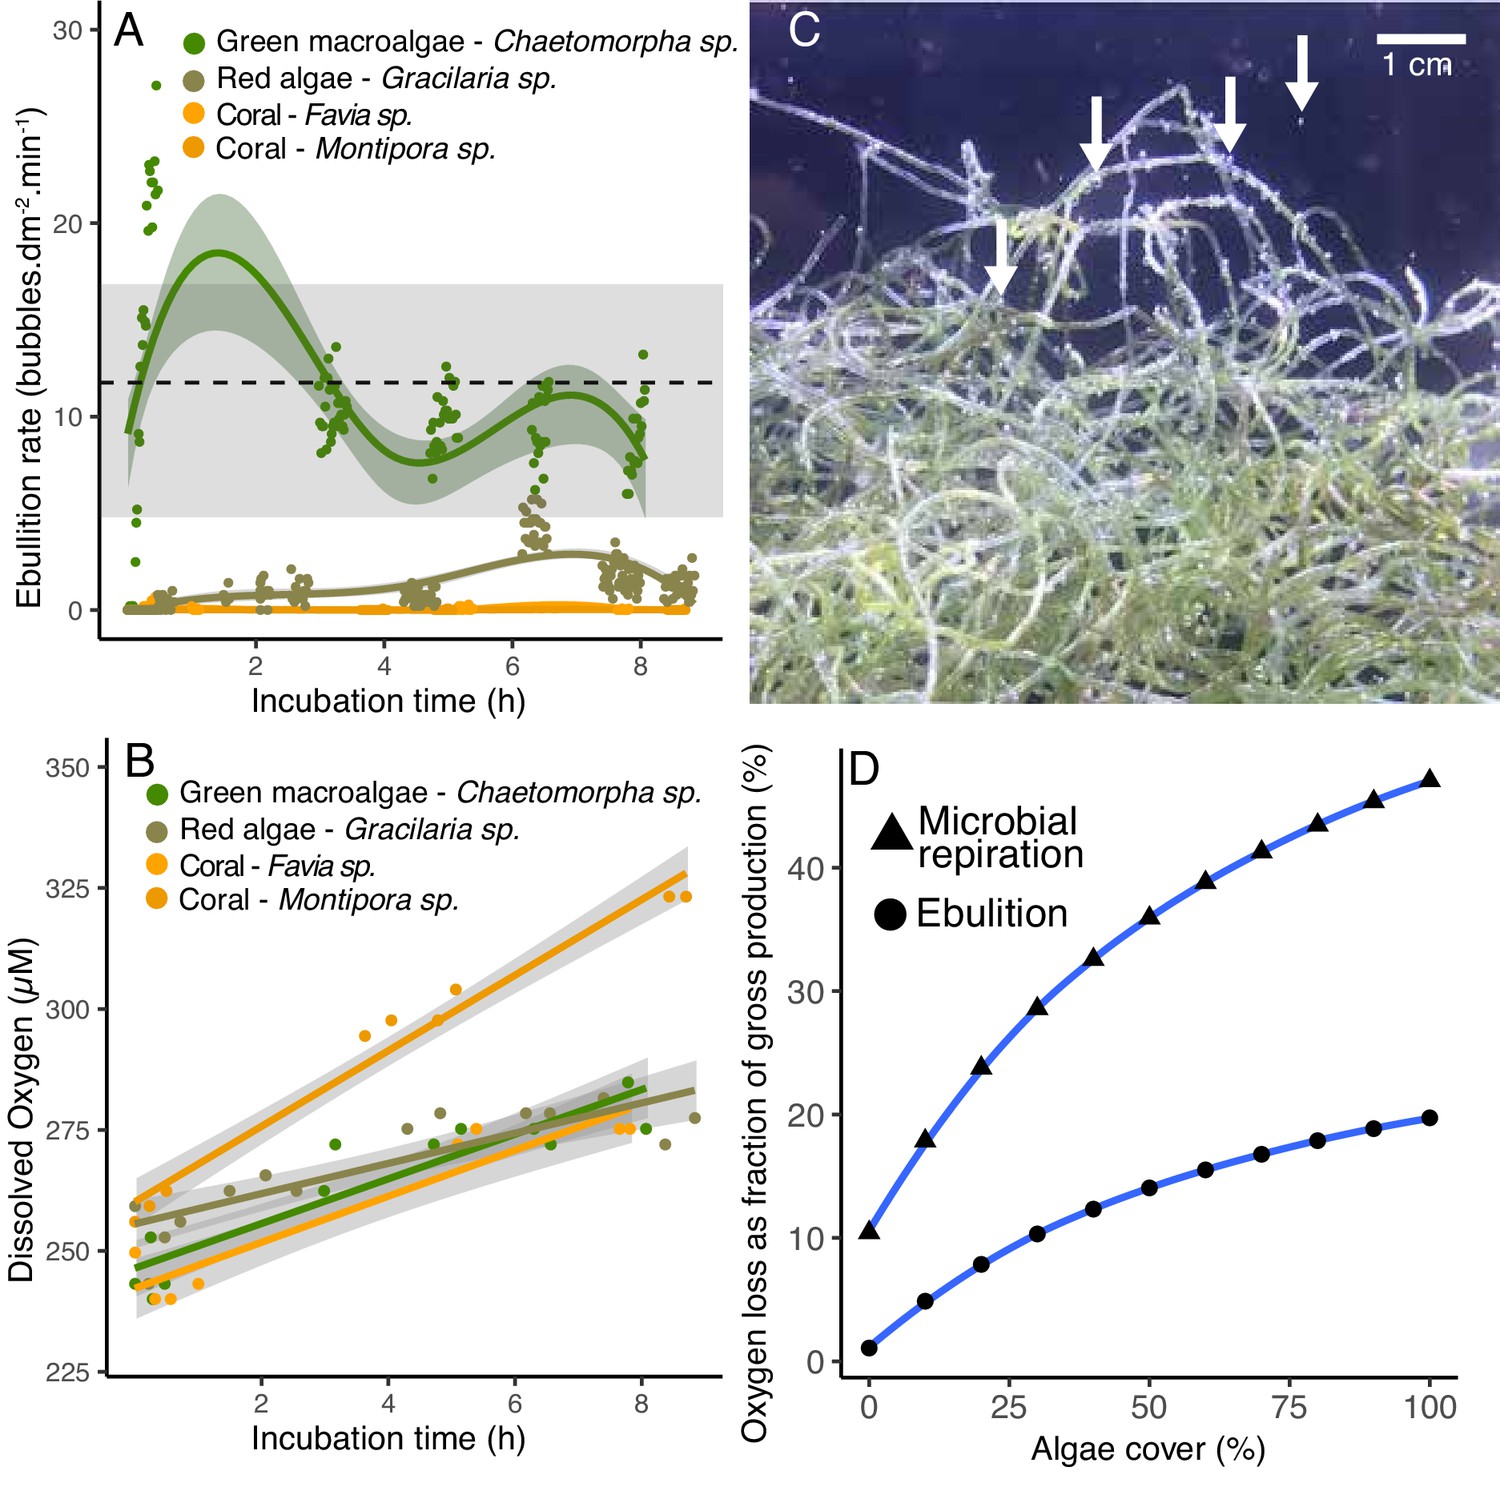
Ebullition by fleshy algae.
(A) Rate of bubble production normalized by organism surface area in open-tank experiments. The green symbols indicate fleshy algae and the orange ones indicate scleractinian corals. The dotted line indicates the mean and the gray bar indicates the range of ebullition rates estimated to explain the amount of gaseous oxygen observed in POP experiment 2 (Figure 4). (B) Dissolved oxygen concentrations over time in the same open-tank experiments depicted in 5A. (C) Representative image of bubbles formed on the surface of the green algae Chaetomorpha sp. incubated in an open tank at 300 PAR. (D) Predicted loss of oxygen through microbial respiration and ebullition as a percentage of the gross benthic oxygen production in a model reef with varying algae and coral cover (x axis). Oxygen loss was estimated by a weighted linear model incorporating per-cell respiration rates shown in Figure 2, microbial abundances sustained by primary producers shown in Figure 3, and ebullition rates shown in Figure 5A.
-
Figure 5—source data 1
Ebullition rates and dissolved O2 in open tank experiments.
- https://cdn.elifesciences.org/articles/49114/elife-49114-fig5-data1-v1.csv
-
Figure 5—source data 2
Model predictions of ebullition and microbial respiration contributions to O2 loss.
- https://cdn.elifesciences.org/articles/49114/elife-49114-fig5-data2-v1.csv
Figure 5—figure supplement 1
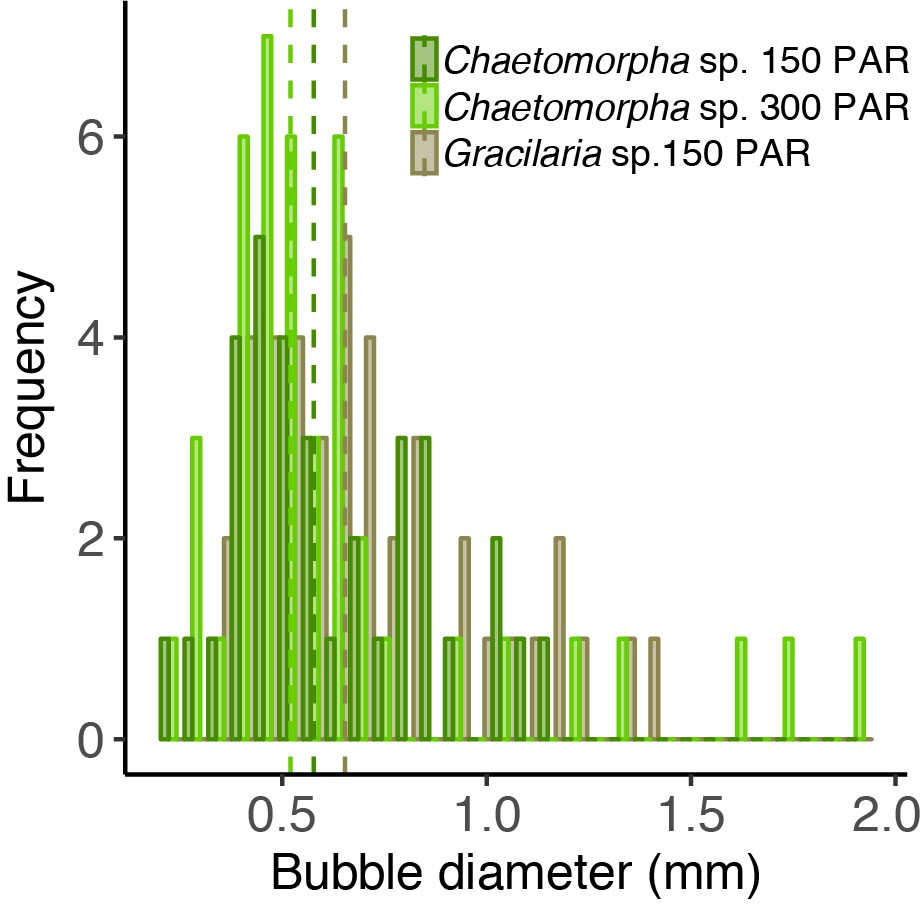
Bubble size distribution in open-tank experiments.
The different colors indicate different experiments with the algae species Chaetomorpha sp. and Gracilaria sp. incubated at 150 and 300 PAR.
Figure 6
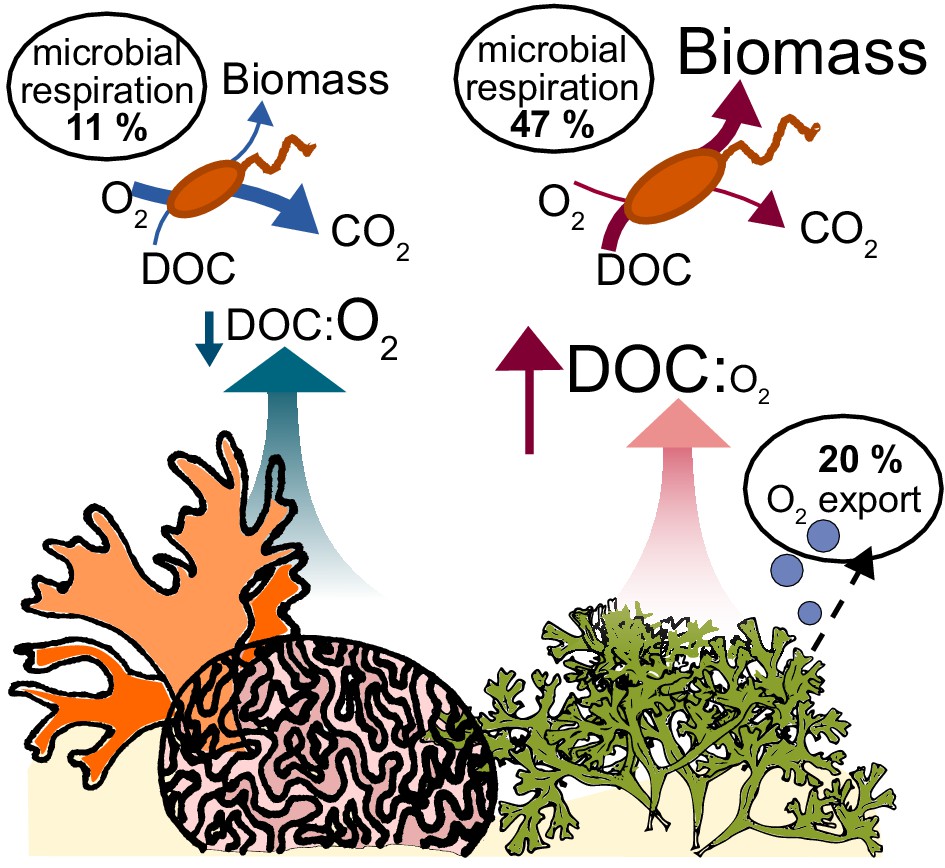
Conceptual model of oxygen loss mechanisms from coral reefs.
In healthy reefs dominated by calcifying organisms, benthic exudates have low DOC concentrations and low DOC:O2 ratios. The high ratio of electron acceptors (O2) to donors (DOC) stimulates oxidative metabolism in the heterotrophic bacterial community, which sustains low biomass accumulation. In algae-dominated reefs, the loss of oxygen by ebullition leaves behind exudates that are enriched in electron donors (DOC) relative to acceptors (O2). Combined with the higher DOC concentrations, this biogeochemical environment stimulates overflow metabolism in the heterotrophic bacterial community, with incomplete carbon oxidation and accumulation of biomass.
Videos
Video 1
Representative video of open-tank experiment with Chaetomorpha sp. at 150 umol quanta m−2 s−1.
This specific video fragment was recorded 20 min after the beginning of the experiment.
Video 2
Representative video of open-tank experiment with Chaetomorpha sp. at 300 µmol quanta m−2 s−1.
This specific video fragment was recorded 7 hr after the beginning of the experiment.
Additional files
-
Supplementary file 1
List of genes encoding rate-limiting enzymes participating in central carbon metabolism, reactive oxygen species detoxification and replication/translation analyzed in this study.
Gene abundances are provided in Figure 1—source data 1.
- https://cdn.elifesciences.org/articles/49114/elife-49114-supp1-v1.docx
-
Transparent reporting form
- https://cdn.elifesciences.org/articles/49114/elife-49114-transrepform-v1.docx
Download links
A two-part list of links to download the article, or parts of the article, in various formats.
Downloads (link to download the article as PDF)
Open citations (links to open the citations from this article in various online reference manager services)
Cite this article (links to download the citations from this article in formats compatible with various reference manager tools)
Biophysical and physiological processes causing oxygen loss from coral reefs
eLife 8:e49114.
https://doi.org/10.7554/eLife.49114


