Substantial near-infrared radiation-driven photosynthesis of chlorophyll f-containing cyanobacteria in a natural habitat
- University of Copenhagen, Denmark
- University of Technology Sydney, Australia
- University of Aarhus, Denmark
Figures
Figure 1 with 8 supplements
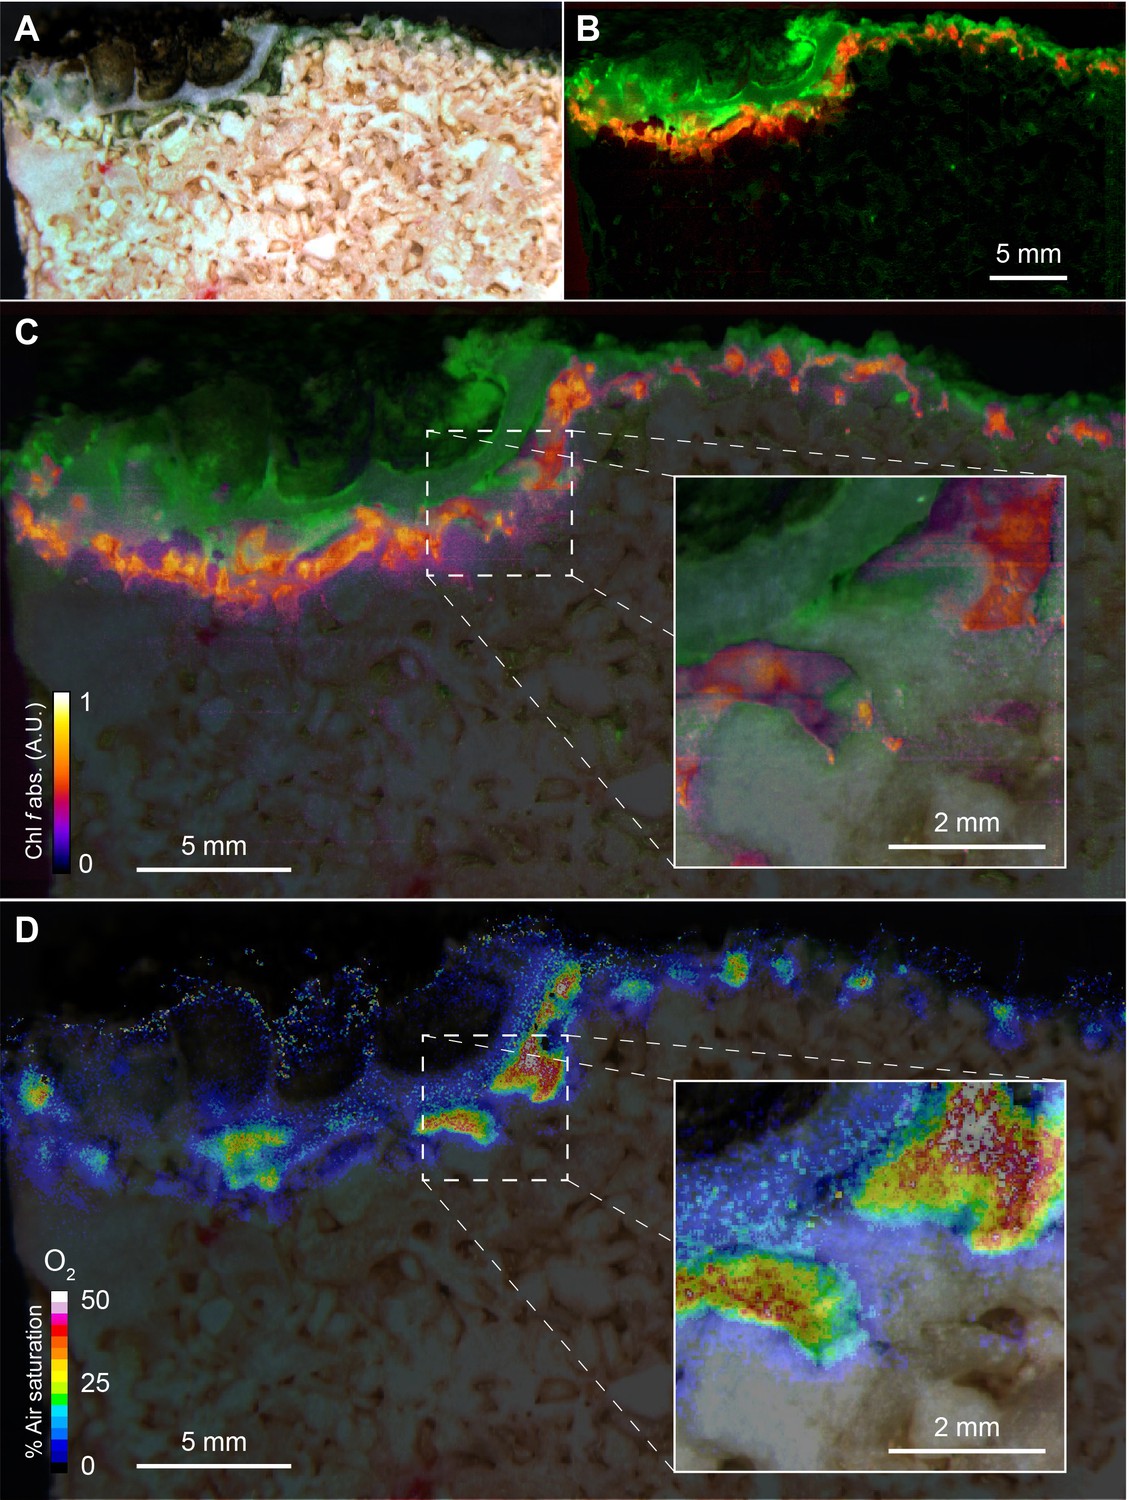
Spatial distribution of photopigments and near-infrared radiation-driven oxygenic photosynthesis in beachrock as mapped with hyperspectral reflectance imaging and chemical imaging of O2.
(A) RGB image composite, constructed from the hyperspectral image stack (R = 650 nm, G = 550 nm, B = 450 nm), showing ‘true’ colors of beachrock material and the biofilm community in a cross-section of the top layer. (B) False color coded image of the same hyperspectral image stack as in panel A mapping pixels with Chl a absorption (670–680 nm) in green, and Chl f absorption (718–722 nm) in red. Representative reflectance spectra of the two regions are given in Figure 1—figure supplement 1. (C) Overlay of beachrock structure obtained in panel A and the Chl a signature from panel B with map of the relative abundance of Chl f obtained from the amplitude of Chl f absorption (color coded between 0 and 1), as acquired from hyperspectral image analysis. (D) Distribution of O2 concentration (color coded in units of % air saturation) in the beachrock under illumination of 740 nm light (half-bandwidth = 25 nm; photon irradiance = 28 µmol photons m−2 s−1) when immersed in anoxic seawater, as imaged with the beachrock section covered with a thin paint of agarose containing O2–sensitive nanoparticles. The O2 concentration image was superimposed onto the structural image of the beachrock cross section. The insert is a digital zoom corresponding to the insert in panel C. Additional data on two other beachrock sections are available in the Suppl. Materials (Figure 1—figure supplements 2 and 6).
Figure 1—figure supplement 1
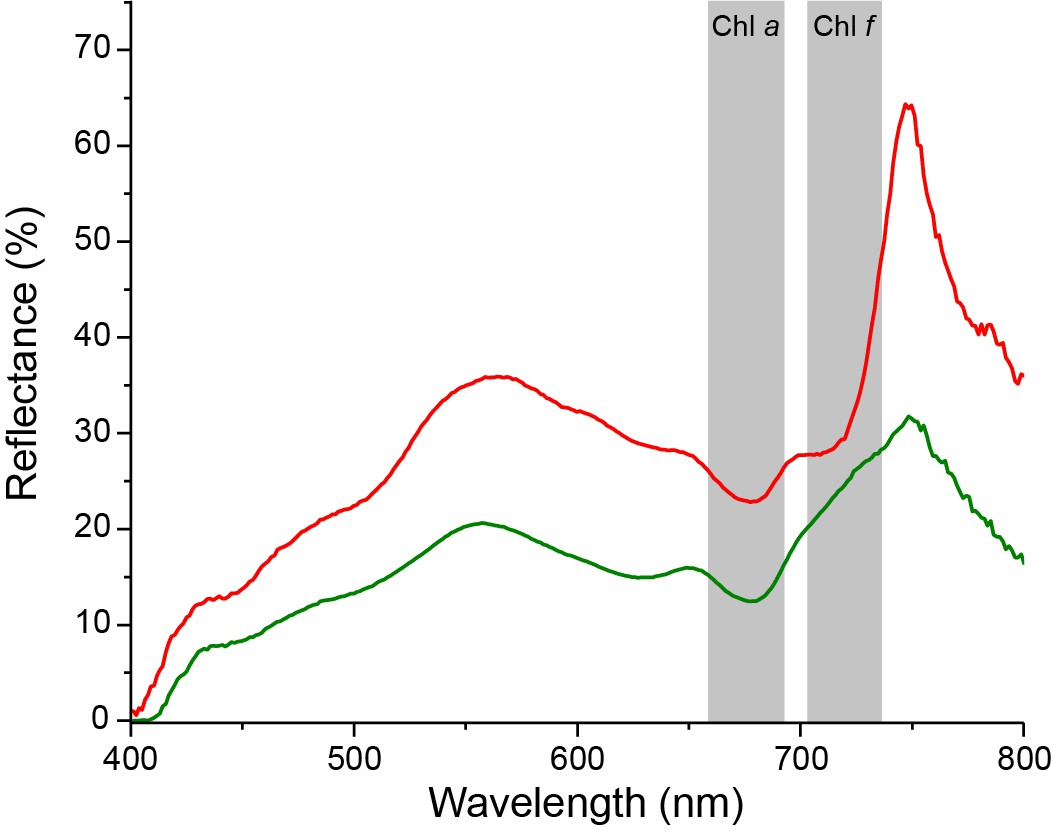
Reflectance spectra of beachrock.
Representative reflectance spectra of beachrock zones with Chl a only (green zones in Figure 1B, C) and zones with Chl a and Chl f (orange zones in Figure 1B, C). The range of Chl a and Chl f absorption are indicated with shaded areas.
Figure 1—figure supplement 2

Macroscopic distribution of Chl f in beachrock.
Spatial distribution of photopigments as mapped with hyperspectral reflectance imaging in beachrock from the black-colored (A–D) and brown-colored (E–F) zone on the beachrock platform on Heron Island. Left side panels; A, C, E, G are RGB composite images, constructed from the hyperspectral image stacks (R = 650 nm, G = 550 nm, B = 450 nm), showing ‘true’ colors of beachrock material and the biofilm community in a cross-section of the top layer. The right side panels (B, D, F, and H) map pixels with Chl a absorption (675–680 nm, green), and Chl f absorption (718–722 nm, red). Representative reflectance spectra of the two regions are shown in Figure 1—figure supplement 1C). Dashed boxes illustrate magnified parts displayed in the corresponding image directly below.
Figure 1—figure supplement 3
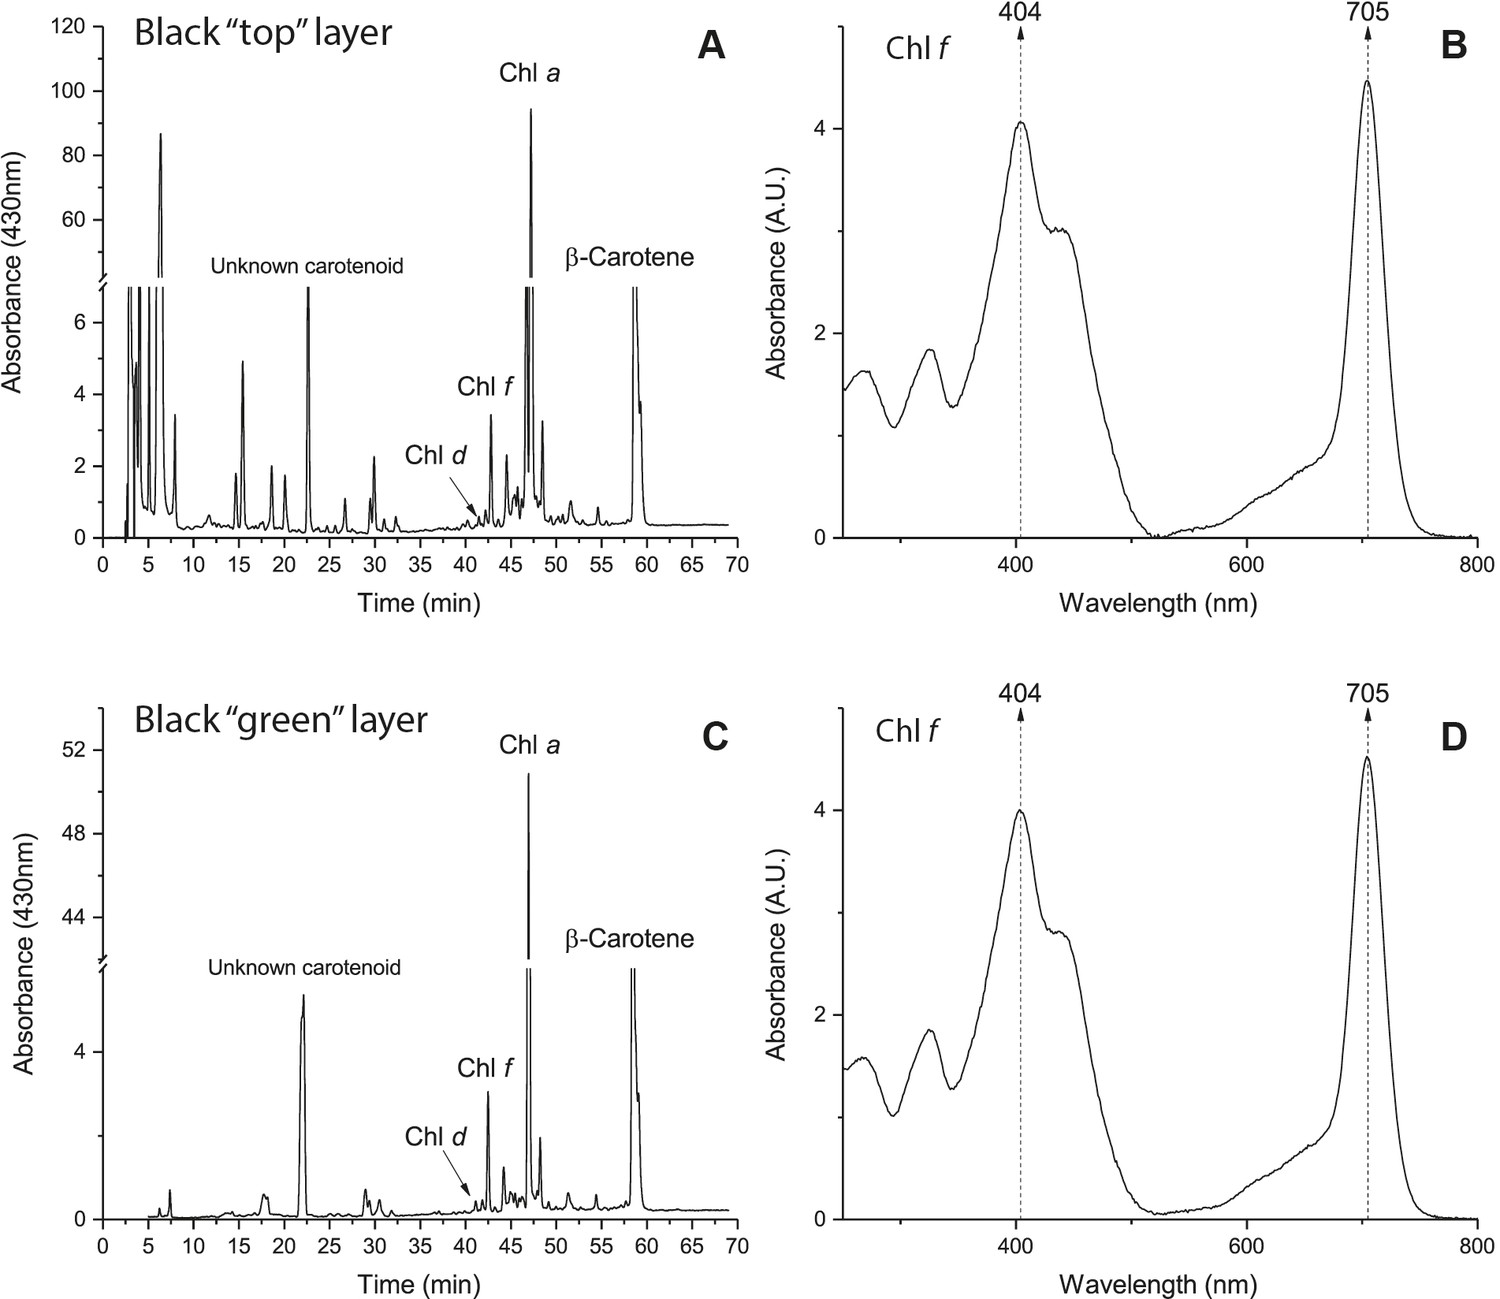
Pigment analysis of black beachrock.
HPLC chromatograms (A, C) of pigment extracts from the upper 0–2 mm of the black beachrock biofilm (A) and an underlying green endolithic zone (C) 2–5 mm below the beachrock surface, and the corresponding absorbance spectra (B, D) of the Chl f – fraction.
Figure 1—figure supplement 4
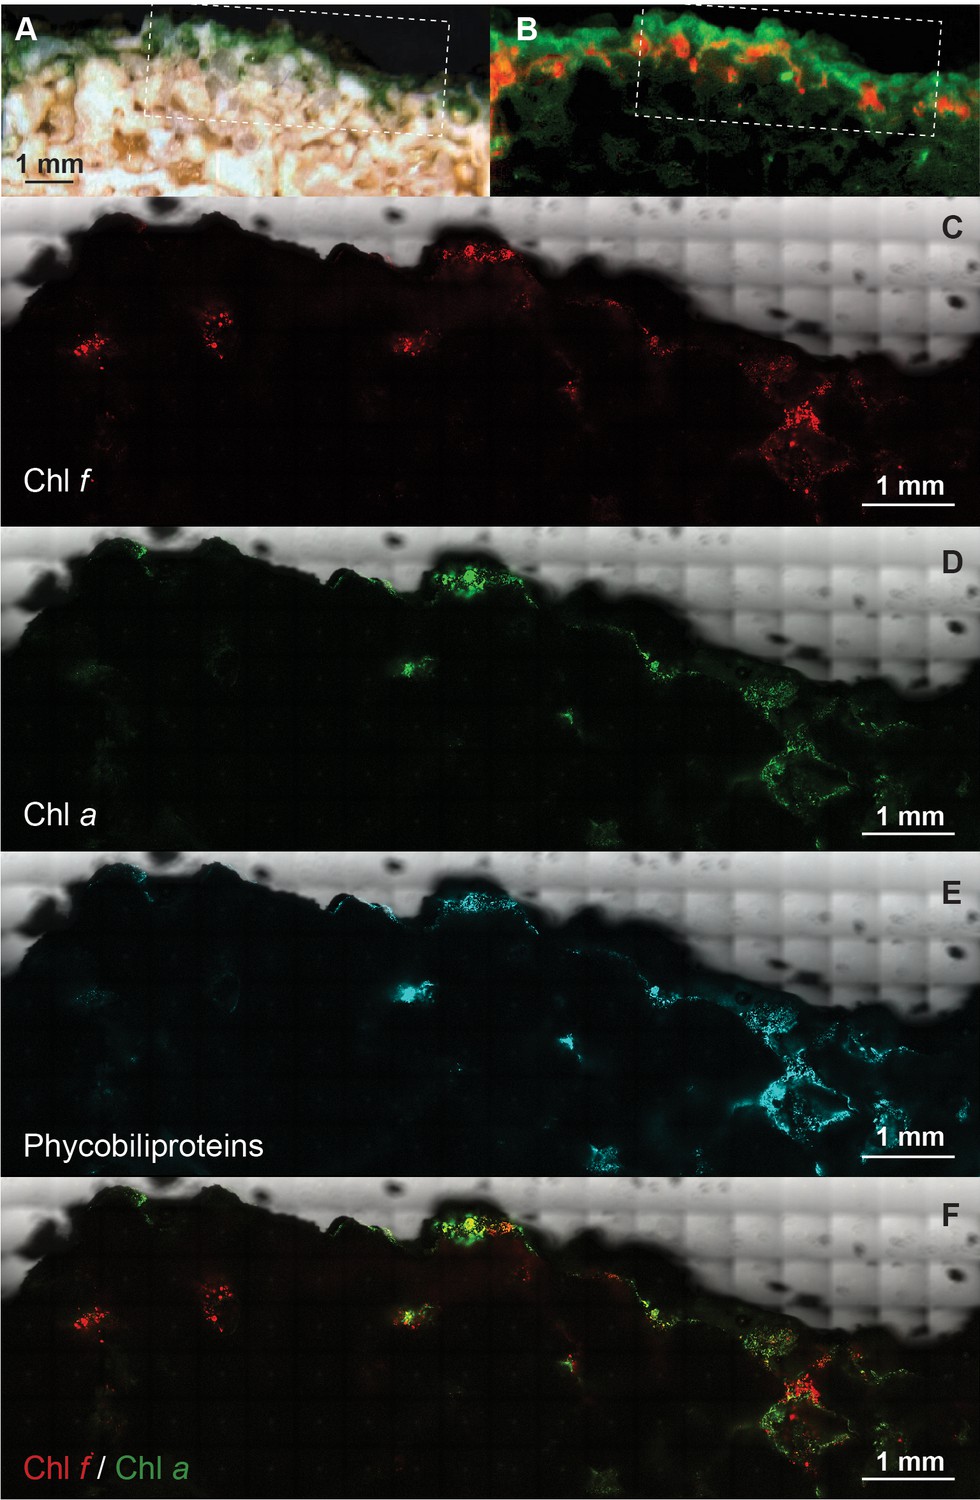
Confocal laser scanning microscopy (CLSM) of a beachrock cross-sectional area.
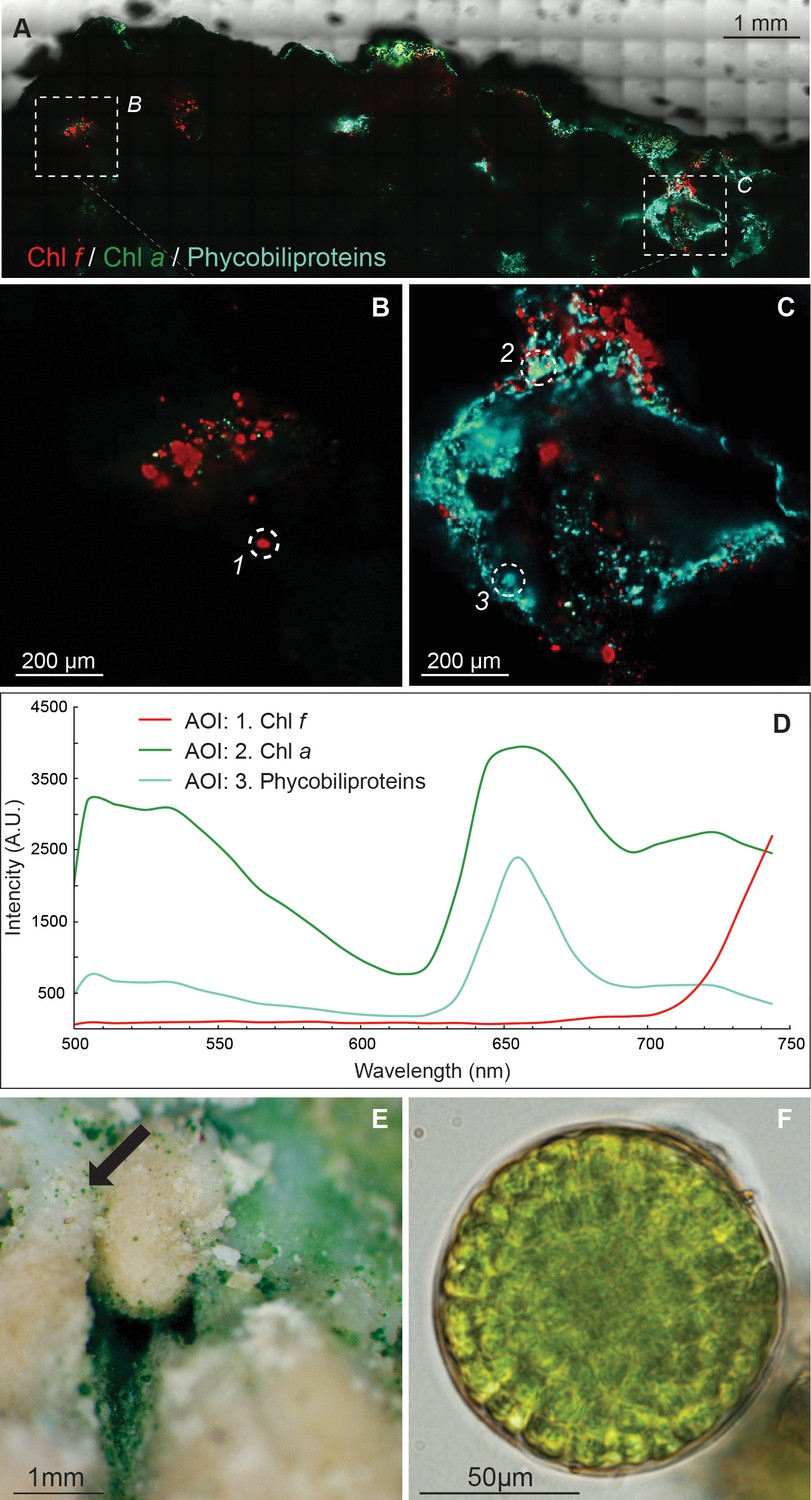
(A) Hyperspectral RGB image, and (B) color-coded image showing Chl a (green) and Chl f (red) distribution over the same beachrock cross-section as in Figure 1. Dotted boxes in panel A and B outline the area scanned with CLSM. Maximum projection image of pigment fluorescence over beachrock cross-sections imaged at 200x magnification for five focal planes (at 5 µm interval) highlighting areas with spectral fluorescence signatures of Chl a (C; 690–700 nm), phycobiliproteins (D: 650–660 nm), Chl f (E; 740–750 nm), and the Chl a/Chl f ratio (F).
Figure 1—figure supplement 5
Higher resolution CLSM of beachrock.
(A–C) CLSM scans of beachrock cross-section (marked with a dotted box in Figure 1—figure supplement 3A, (B) recorded at 600x magnification. (D) False color coding of CLSM images were done based on spectral fluorescence characteristics of cells with Chl a (690–700 nm, green), phycobiliproteins (650–660 nm, cyan), and Chl f (740–750 nm, red) in regions of interest (ROI) highlighted by circles in panel B and C. (E, F) Brightfield microscopy image of patches of green cell aggregates attached to beachrock (E) and a single-cell aggregate of pleurocapsalean cyanobacteria retrieved from a ROI exhibiting characteristic Chl f fluorescence and absorption features (F).
Figure 1—figure supplement 6
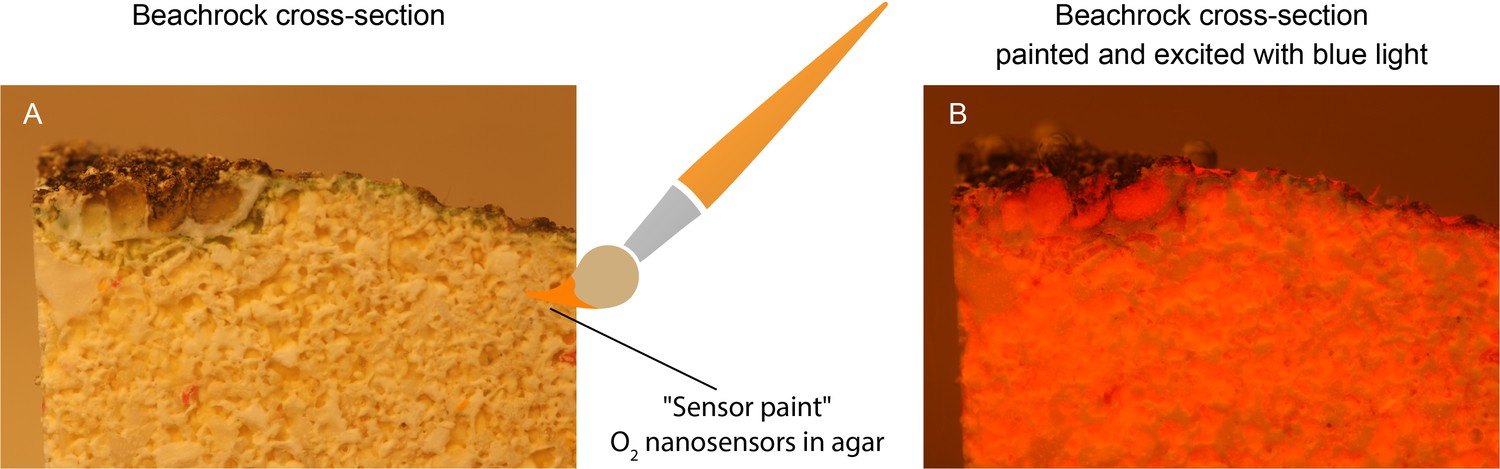
Application of agarose paint with nanoparticles.
Vertical cross-sections of beachrock (left panel) were painted with an agarose paint containing O2-sensitive luminescent nanoparticles. The beachrock was coated homogenously with a thin (<1 mm) layer of luminescent paint (right panel) that was mechanically stable after solidification of the agar. This enabled ratiometric imaging of the O2 dependent luminescence over the beachrock cross-section (see Materials and methods).
Figure 1—figure supplement 7
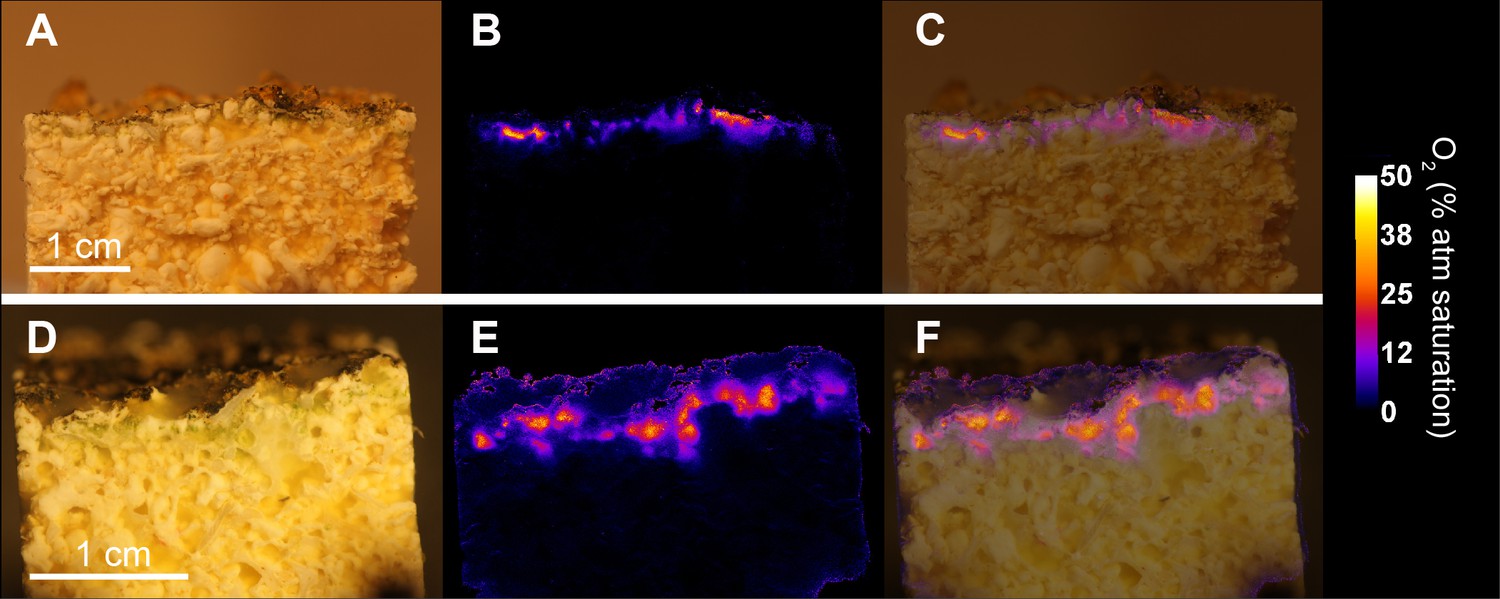
NIR-driven O2 production by endolithic cyanobacteria in beachrock.
Cross-sections of two beachrock samples (A, D) were painted with agarose paint containing O2 sensitive nanoparticles (see Figure 1—figure supplement 5) and incubated in anoxic seawater for 30 min under a photon irradiance (740 nm, half-bandwidth 25 nm) of 28 µmol photons m−2 s−1. The resulting O2 concentration (false-color coded in units of % air saturation) was mapped via ratiometric luminescence imaging (B, E) and overlaid on top of the structural image of the beachrock cross-section (C, F).
Figure 1—figure supplement 8
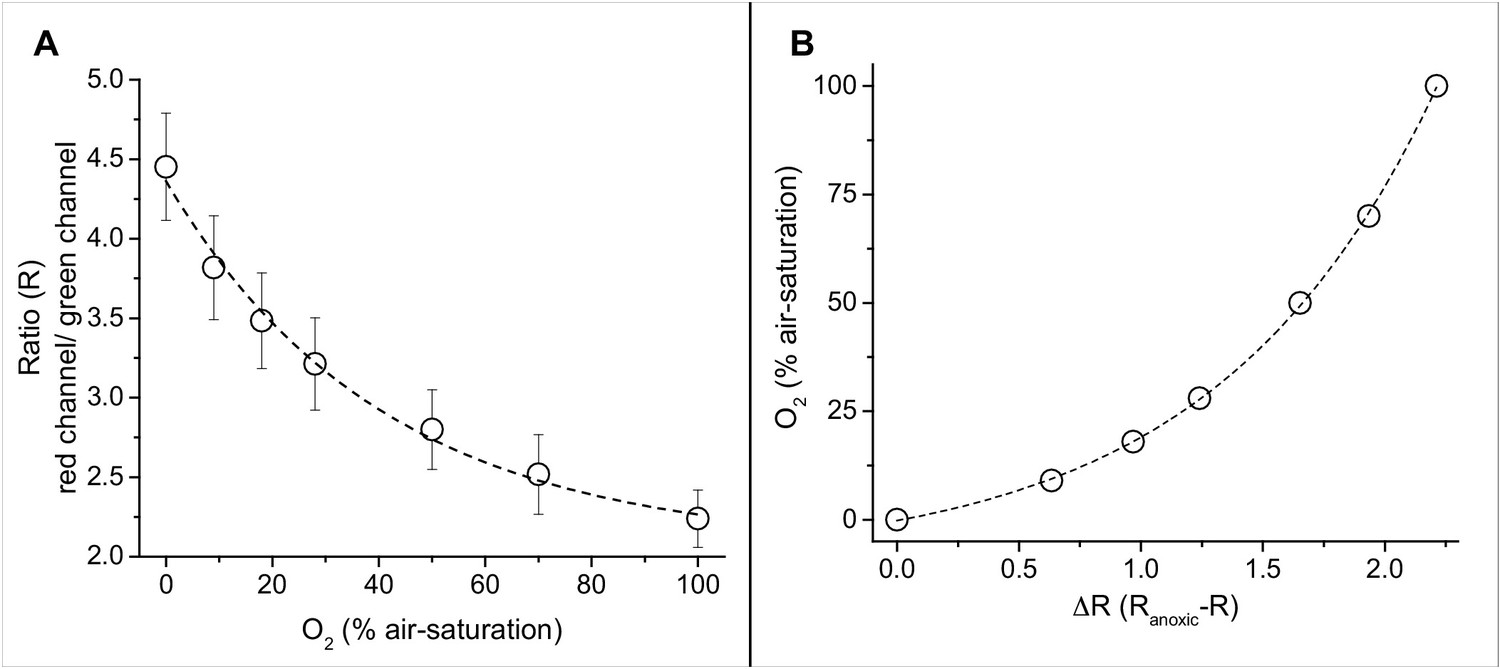
Calibration curve of the nanoparticle-based O2 sensor paint.
(A) Ratio (R) of the red channel and the green channel in RGB images plotted vs. the measured O2 concentration in % air-saturation. (B) Calibration curve of the sensor particle based sensor paint calculated as ΔR (=Ranoxic - R) plotted vs. the measured O2 concentration in % air-saturation. Data points with error bars represent means of the entire sensing area with the corresponding standard deviation; the dotted lines represent exponential fits (R2 >0.99).
Figure 2

Oxygen consumption and NIR-driven oxygenic photosynthesis in beachrock.
Cross-sectional images of initial O2 consumption after onset of darkness (A) and maximum net photosynthetic O2 production (B) after onset of actinic NIR illumination (740 nm, 28 µmol photons m−2 s−1) of the beachrock cross-section shown in Figure 1. (C) The NIR-driven gross photosynthesis was estimated by summing the absolute rates of net photosynthesis under NIR and O2 consumption in the dark. (D) Overlay of gross photosynthesis distribution over a structural image of the beachrock cross-section. (E) Data for O2 consumption, and NIR-driven net and gross photosynthesis were extracted for 11 regions of interest (ROI) in panel C and are presented as means ± standard deviation within the ROI.
Videos
Video 1
Animation of NIR-driven O2 dynamics over a beachrock cross-section (see Figures 1 and 2) coated with a thin (<1 mm) agarose layer with luminescent O2 sensor nanoparticles.
The movie sequence shows the decline in O2 concentration (recorded at 5 min interval) starting from steady-state conditions under a NIR irradiance (740 nm; 25 nm HBW) of 28 µmol photons m−2 s−1 approaching steady-state dark conditions after 35 min, followed by the rise in O2 concentration over 25 min after switching the NIR irradiation on again. The colored scale bar relates the colors to O2 concentrations.
Tables
Key resources table
| Reagent type (species) or resource | Designation | Source | Identifiers | Additional information |
|---|---|---|---|---|
| Chemical compound, drug | Agarose | Thermo Fisher | 16520100 | |
| Chemical compound, drug | PtTFPP | Frontier Scientific www.frontiersci.com/ | PtT975 | O2-sensitive dye in the O2 sensor nanoparticles (Koren et al., 2015) |
| Chemical compound, drug | Macrolex fluorescent yellow | Kremer Pigments www.kremer-pigmente.com/en/ | Reference dye in the O2 sensor nanoparticles (Koren et al., 2015) | |
| Chemical compound, drug | PSMA (XIRAN) | Polyscope www.polyscope.eu/ | Polymer used in the O2 sensor nanoparticles (Koren et al., 2015) | |
| Software, algorithm | Image J | http://rsb.info.nih.gov/ij/ | RRID:SCR_003070 | Used for calculations of O2concentration images and visualization of hyperspectral images, structure and O2concentration |
| Software, algorithm | Ratio Plus Image J plugin | http://rsb.info.nih.gov/ij/plugins/ratio-plus.html | Used for calculations of image ratios | |
| Software, algorithm | look@RGB | http://imaging.fish-n-chips.de | Used for camera and LED control during image acquisition (Larsen et al., 2011) | |
| Software, algorithm | Hyperspectral Imager V. 4.2 | PhiLumina, LLC, Gulfport, MS, USA www.philumina.com/ | Used for hyperspectral image stack acquisition | |
| Software, algorithm | ENVI | L3 Harris Geospatial, Brromfield, CO, USA www.harrisgeospatial.com/ | Used for hyperspectral image stack conversion | |
| Software, algorithm | Look@MOSI | www.microsenwiki.net/doku.php/hsimaging:hs_iman_howto | Used for hyperspectral image analysis | |
| Chemical compound, drug | Acetone Methanol Ammonium acetate Acetonitrile Ethylacetate | Sigma Aldrich | 650501 34860 543834 114291 103649 | Solvents used in HPLC analysis |
| Software, algorithm | OpenLAB CDS ChemStation Edition | Agilent Technologies | Used for HPLC analysis | |
| Other | Supor-200 polyethersulfone membrane disc filters (47 mm diameter, 0.2 µm pore size) | PALL | 63025 | Filters for seawater filtration |
| Commercial assay or kit | DNeasy PowerLyzer PowerSoil kit | QIAGEN | 12855 | Extraction of DNA from beachrock |
| Commercial assay or kit | DNeasy PowerWater kit | QIAGEN | 14900 | Extraction of DNA from seawater |
| Commercial assay or kit | PCR reaction | PCRBIO | PB10.41–02 | Amplification of 16S rRNA gene |
| Sequence-based reagent | V3 | Eurofins | 5’-CCTAYGGGRBGCASCAG-3’ | PCR primer for 16S rRNA gene |
| Sequence-based reagent | V4 | Eurofins | 5’-GGACTACHVGGGTWTCTAAT-3’ | PCR primer for 16S rRNA gene |
| Software, algorithm | BLAST | NCBI http://blast.ncbi.nlm.nih.gov/Blast.cgi | RRID:SCR_004870 |
Additional files
-
Supplementary file 1
Overview of cyanobacterial strains and enrichments reported to contain Chl f.
- https://cdn.elifesciences.org/articles/50871/elife-50871-supp1-v1.docx
-
Supplementary file 2
List of most abundant OTUs related to oxygenic phototrophs in black beachrock and seawater.
- https://cdn.elifesciences.org/articles/50871/elife-50871-supp2-v1.docx
-
Transparent reporting form
- https://cdn.elifesciences.org/articles/50871/elife-50871-transrepform-v1.docx
Download links
A two-part list of links to download the article, or parts of the article, in various formats.
Downloads (link to download the article as PDF)
Open citations (links to open the citations from this article in various online reference manager services)
Cite this article (links to download the citations from this article in formats compatible with various reference manager tools)
Substantial near-infrared radiation-driven photosynthesis of chlorophyll f-containing cyanobacteria in a natural habitat
eLife 9:e50871.
https://doi.org/10.7554/eLife.50871


