Rarity is a more reliable indicator of land-use impacts on soil invertebrate communities than other diversity metrics
- Manaaki Whenua - Landcare Research, New Zealand
- Bio-Protection Research Centre, Lincoln University, New Zealand
- Manaaki Whenua – Landcare Research, New Zealand
- Bio-Protection Research Centre, School of Biological Sciences, University of Canterbury, New Zealand
Figures
Figure 1 with 3 supplements
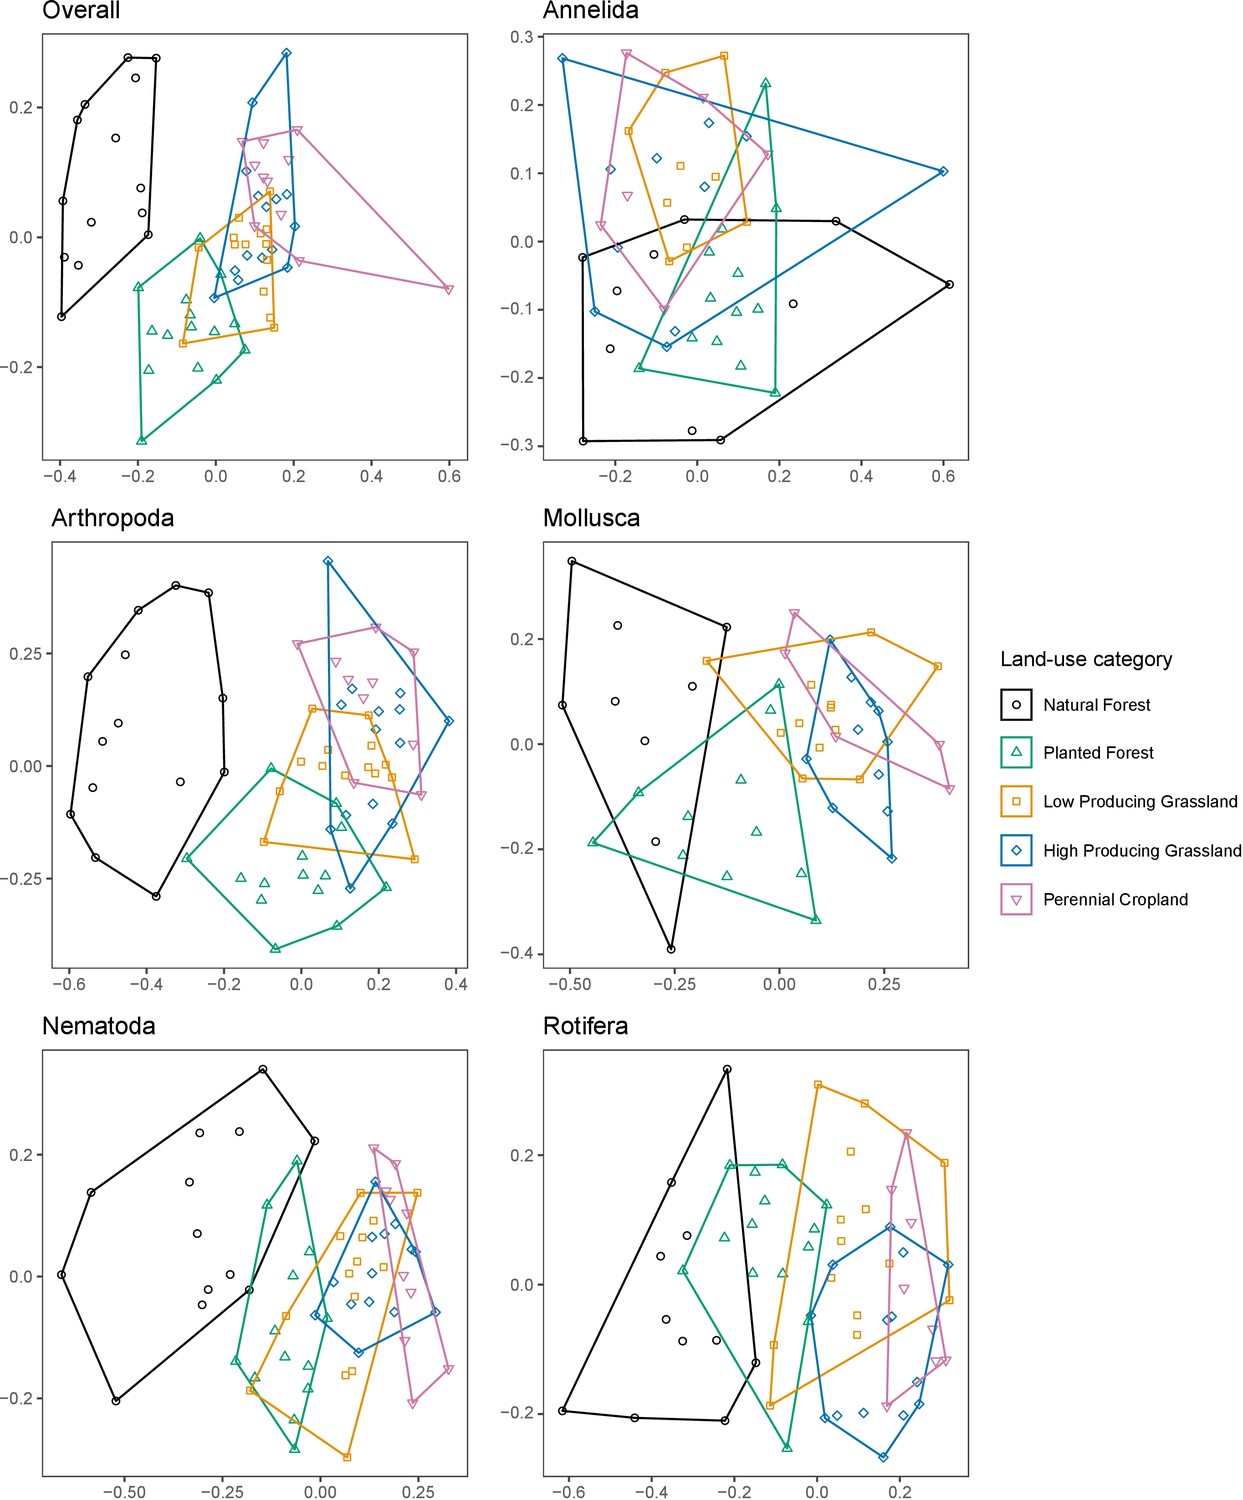
Soil invertebrate community composition differs between land-use categories.
Non-metric MDS ordinations showing differences in the composition of soil invertebrate communities detected by DNA metabarcoding in five land-use categories, for overall communities, and for individual phyla with ≥ 100 OTUs. Ordinations are based on binary Jaccard distances.
-
Figure 1—source data 1
Results of PERMANOVA tests for differing soil invertebrate community composition, and ANOVA tests for differing multivariate homogeneity of sample dispersions, beta diversity, and phylogenetic beta diversity, between five land-use categories.
- https://cdn.elifesciences.org/articles/52787/elife-52787-fig1-data1-v1.docx
Figure 1—figure supplement 1
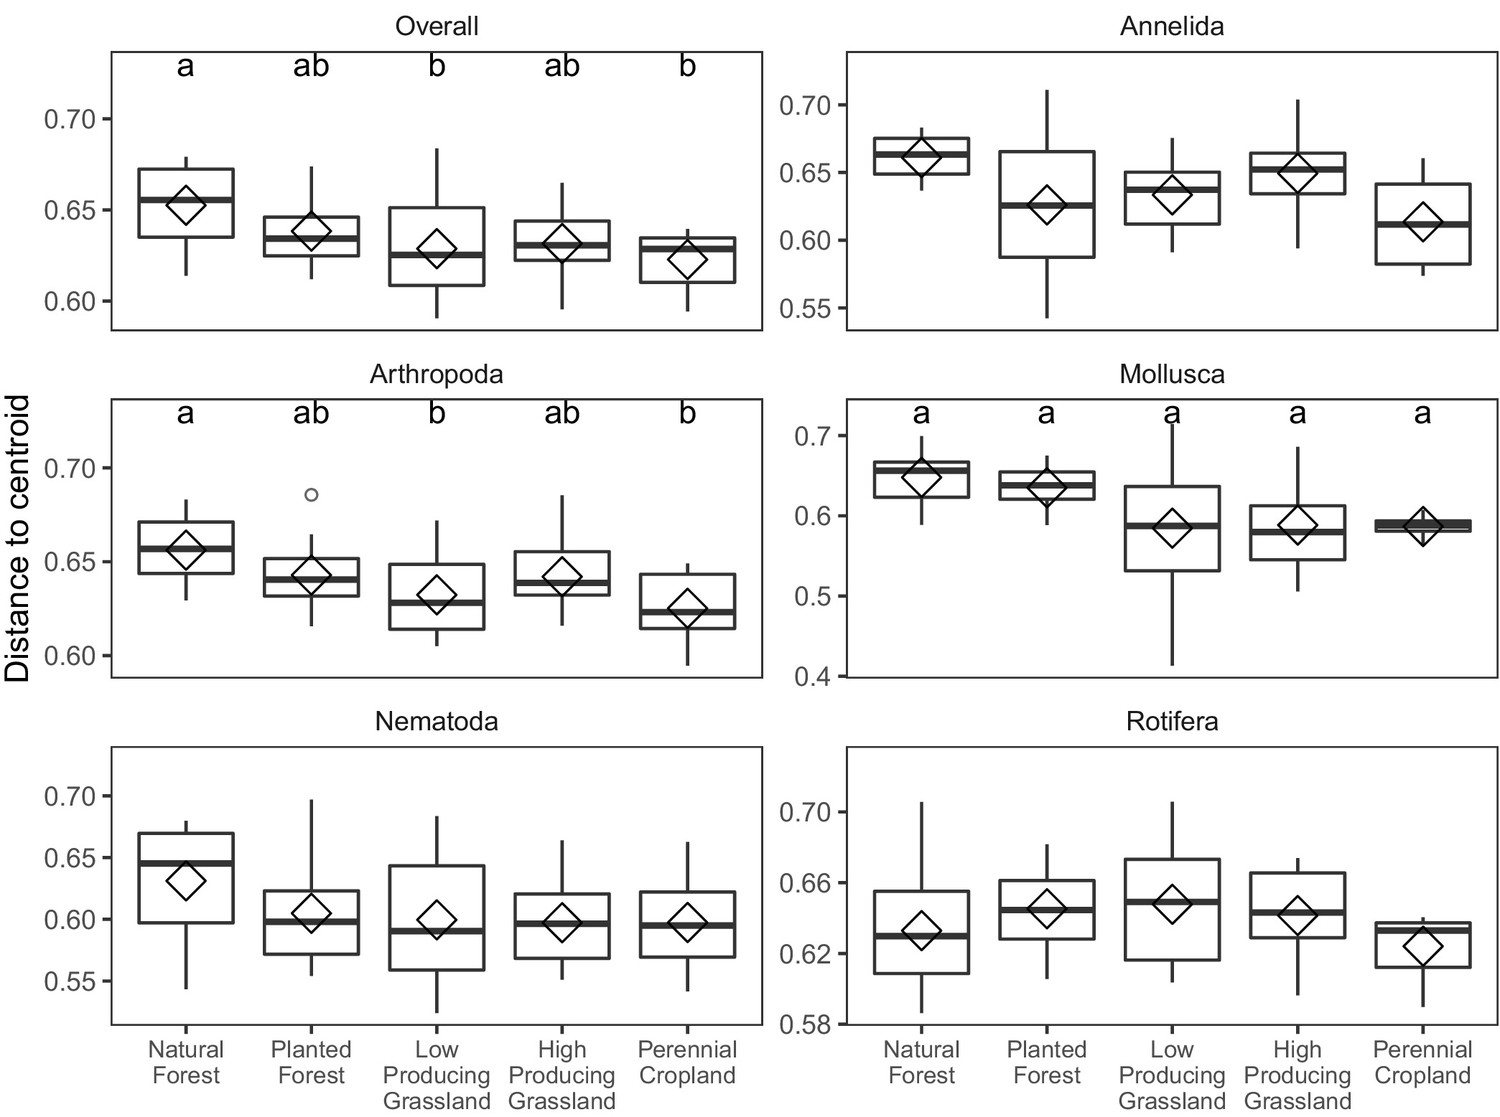
Multivariate homogeneity of soil invertebrate communities detected in different land-use categories.
Boxplots of multivariate sample dispersion of soil invertebrate communities detected by DNA metabarcoding in five land-use categories, for overall soil invertebrate communities, and for individual phyla with > = 100 OTUs. Letters indicate significantly differing land-use categories according to post-hoc Tukey HSD tests, for groups with significant ANOVA differences.
Figure 1—figure supplement 2

Beta diversity of soil invertebrate communities detected in different land-use categories.
Boxplots of pairwise beta diversity of soil invertebrate communities detected by DNA metabarcoding in five land-use categories, for overall soil invertebrate communities, and for individual phyla with > = 100 OTUs. Letters indicate significantly differing land-use categories according to post-hoc Tukey HSD tests, for groups with significant ANOVA differences.
Figure 1—figure supplement 3
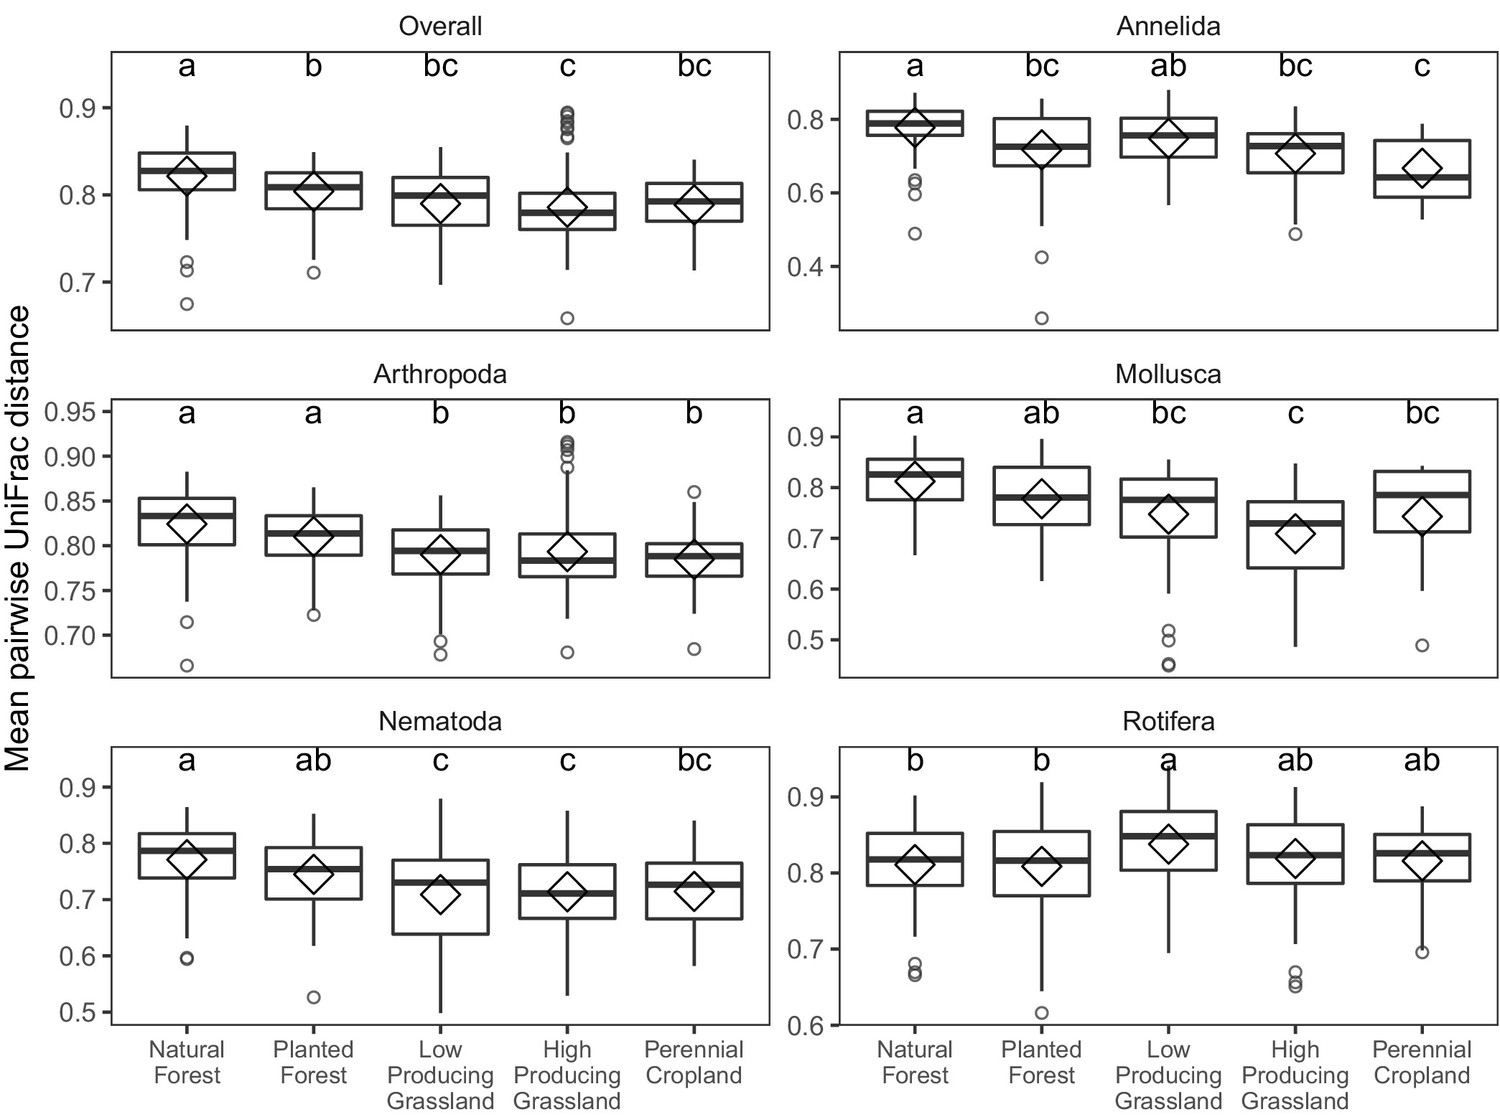
Phylogenetic beta diversity of soil invertebrate communities detected in different land-use categories.
Boxplots of pairwise phylogenetic beta diversity (UniFrac distance) of soil invertebrate communities detected by DNA metabarcoding in five land-use categories, for overall soil invertebrate communities, and for individual phyla with > = 100 OTUs. Letters indicate significantly differing land-use categories according to post-hoc Tukey HSD tests, for groups with significant ANOVA differences.
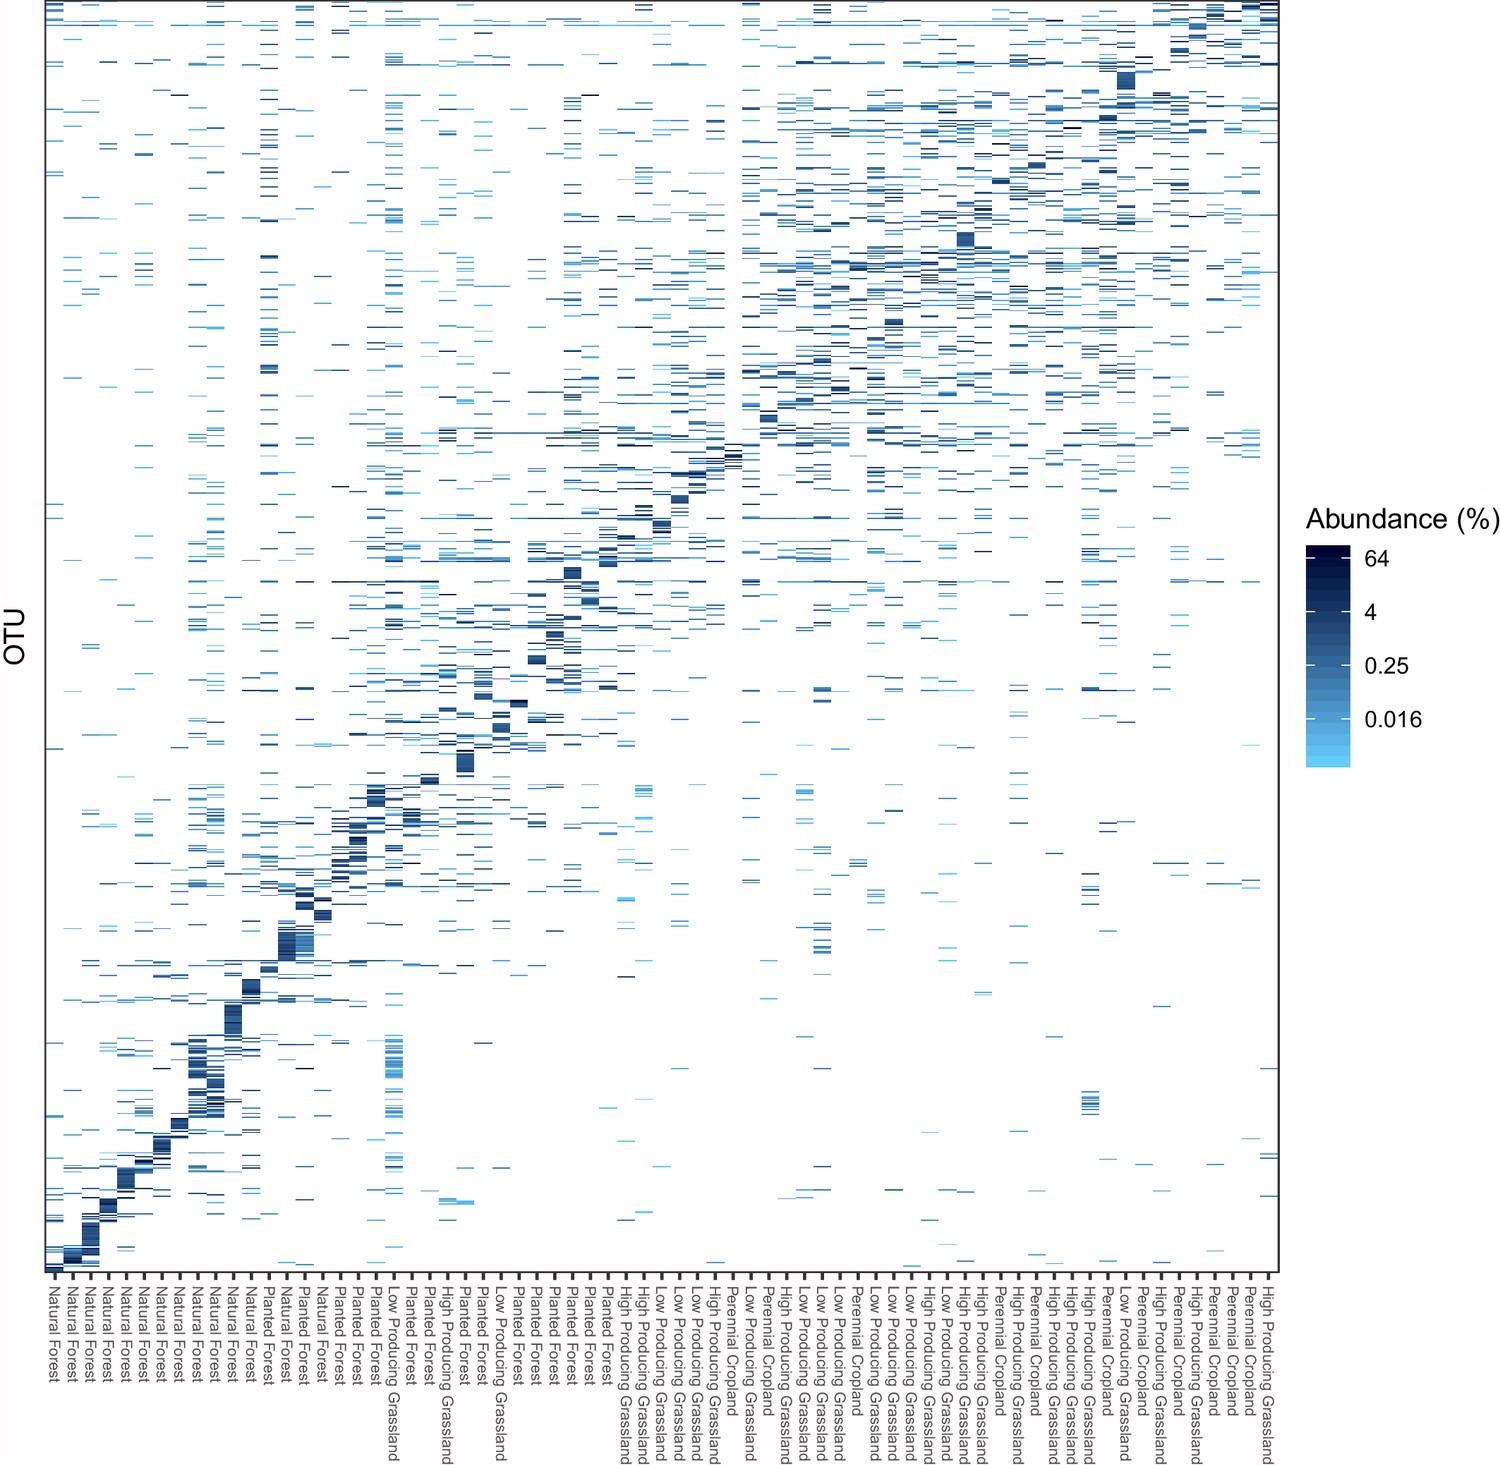
Figure 2 with 1 supplement
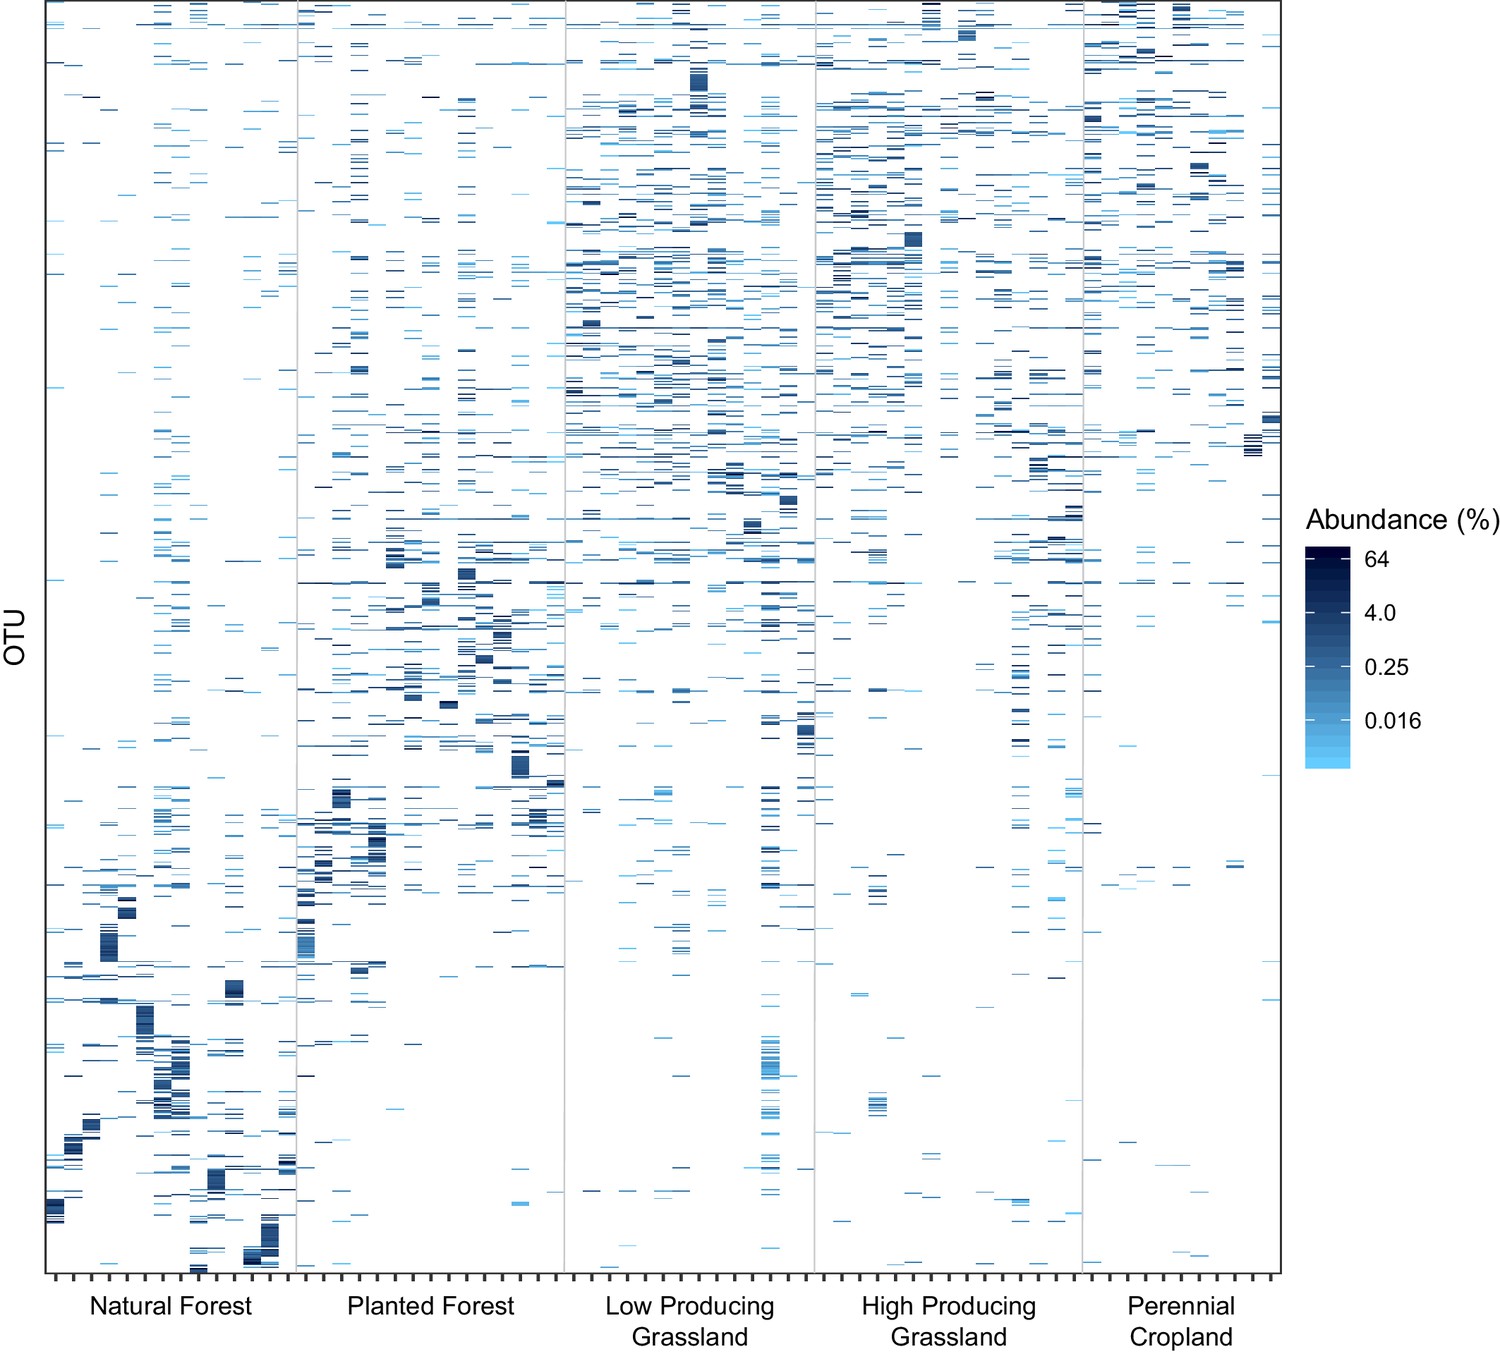
Distribution of the 1000 most abundant soil invertebrate OTUs across samples and land-use categories.
The proportional abundance and distribution among samples and five land-use categories of the 1000 most proportionally abundant soil invertebrate OTUs detected by DNA metabarcoding, showing that natural forest sites have more heterogeneous assemblages of soil invertebrate OTUs than agricultural sites. Samples are ordered on the x-axis by land-use category and increasing latitude.
Figure 2—figure supplement 1
Distribution of the 1000 most abundant soil invertebrate OTUs across samples and land-use categories, with samples ordered by compositional similarity.
The proportional abundance and distribution among samples and five land-use categories of the 1000 most proportionally abundant soil invertebrate OTUs detected by DNA metabarcoding, showing that natural forest sites have more heterogeneous assemblages of soil invertebrate OTUs than agricultural sites. The data is the same as in Figure 2, but the samples are ordered on the x-axis by OTU compositional similarity.
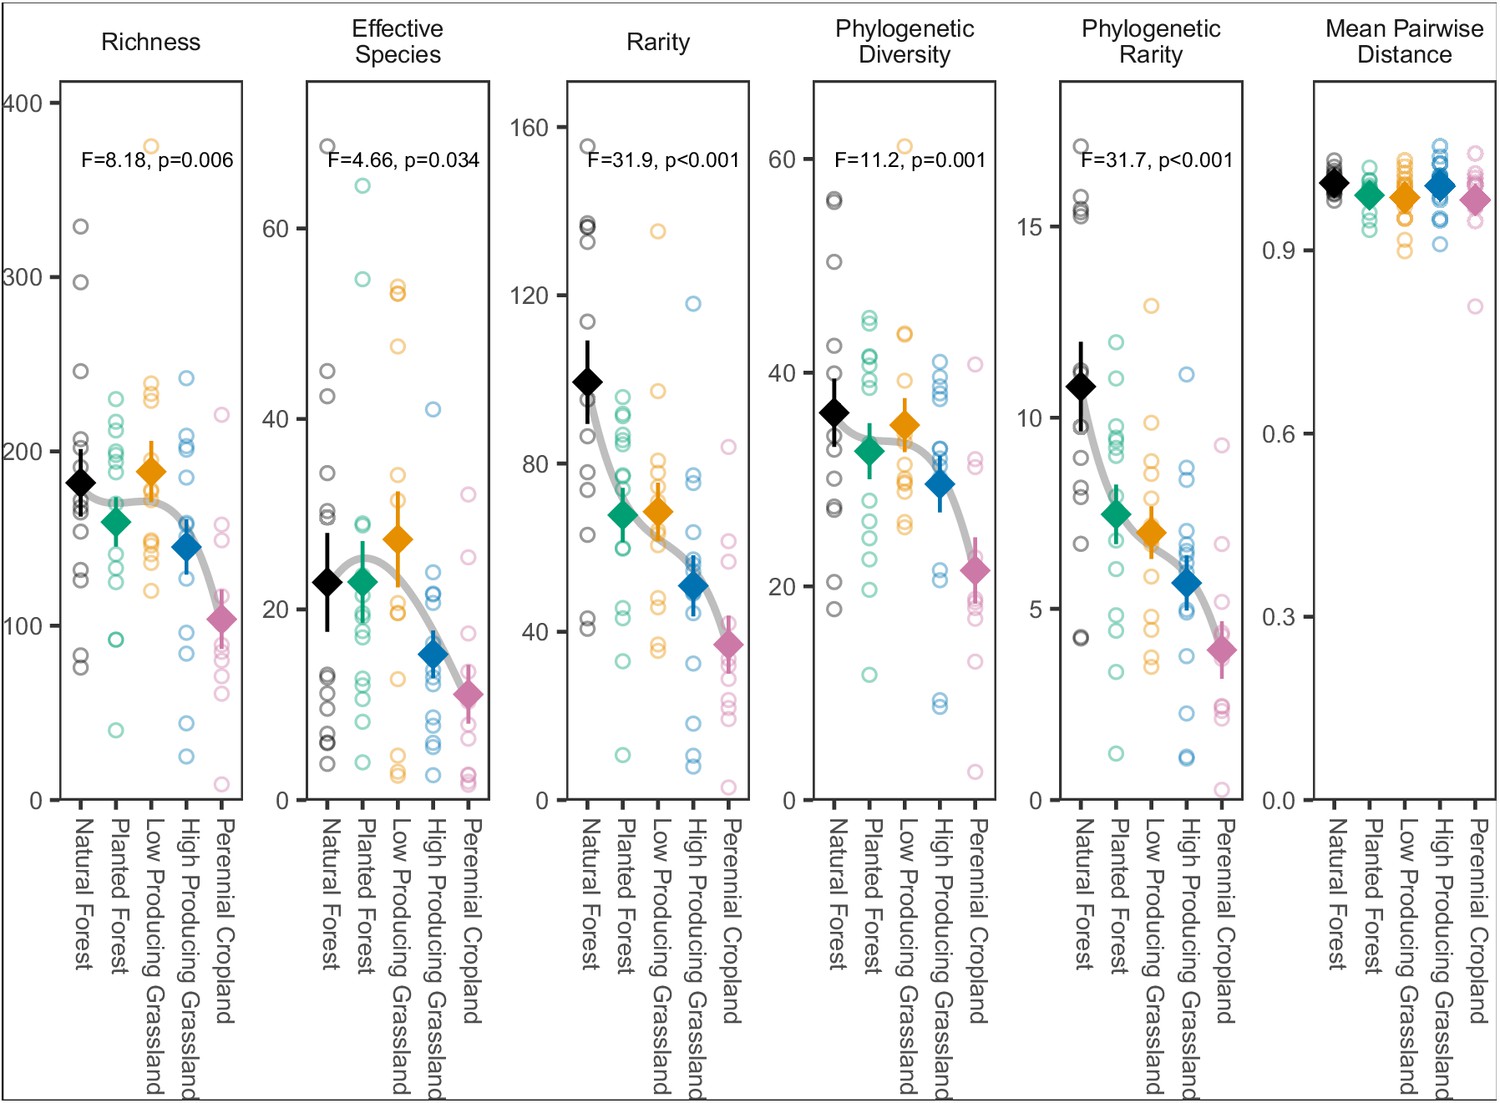
Figure 3 with 2 supplements
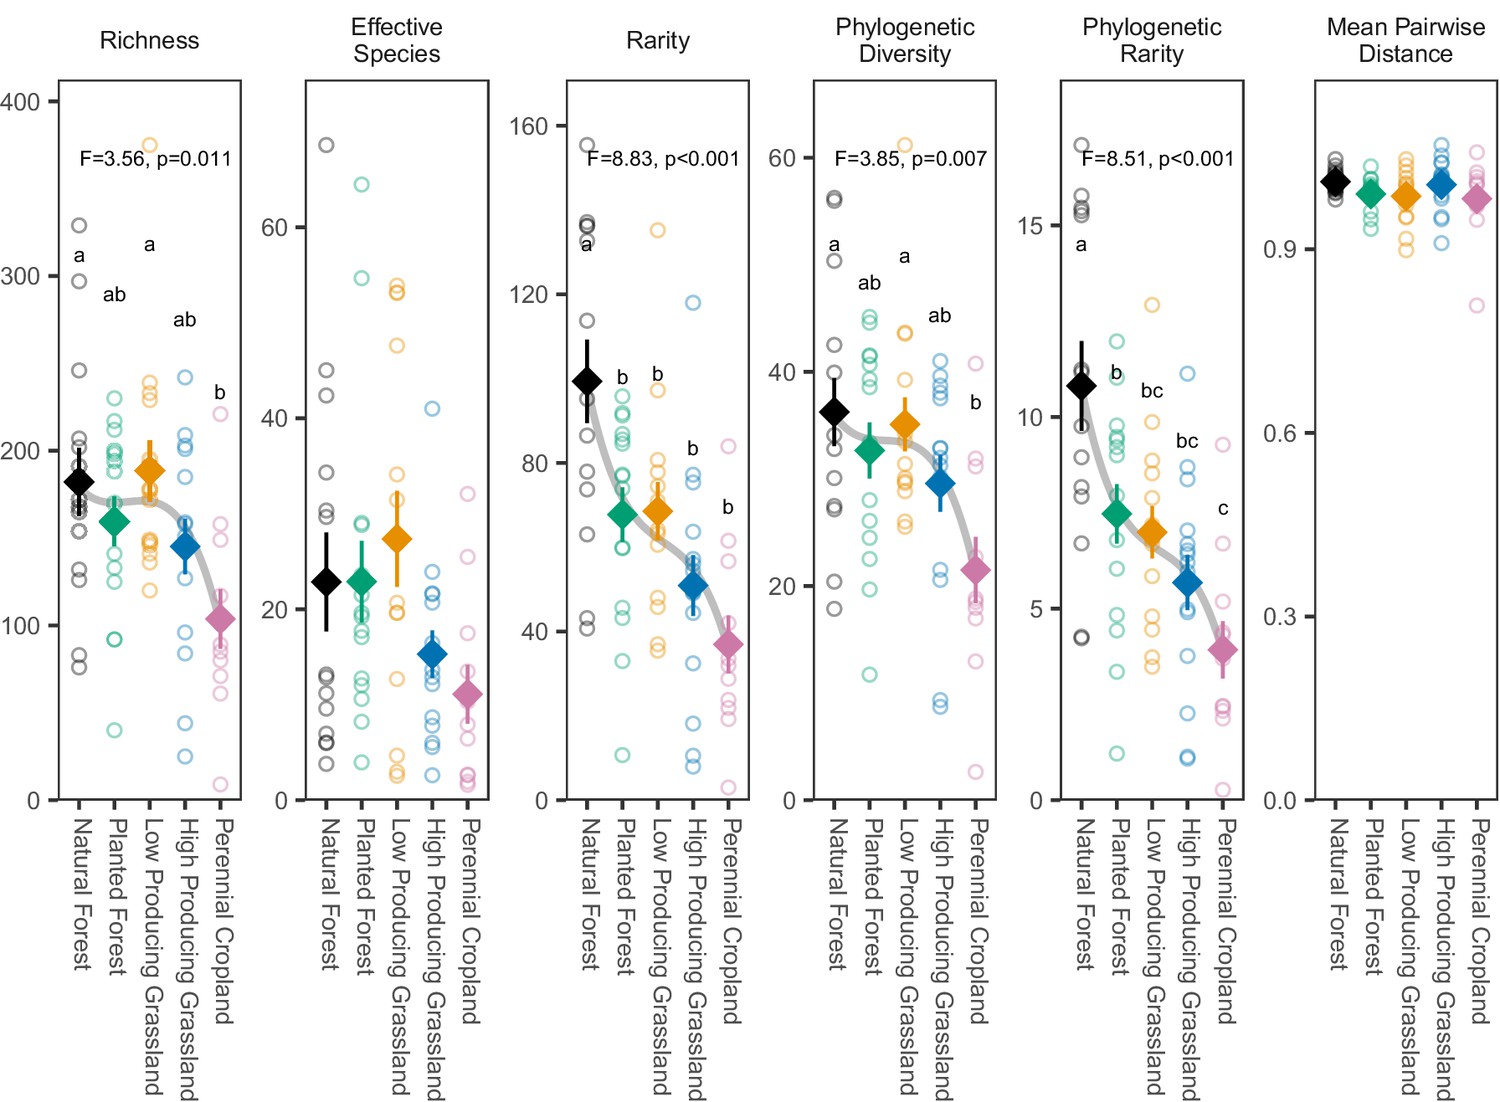
Biodiversity estimates for overall soil invertebrate communities detected in different land-use categories.
The biodiversity of soil invertebrate communities detected by DNA metabarcoding declines from forested to agricultural sites according to most metrics, with the clearest declines shown by rarity metrics. Diamonds and whiskers represent mean values ± standard errors, with individual data points represented by circles. ANOVA test statistics and trend splines are shown for cases with statistically significant biodiversity differences among land-use categories, with letters indicating differences between land-use categories detected by post-hoc Tukey HSD tests.
-
Figure 3—source data 1
Results of ANOVA tests for differing soil invertebrate biodiversity between different land-use categories, according to six biodiversity metrics.
- https://cdn.elifesciences.org/articles/52787/elife-52787-fig3-data1-v1.docx
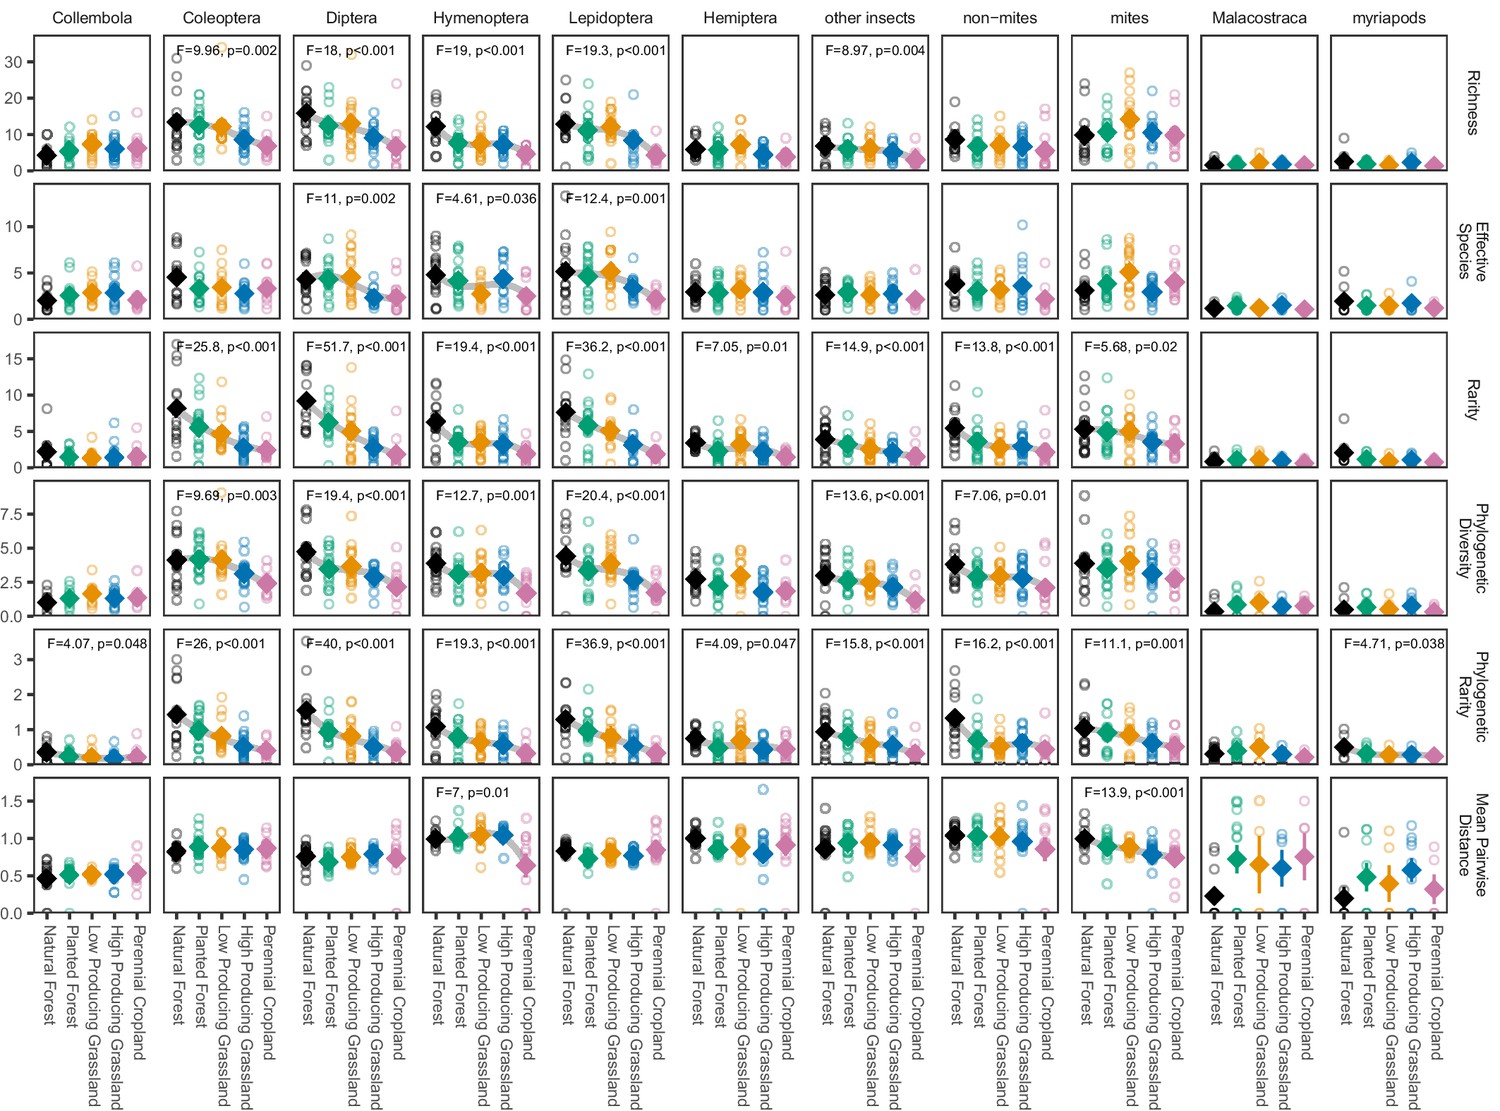
Figure 3—figure supplement 1
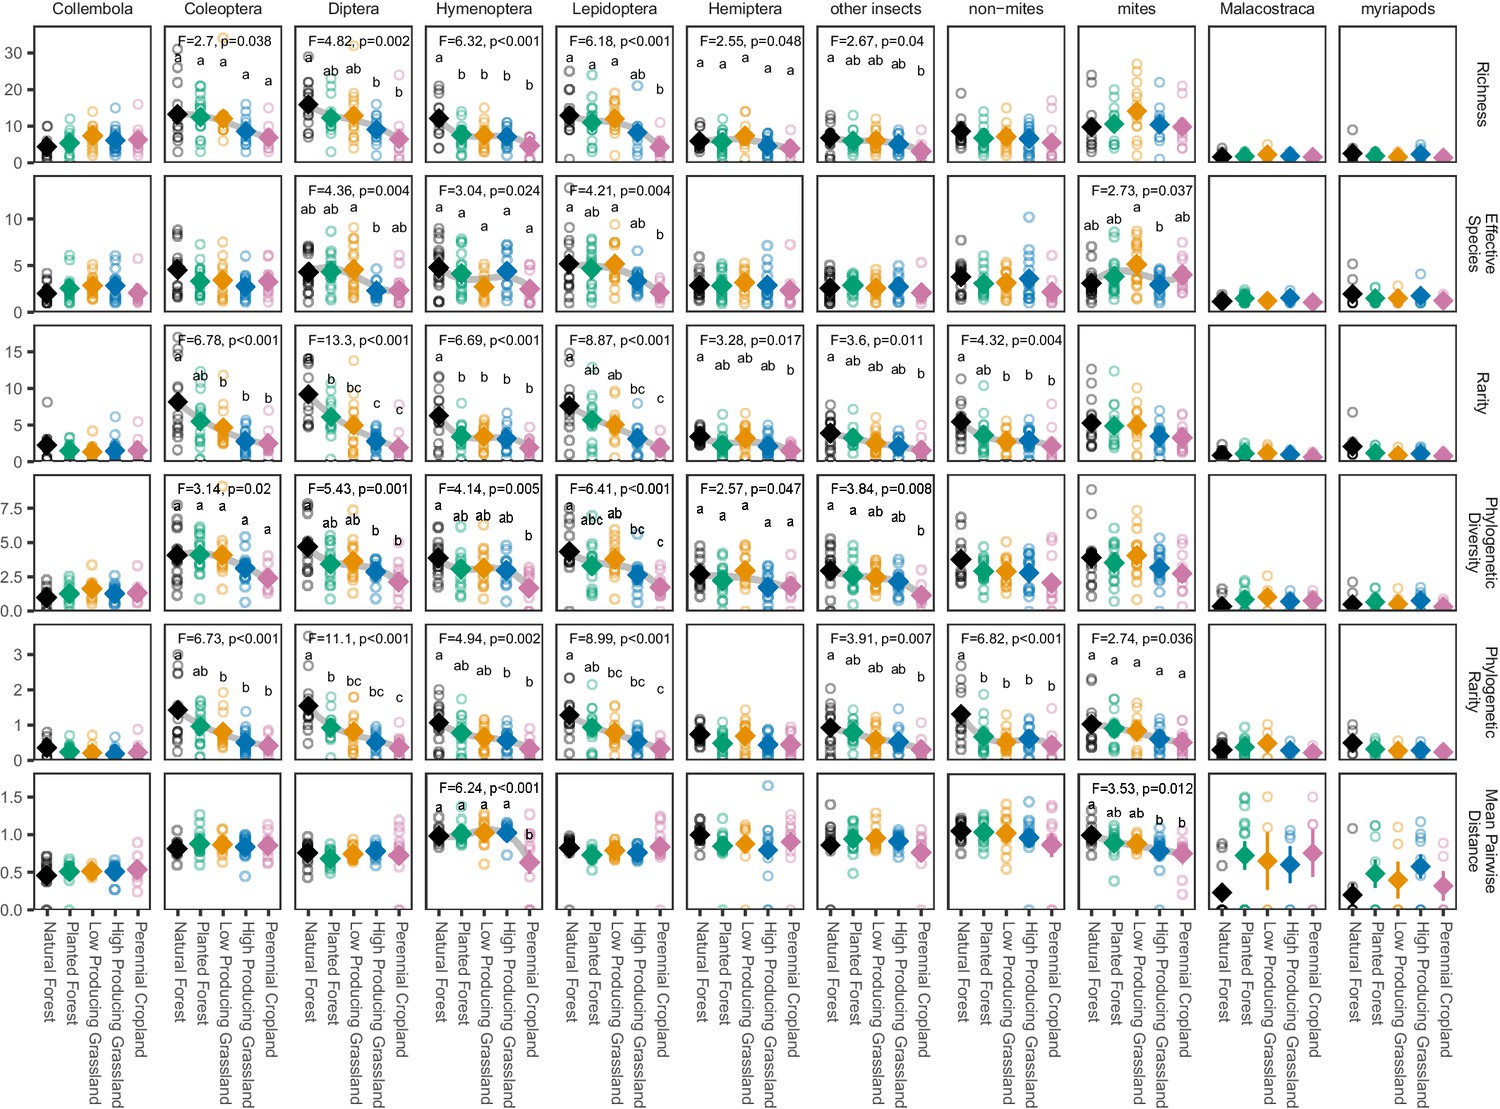
Biodiversity estimates for soil arthropod groups in different land-use categories.
The biodiversity of most soil arthropod groups detected by DNA metabarcoding declines from natural forest to agricultural sites, with the most consistent patterns among groups shown by rarity metrics. ‘Other insects’ consists of all insect orders other than Coleoptera, Diptera, Hemiptera, Hymenoptera, and Lepidoptera. ‘Non-mites’ consist of Araneae, Opiliones, and Pseudoscorpiones. Diamonds and whiskers represent mean values ± standard errors, with individual data points represented by circles. ANOVA test statistics and trend splines are shown for cases with statistically significant biodiversity differences among land-use categories, with letters indicating differences between land-use categories detected by post-hoc Tukey HSD tests.
Figure 3—figure supplement 2
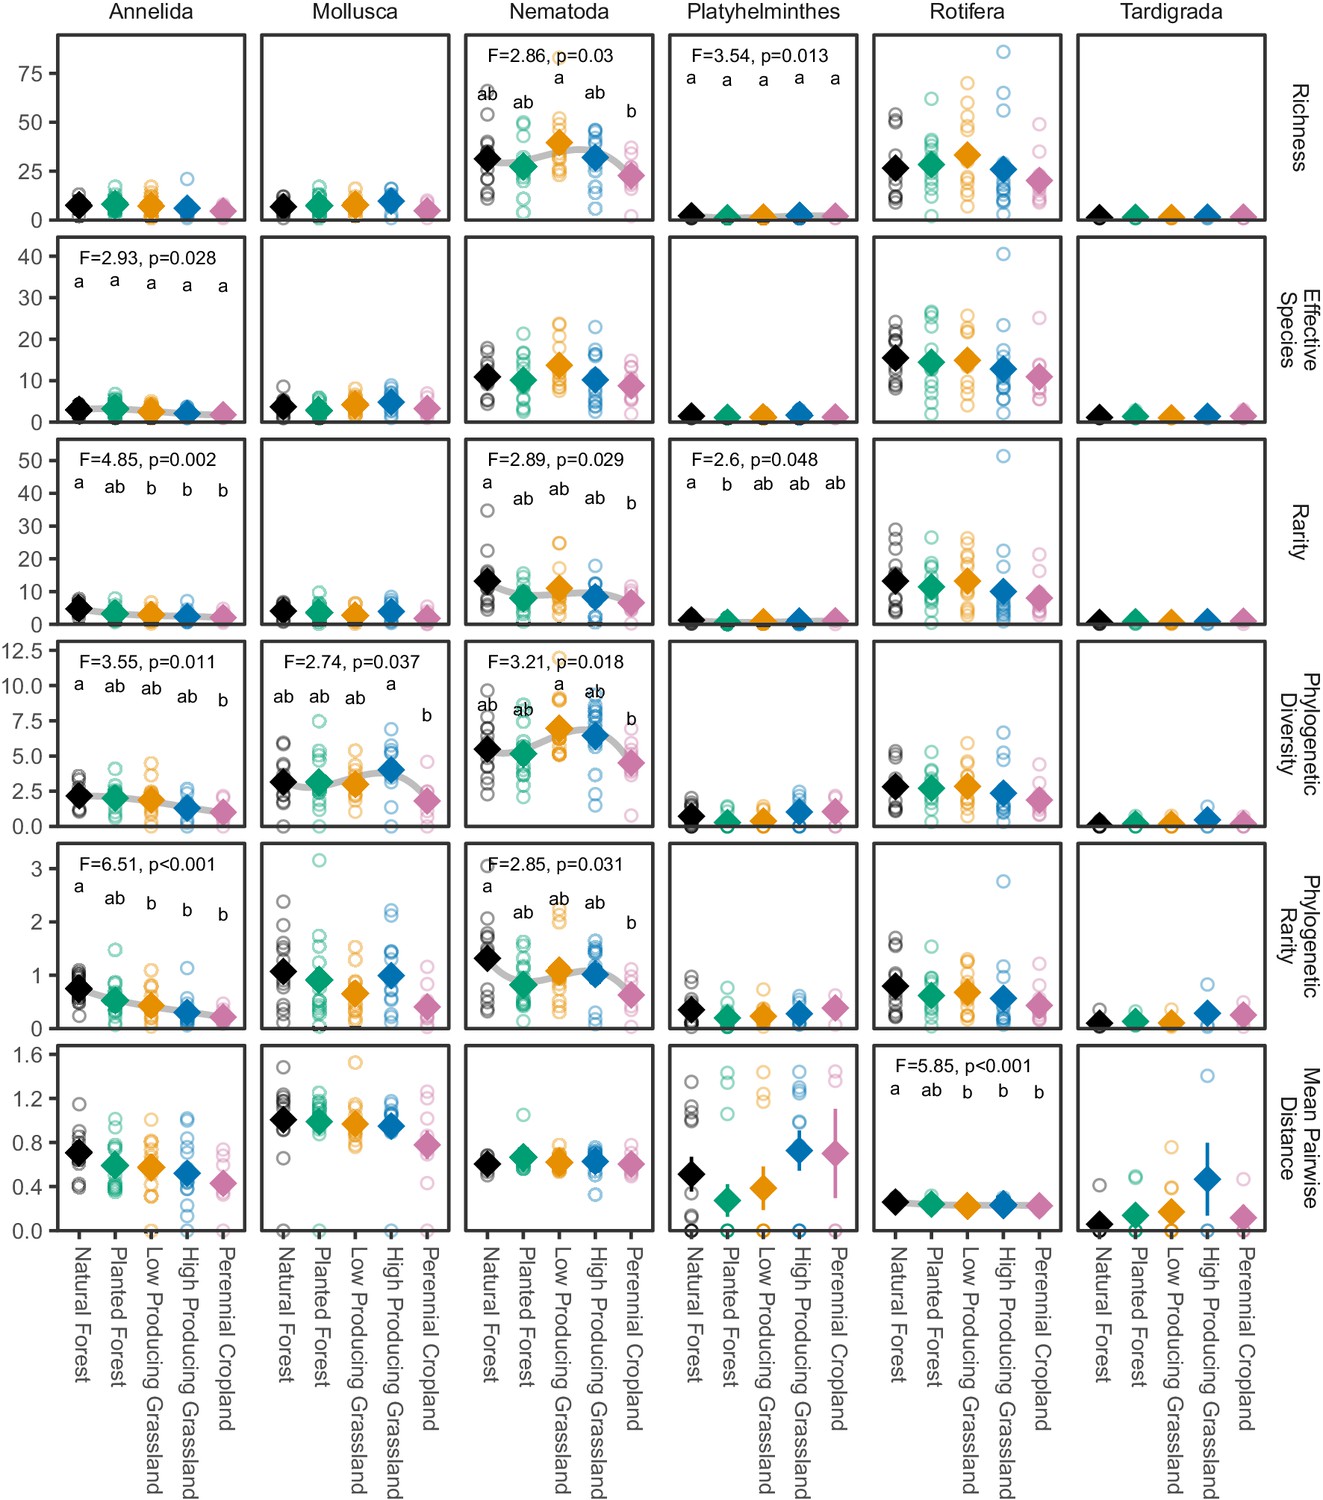
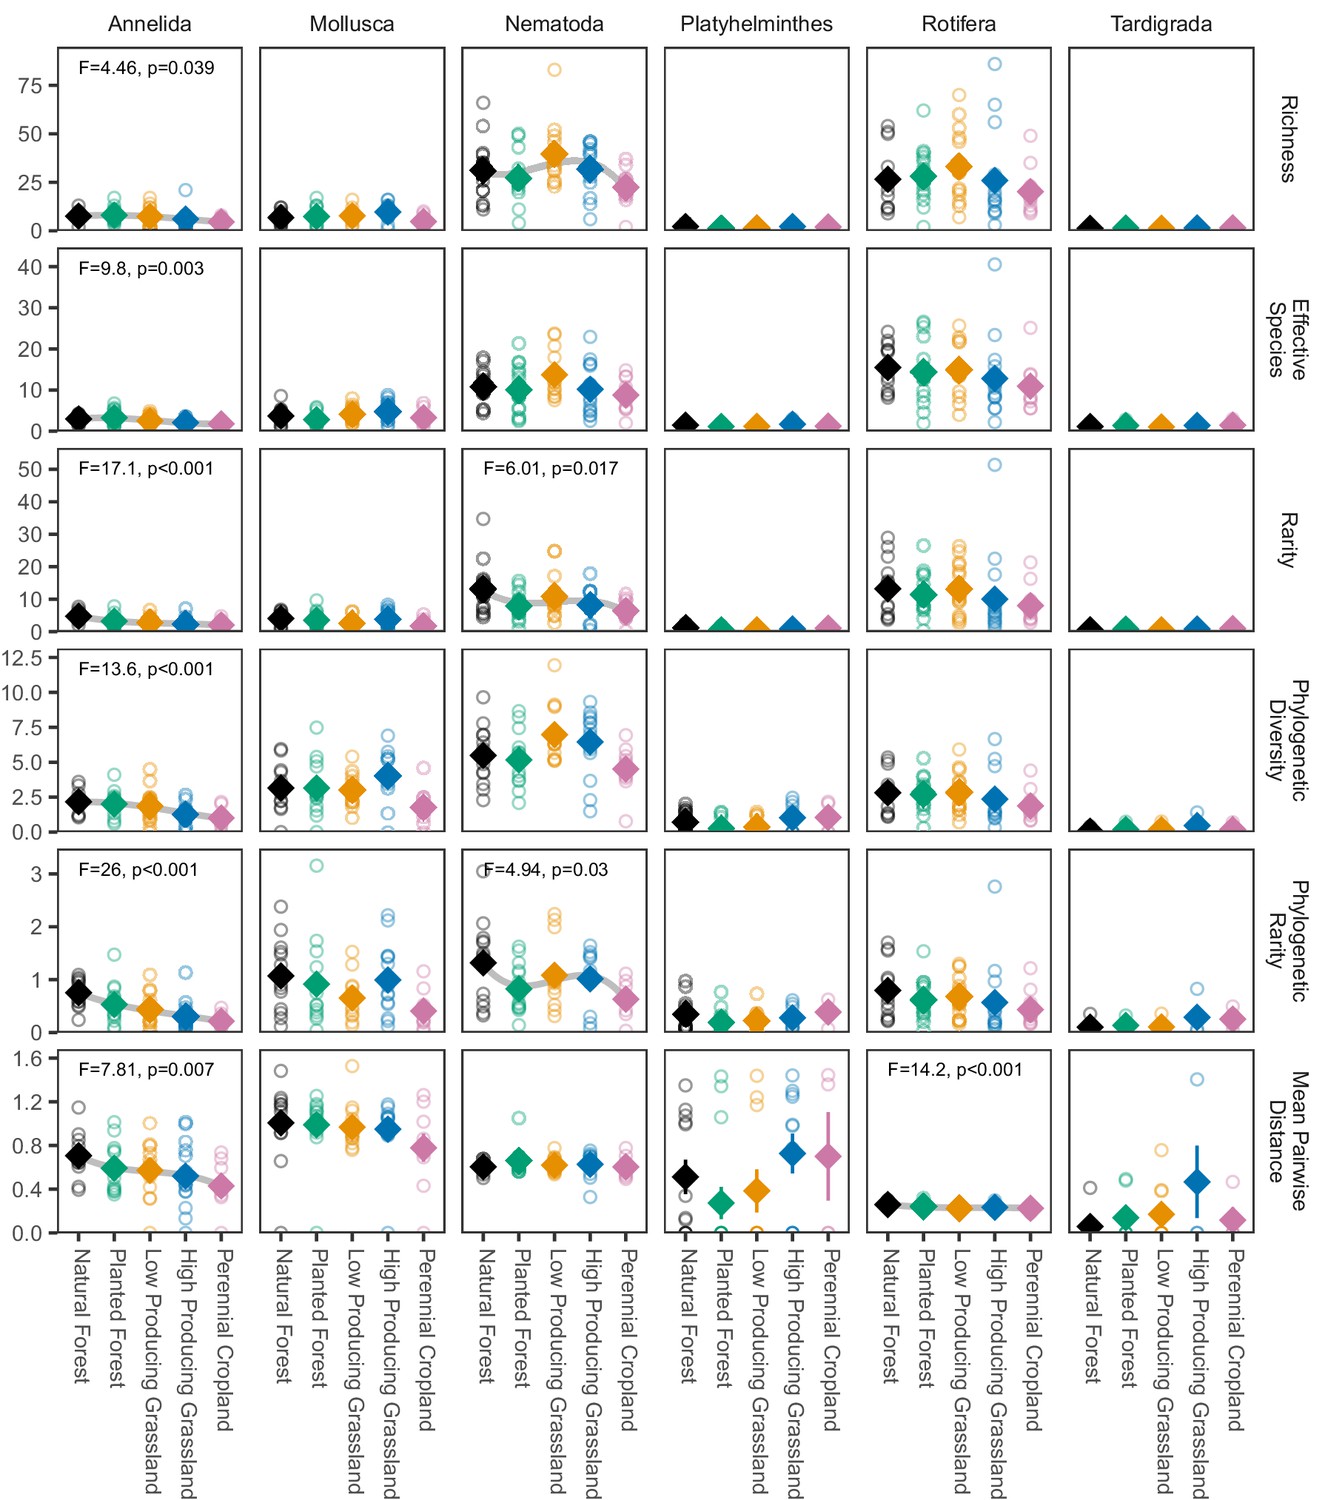
Biodiversity estimates for non-arthropod soil invertebrate phyla in different land-use categories.
The biodiversity of most non-arthropod soil invertebrate phyla detected by DNA metabarcoding tends to decline from natural forest to agricultural sites, although less clearly than for arthropod groups. Diamonds and whiskers represent mean values ± standard errors, with individual data points represented by circles. ANOVA test statistics and trend splines are shown for cases with statistically significant biodiversity differences among land-use categories, with letters indicating differences between land-use categories detected by post-hoc Tukey HSD tests.
Figure 4 with 2 supplements
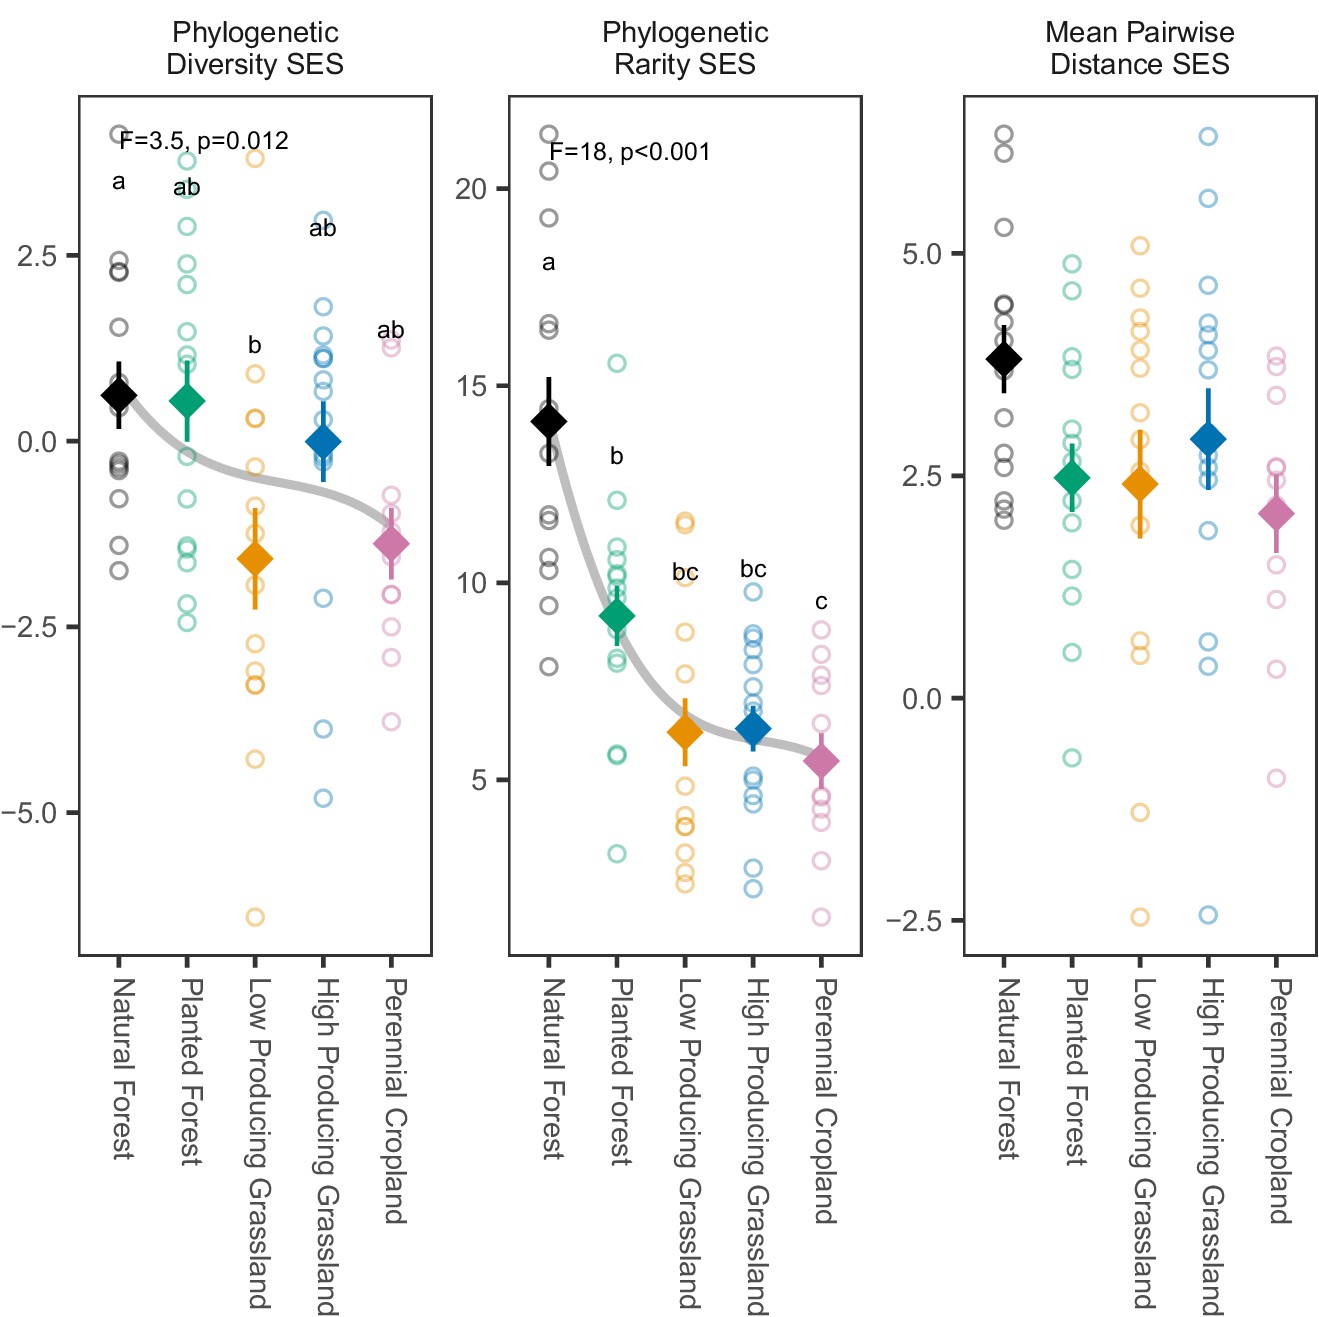
Phylogenetic biodiversity SES estimates for overall soil invertebrate communities detected in different land-use categories.
Phylogenetic biodiversity SES estimates for soil invertebrate communities detected by DNA metabarcoding tend to decline from natural forest to agricultural sites, with the clearest decline shown by phylogenetic rarity SES. Diamonds and whiskers represent mean values ± standard errors, with individual data points represented by circles. ANOVA test statistics and trend splines are shown for cases with statistically significant biodiversity differences among land-use categories, with letters indicating differences between land-use categories detected by post-hoc Tukey HSD tests.
-
Figure 4—source data 1
Results of ANOVA tests for differing soil invertebrate biodiversity between different land-use categories, according to three phylogenetic biodiversity SES metrics.
- https://cdn.elifesciences.org/articles/52787/elife-52787-fig4-data1-v1.docx
Figure 4—figure supplement 1
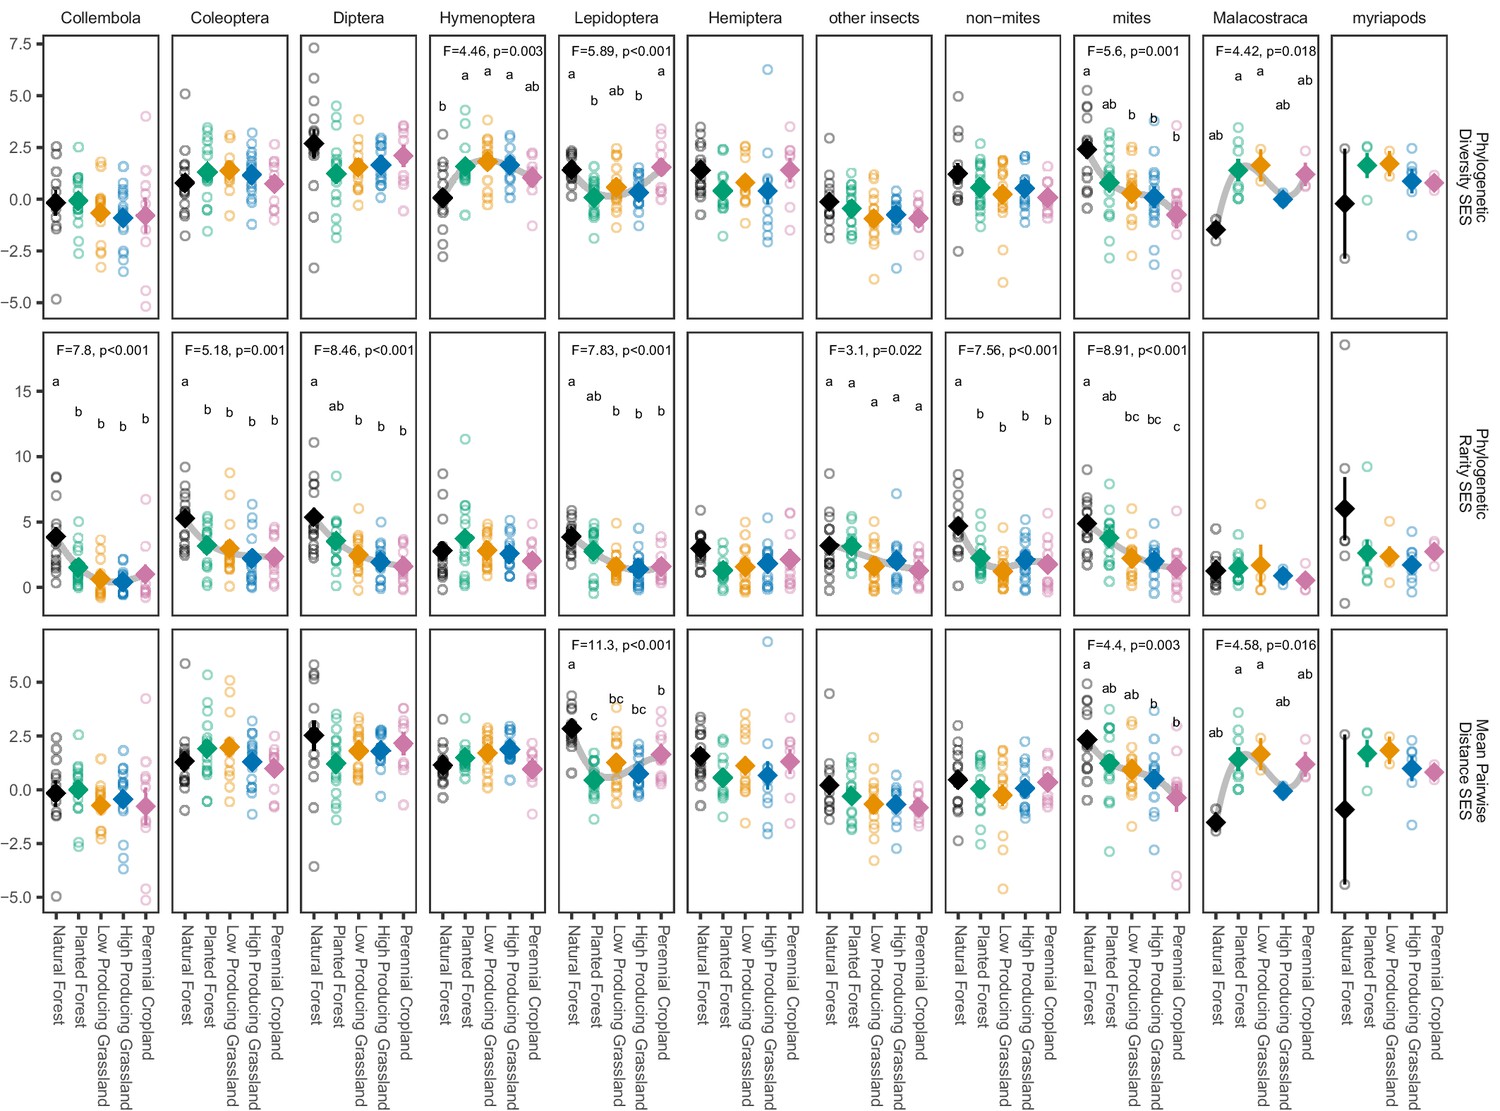
Phylogenetic biodiversity SES estimates for soil arthropod groups detected in different land-use categories.
Phylogenetic endemism SES of soil arthropod groups detected by DNA metabarcoding consistently declines from natural forest to agricultural sites, but phylogenetic diversity SES and mean pairwise distance SES do not. ‘Non-mites’ consist of Araneae, Opiliones, and Pseudoscorpiones. ‘Other insects’ consists of all insect orders other than Coleoptera, Diptera, Hemiptera, Hymenoptera, and Lepidoptera. Diamonds and whiskers represent mean values ± standard errors, with individual data points represented by circles. ANOVA test statistics and trend splines are shown for cases with statistically significant biodiversity differences among land-use categories, with letters indicating differences between land-use categories detected by post-hoc Tukey HSD tests.
Figure 4—figure supplement 2
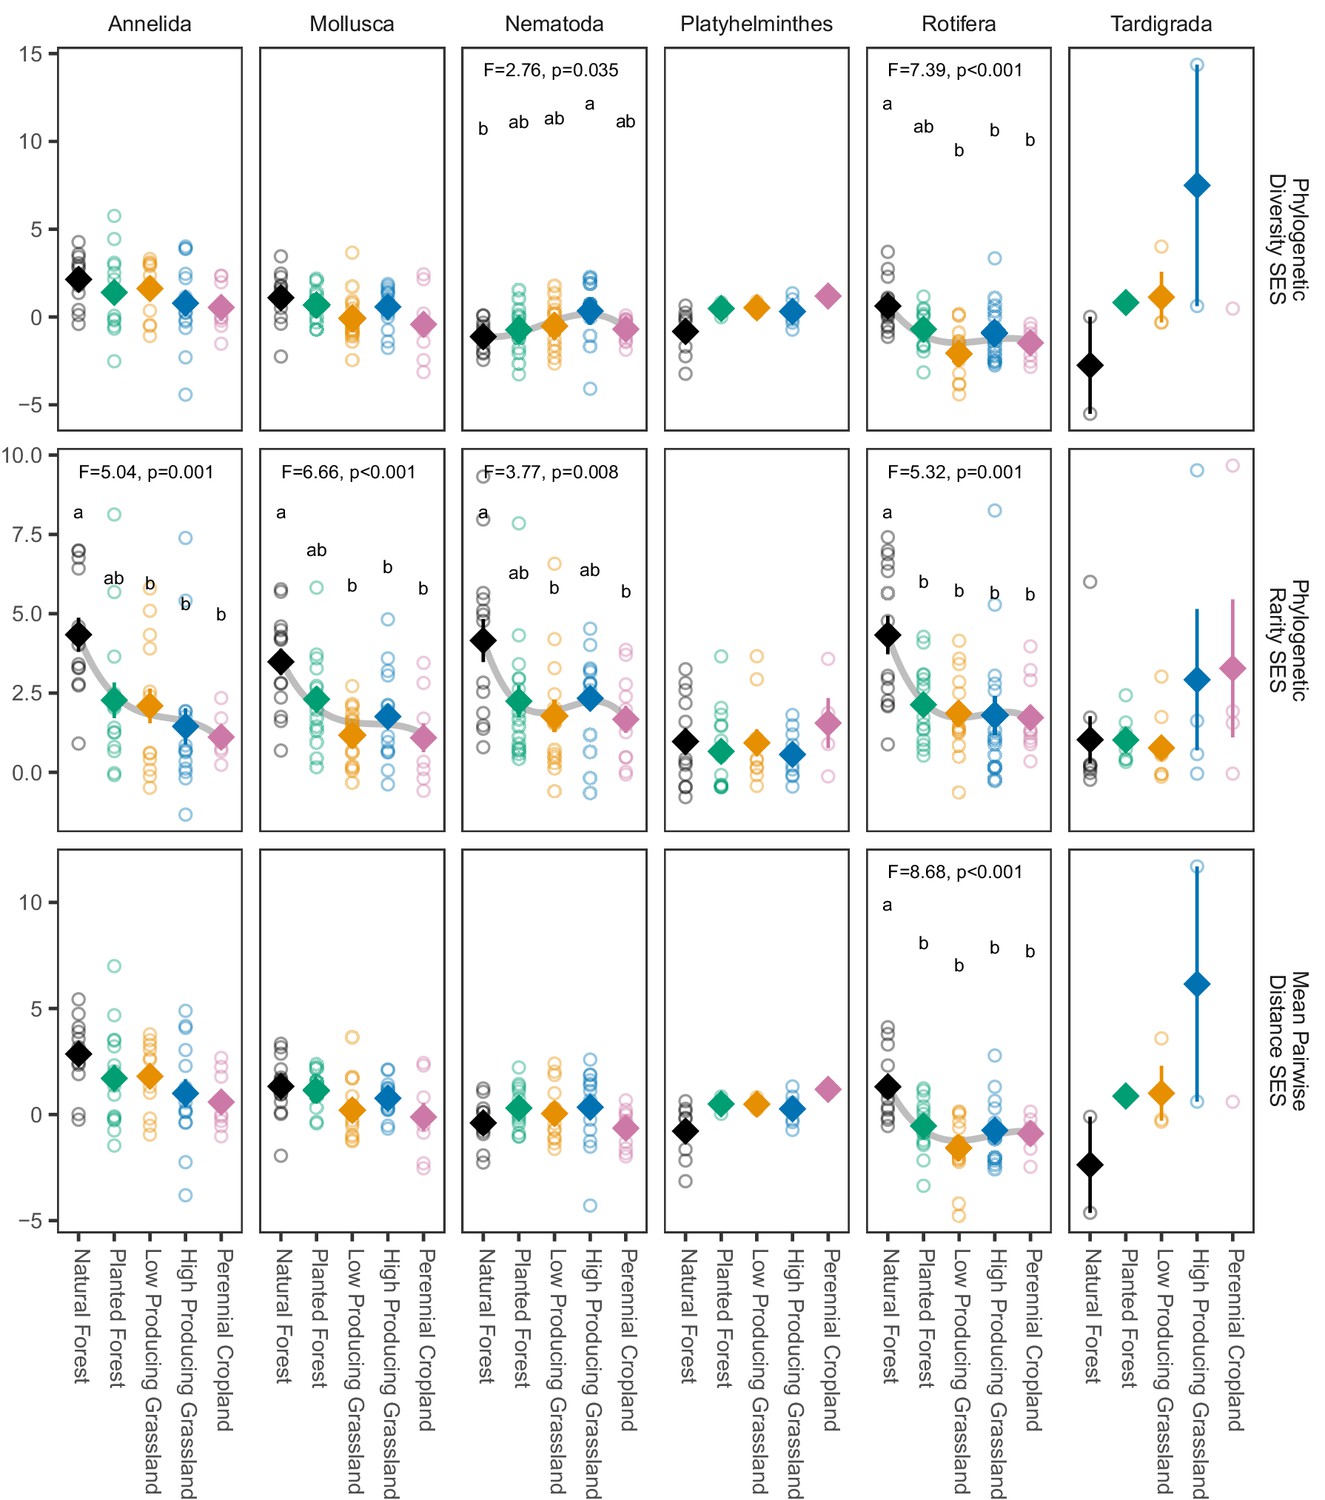
Phylogenetic biodiversity standard effect size (SES) estimates for non-arthropod soil invertebrate phyla detected in different land-use categories.
Phylogenetic endemism SES of most non-arthropod soil invertebrate phyla detected by DNA metabarcoding declines from natural forest to agricultural sites, but phylogenetic diversity SES and mean pairwise distance SES do not. Diamonds and whiskers represent mean values ± standard errors, with individual data points represented by circles. ANOVA test statistics and trend splines are shown for cases with statistically significant biodiversity differences among land-use categories, with letters indicating differences between land-use categories detected by post-hoc Tukey HSD tests.
Figure 5
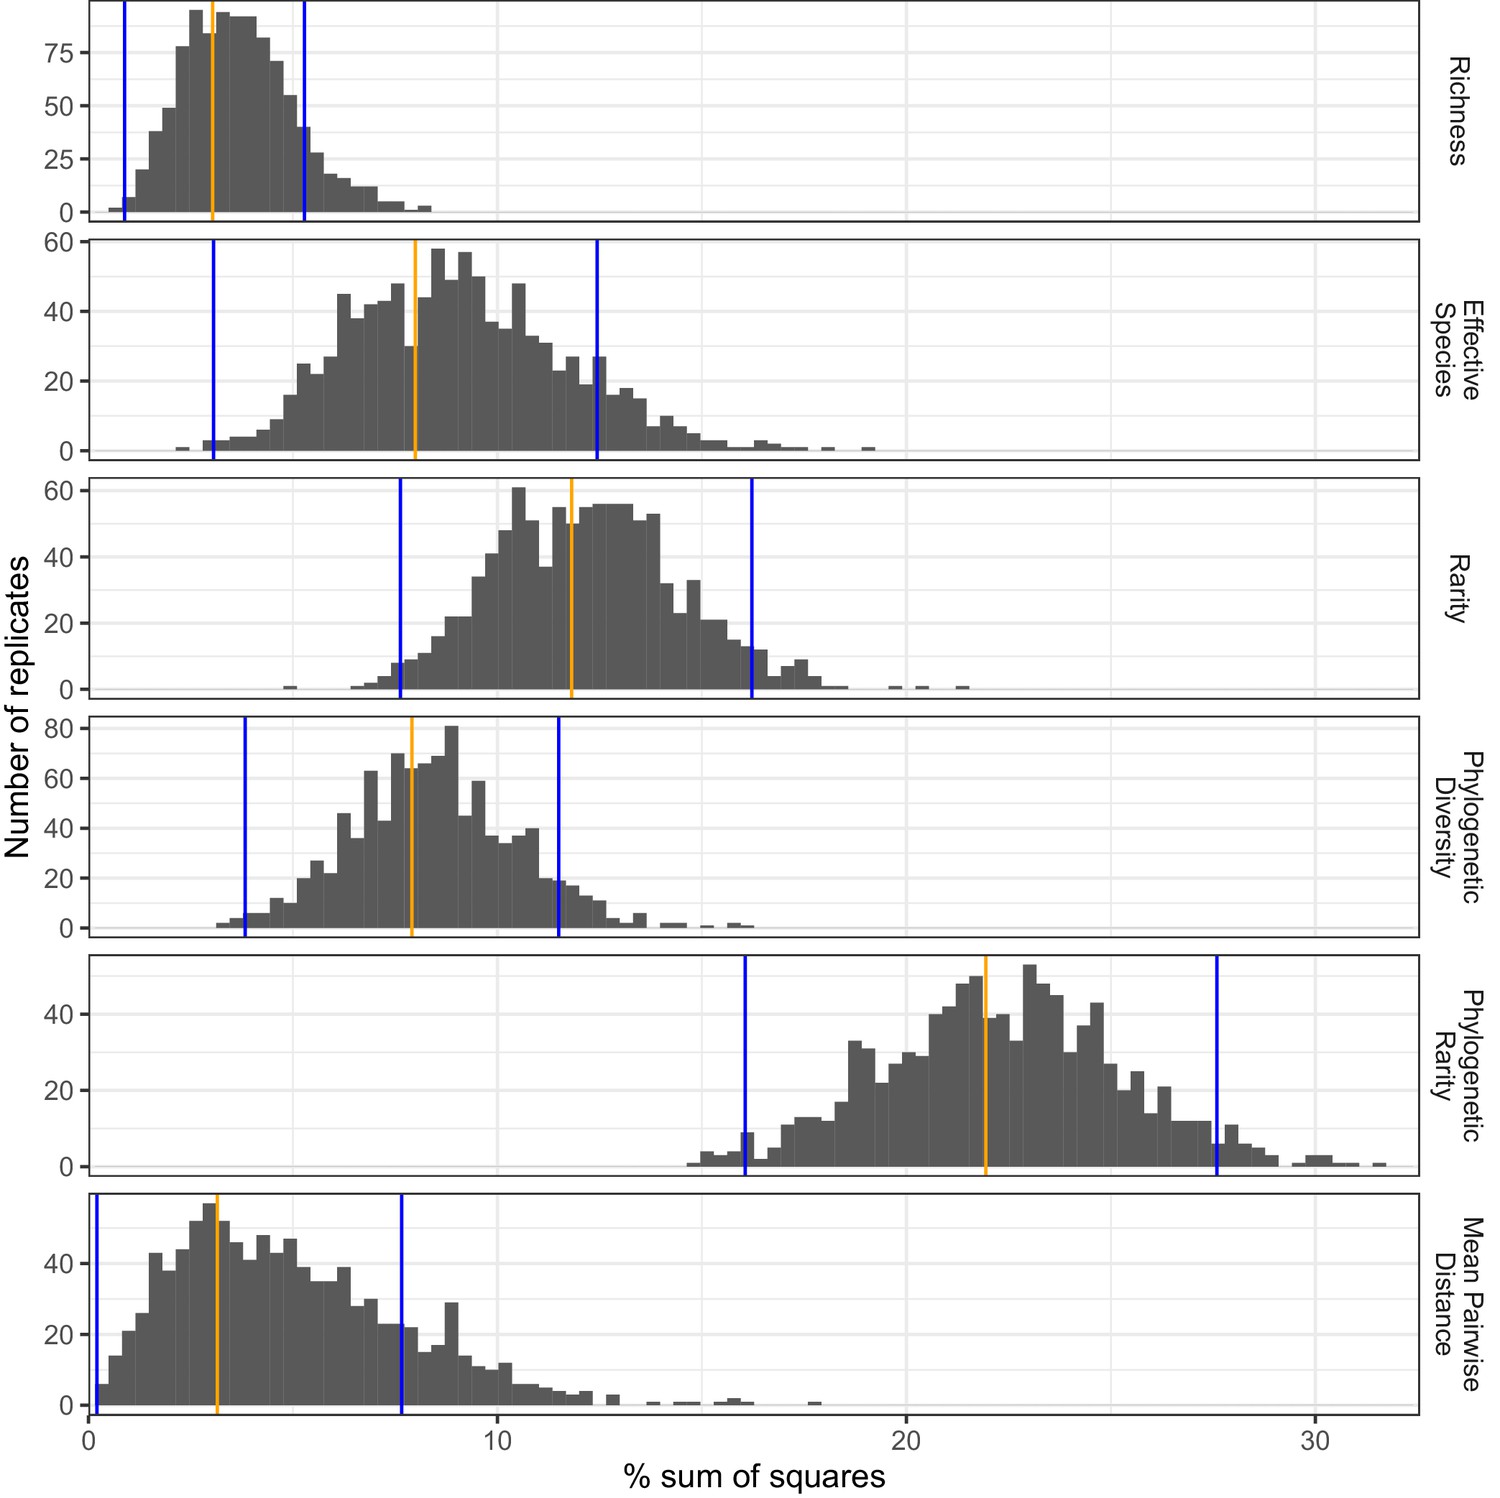
Proportions of sample variance explained by land use according to different biodiversity metrics.
The proportions of sample variation (sum of squares) explained by land use were estimated for different biodiversity metrics by non-parametric bootstrapping, based on the combinations of biodiversity metric and soil invertebrate taxonomic group for which significant land-use differences were detected by ANOVA tests. Observed mean values and 95% confidence interval limits are indicated by orange and blue vertical bars, respectively.
Figure 6
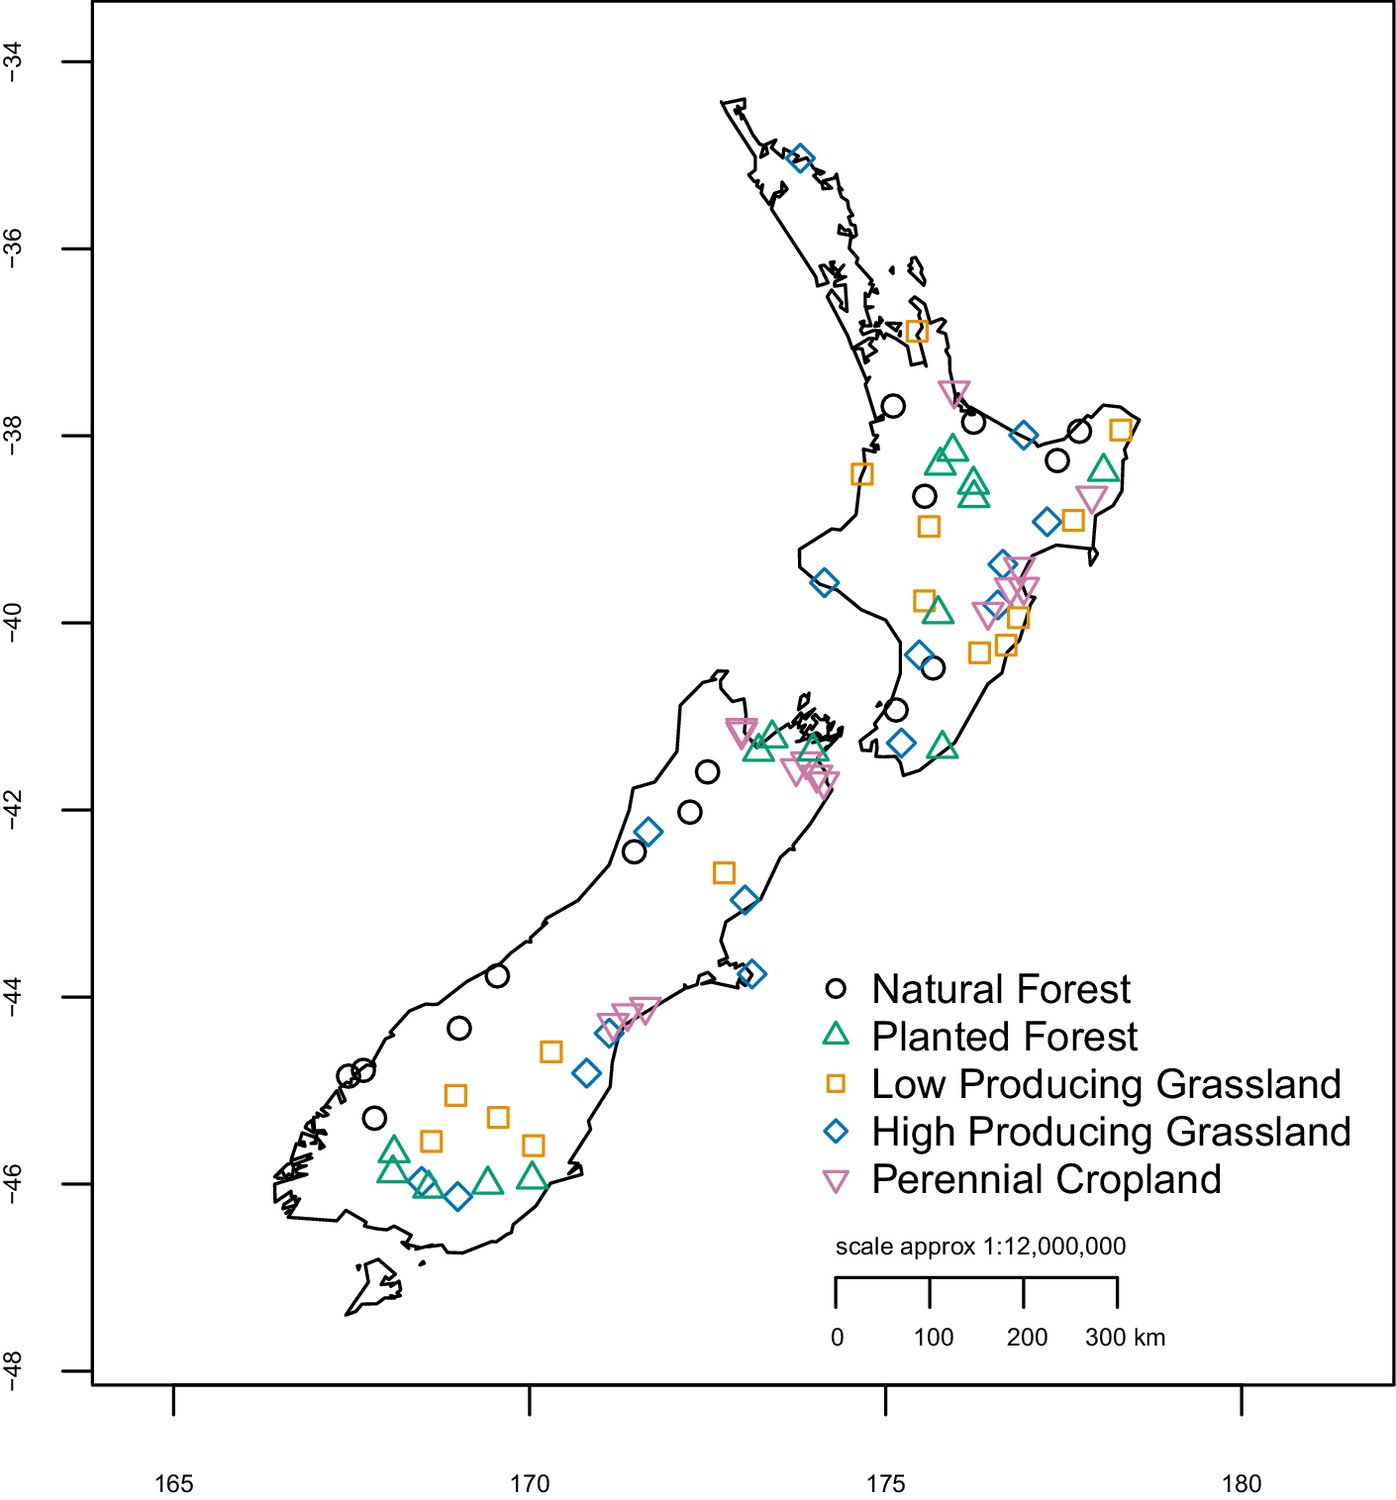
Location and land-use category of 75 sample sites.
Site locations were randomly selected from a nationwide 8 km grid used for regular monitoring of native species and pests, excluding any that were >1000 m altitude and ensuring they were distributed throughout New Zealand. X- and y-axes represent longitude and latitude, respectively.
-
Figure 6—source data 1
Defining attributes of land-use categories.
- https://cdn.elifesciences.org/articles/52787/elife-52787-fig6-data1-v1.docx
Appendix 1—figure 1
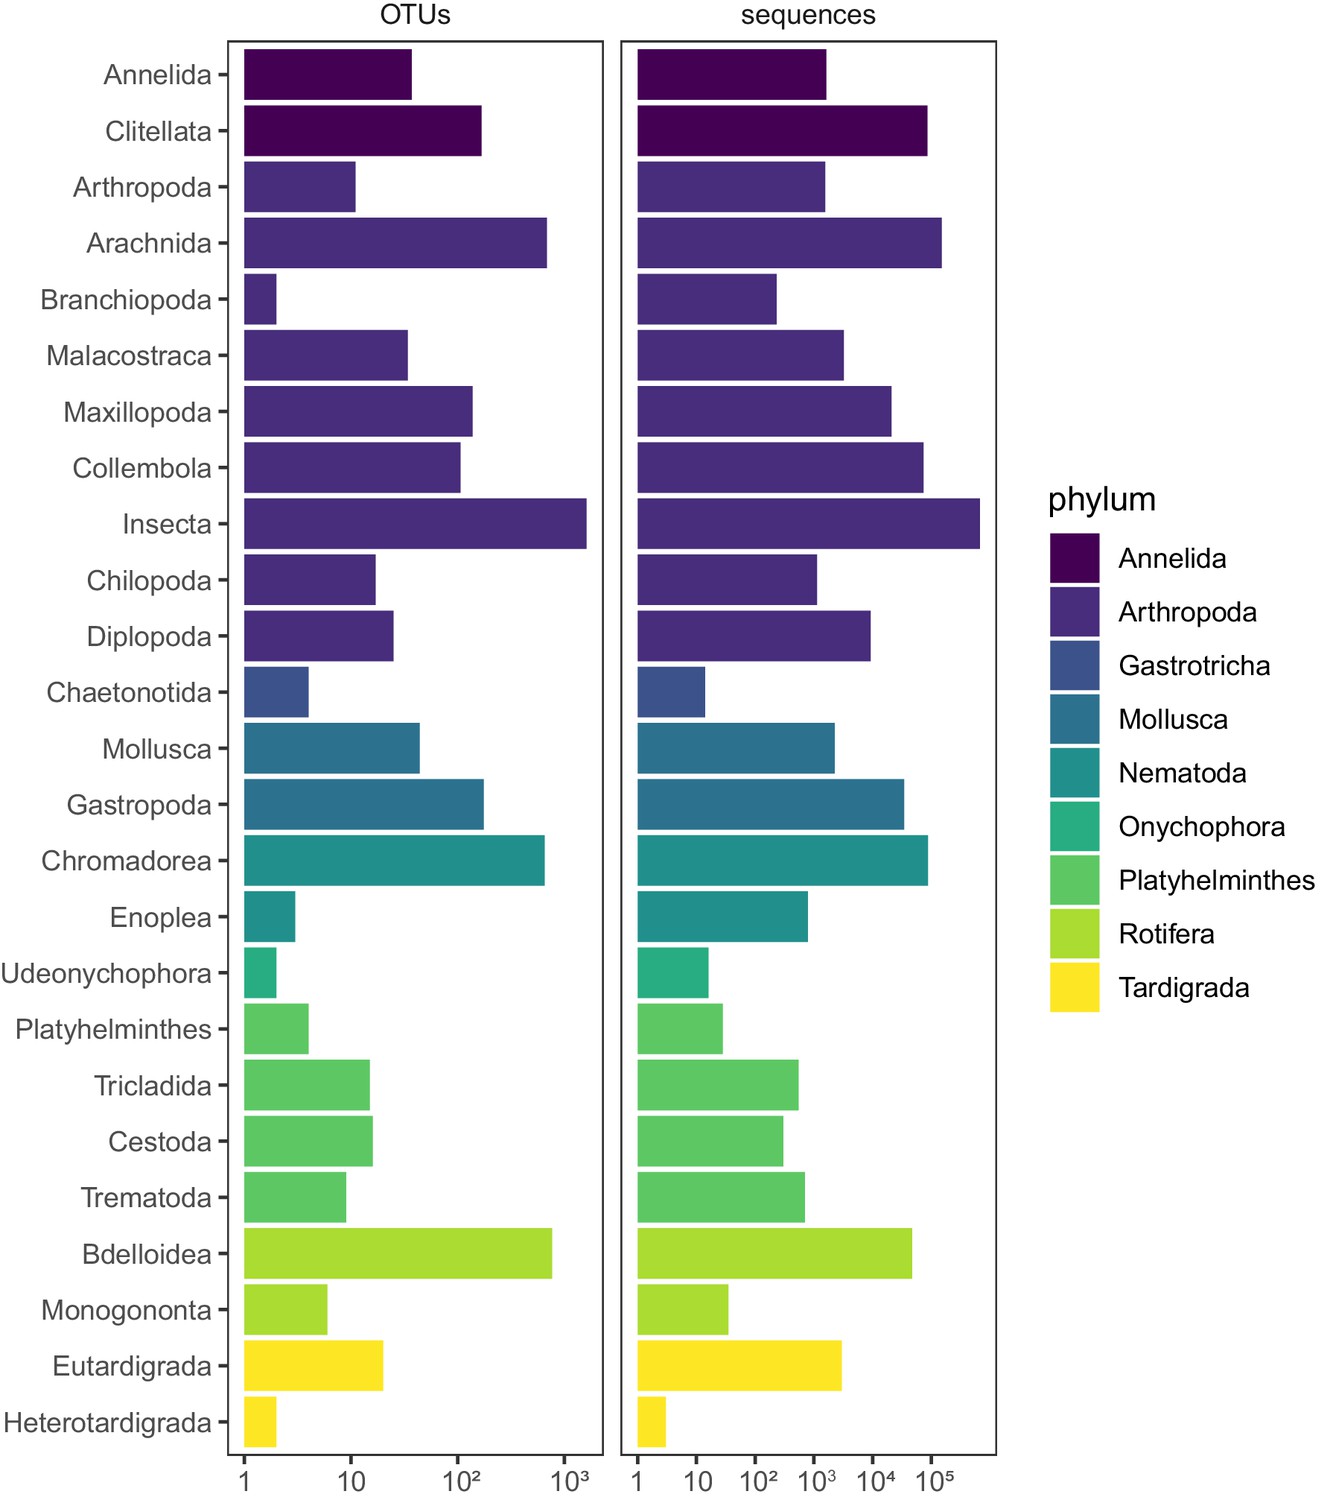
Taxonomic composition of invertebrate OTUs and sequences.
Phylum and class-level taxonomic composition of terrestrial invertebrate OTUs detected in soil samples from 75 sites distributed across five land-use categories.
Appendix 1—figure 2

A phylogeny of terrestrial invertebrate COI OTU sequences detected in soil samples from 75 sites distributed across five land-use categories.
Appendix 1—figure 3
Biodiversity estimates for overall soil invertebrate communities detected in different land-use categories, with species detected in a single site excluded.
Diamonds and whiskers represent mean values ± standard errors, with individual data points represented by circles. ANOVA test statistics and trend splines are shown for cases with statistically significant biodiversity differences among land-use categories, with letters indicating differences between land-use categories detected by post-hoc Tukey HSD tests.
Appendix 1—figure 4
Biodiversity estimates for soil arthropod groups in different land-use categories, with species detected in a single site excluded.
‘Other insects’ consists of all insect orders other than Coleoptera, Diptera, Hemiptera, Hymenoptera, and Lepidoptera. ‘Non-mites’ consist of Araneae, Opiliones, and Pseudoscorpiones. Diamonds and whiskers represent mean values ± standard errors, with individual data points represented by circles. ANOVA test statistics and trend splines are shown for cases with statistically significant biodiversity differences among land-use categories, with letters indicating differences between land-use categories detected by post-hoc Tukey HSD tests.
Appendix 1—figure 5
Biodiversity estimates for non-arthropod soil invertebrate phyla in different land-use categories, with species detected in a single site excluded.
Diamonds and whiskers represent mean values ± standard errors, with individual data points represented by circles. ANOVA test statistics and trend splines are shown for cases with statistically significant biodiversity differences among land-use categories, with letters indicating differences between land-use categories detected by post-hoc Tukey HSD tests.
Appendix 1—figure 6

Patterns of environmental variables across five land-use categories.
Appendix 1—figure 7
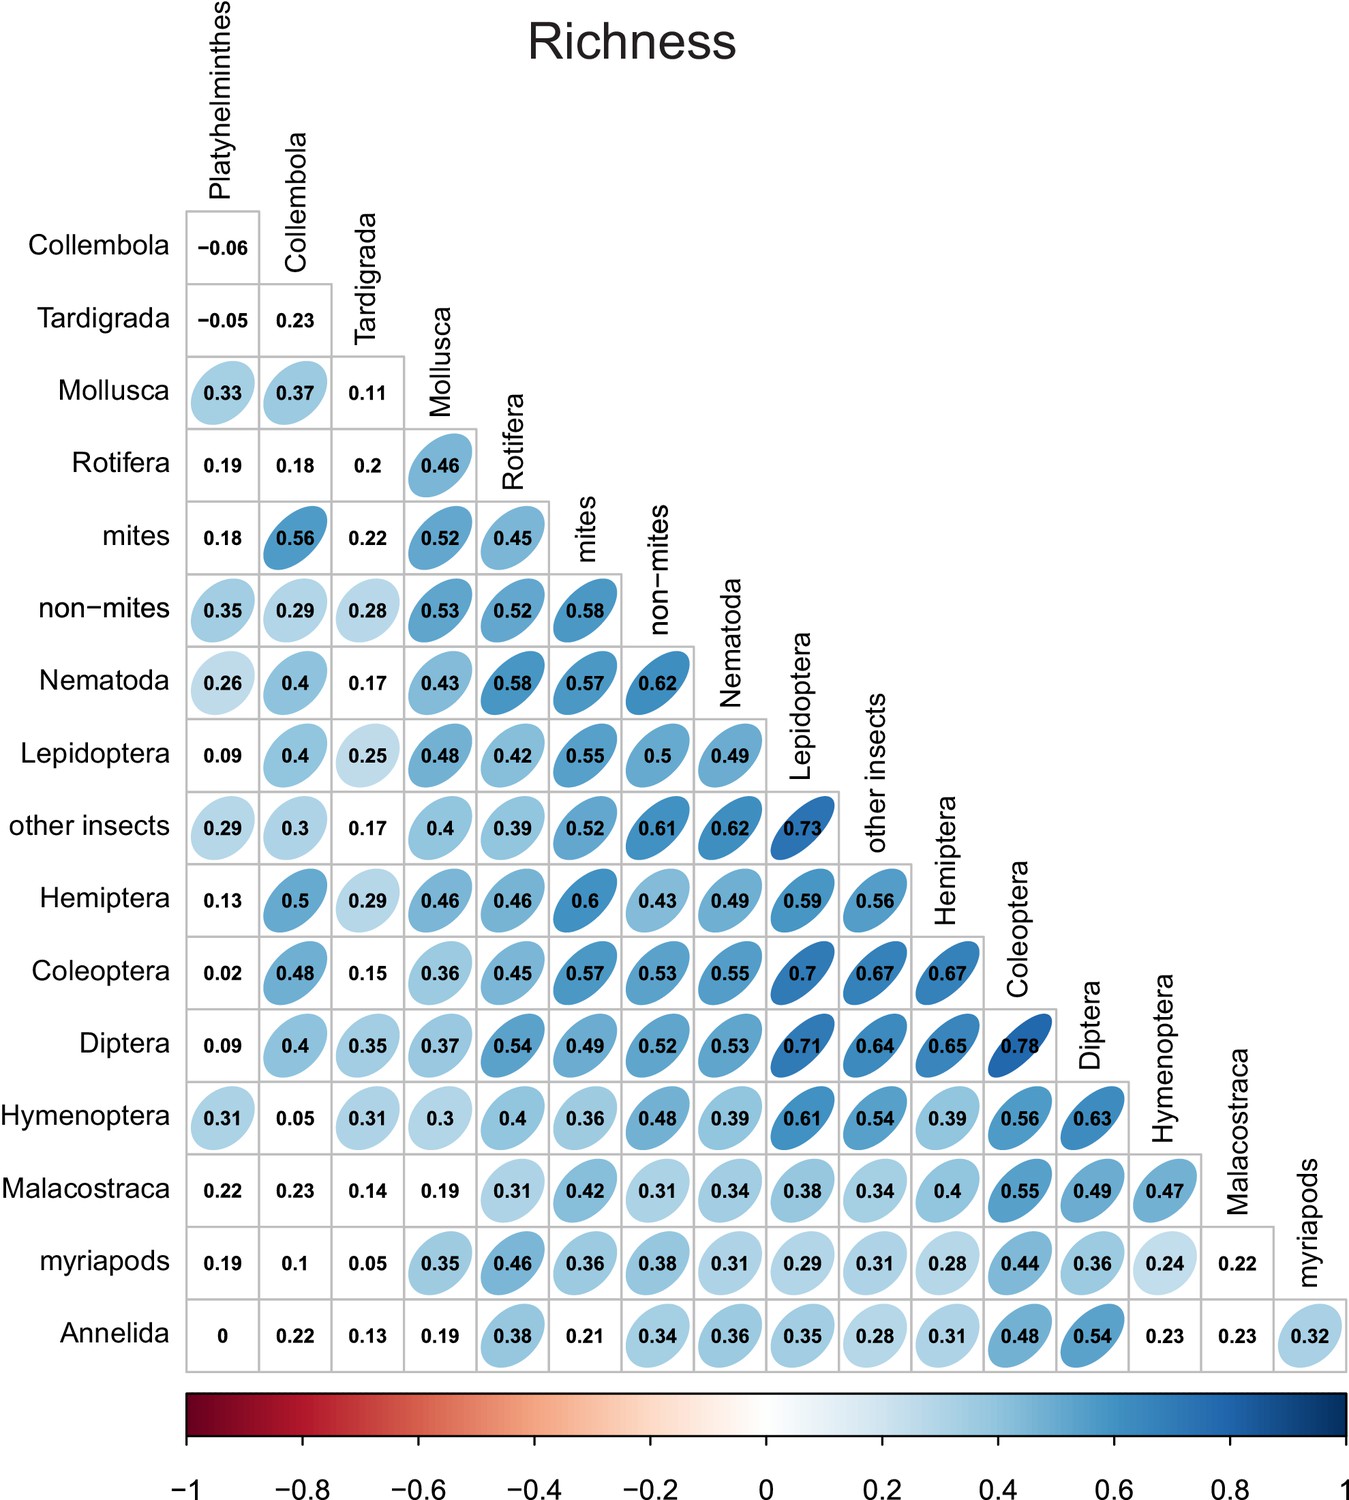
Richness correlations between different taxonomic groups.
Numbers indicate Pearson correlation coefficients. Ellipse shape and colour represent the magnitude of correlations with p-values≤0.05.
Appendix 1—figure 8
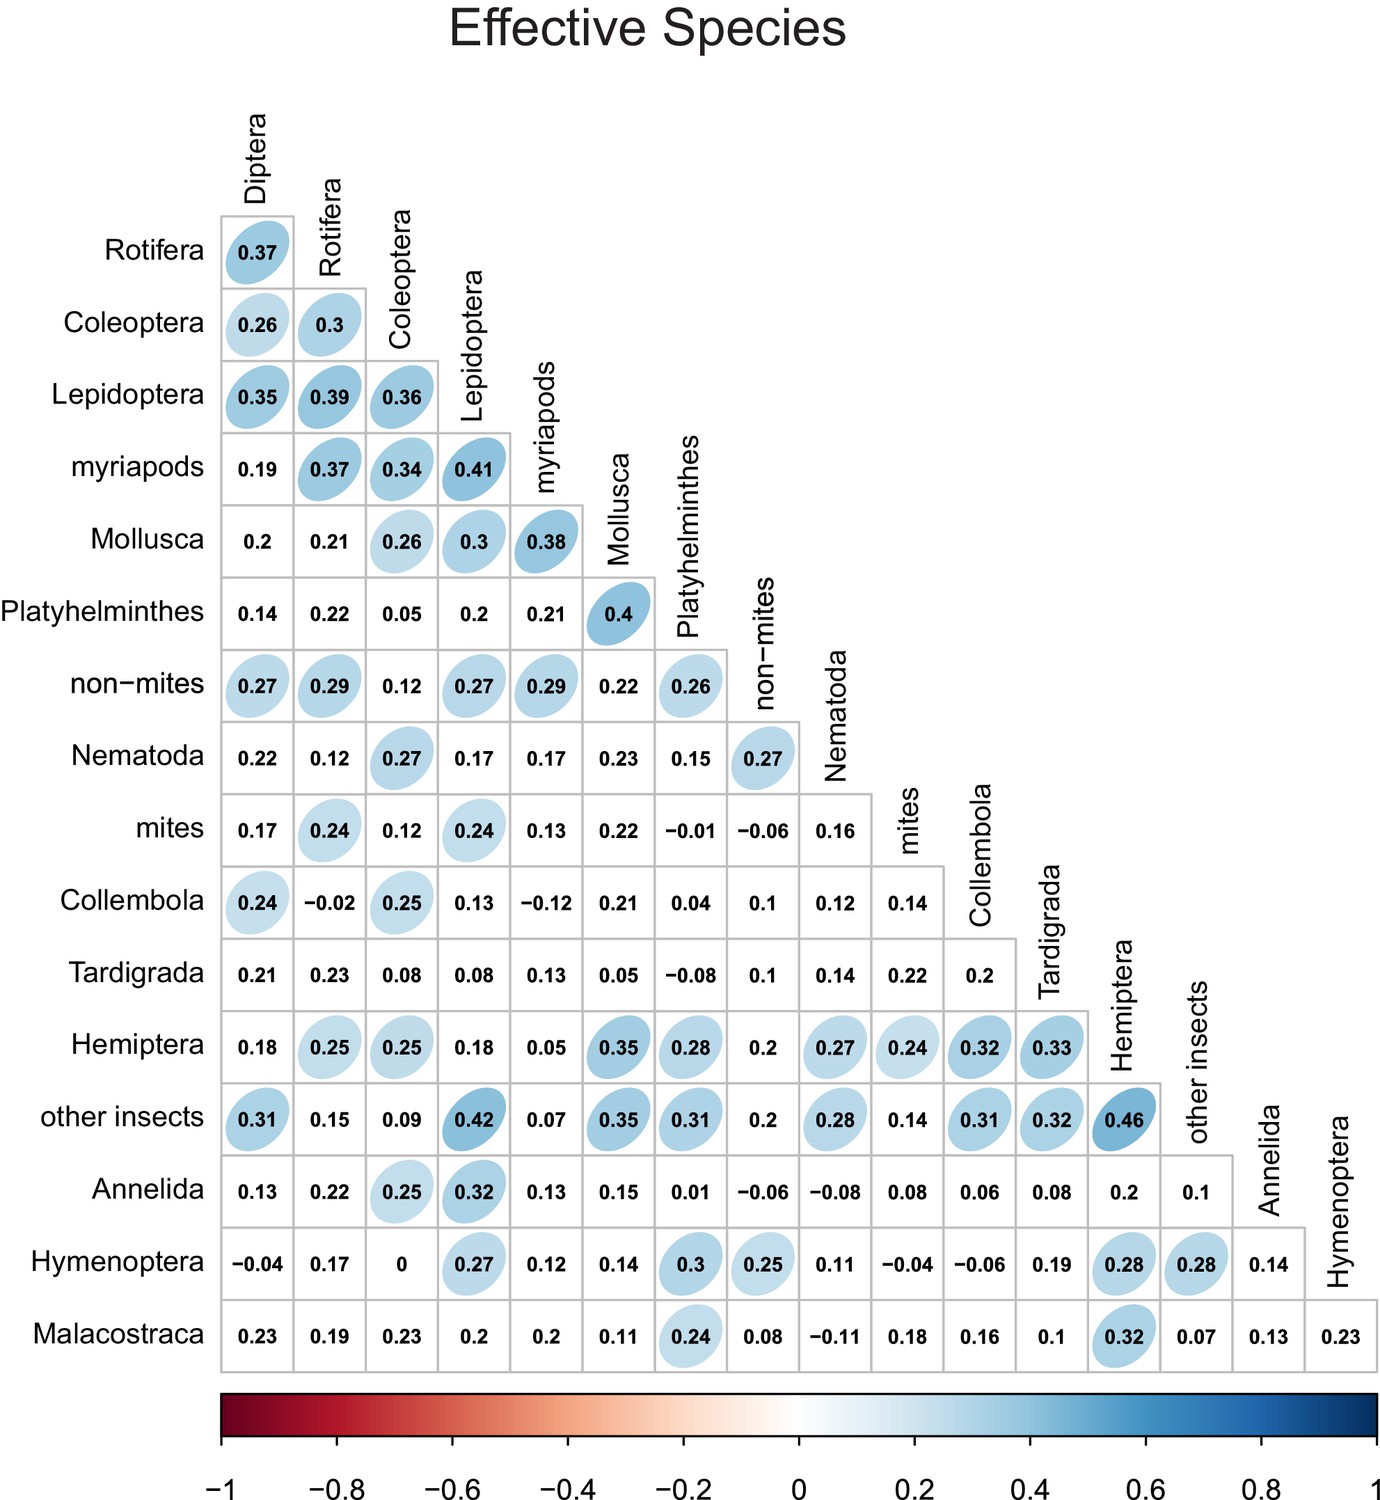
Effective species number correlations between different taxonomic groups.
Numbers indicate Pearson correlation coefficients. Ellipse shape and colour represent the magnitude of correlations with p-values≤0.05.
Appendix 1—figure 9
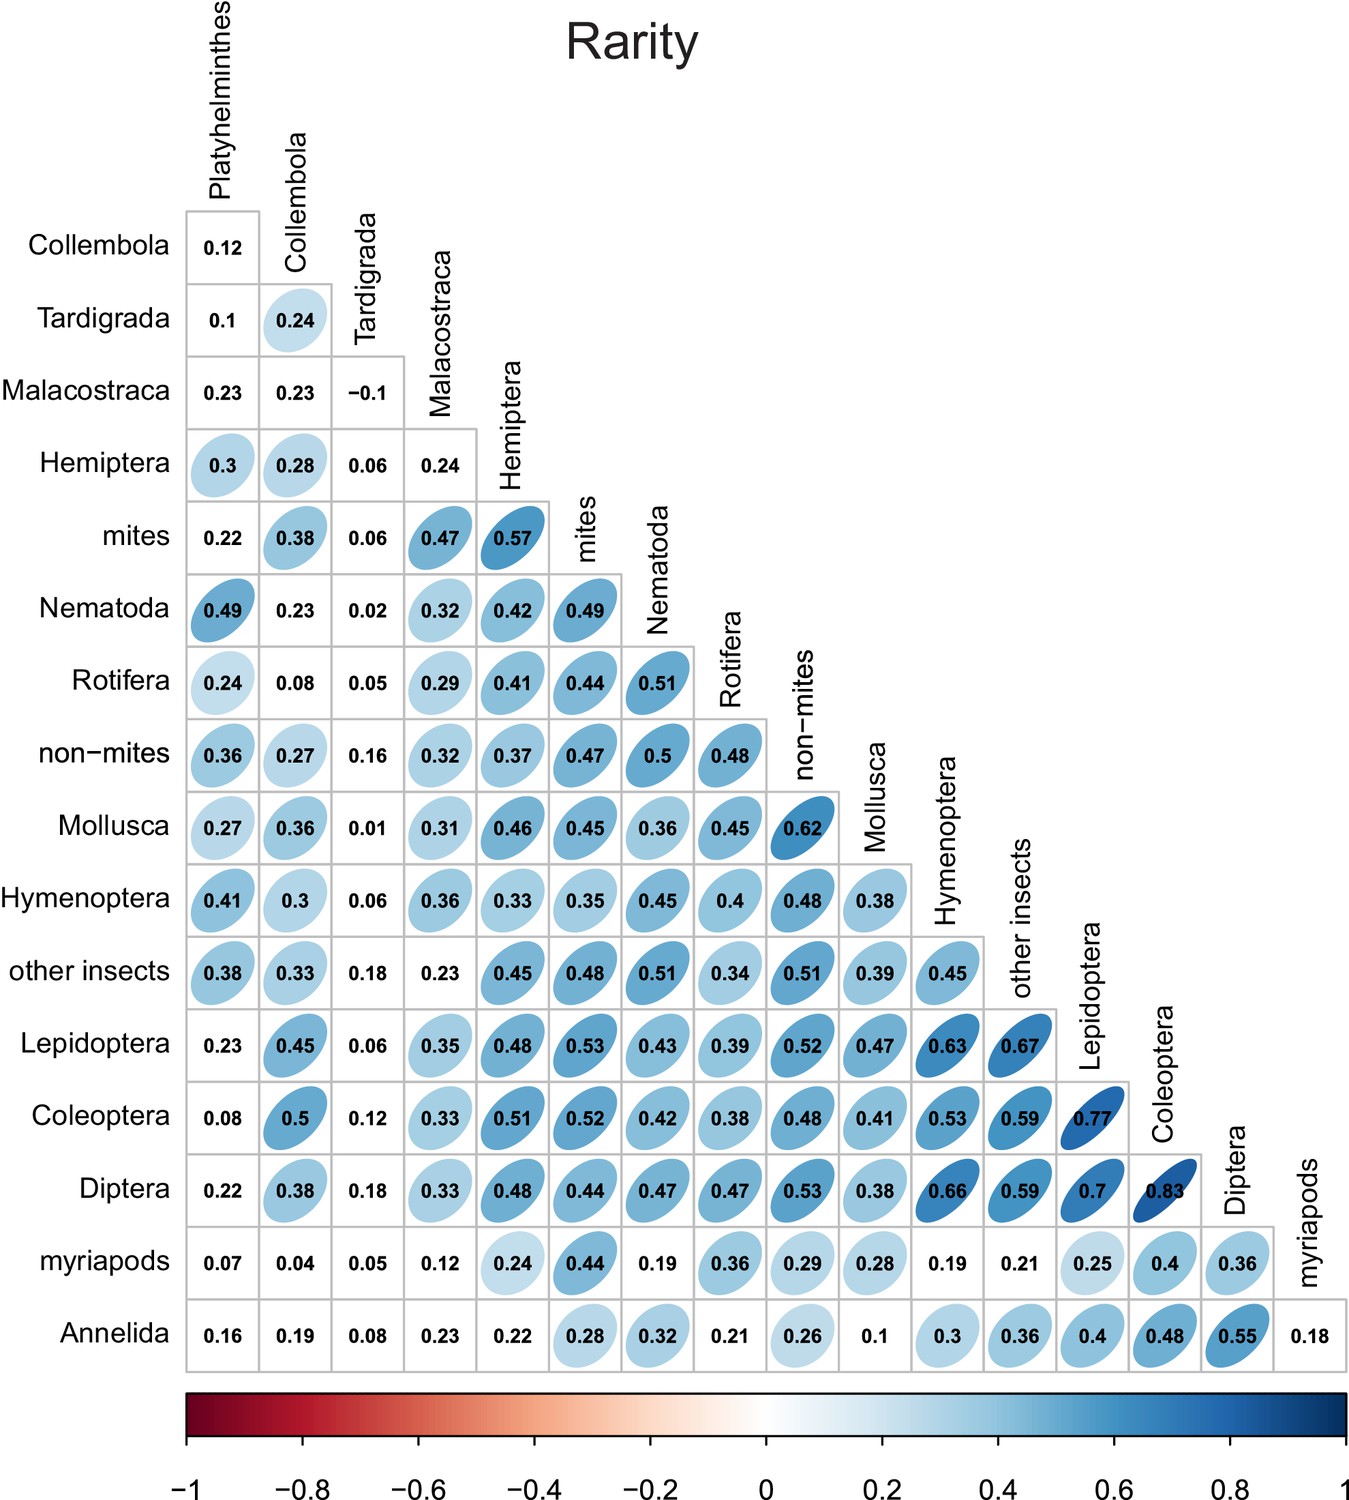
Rarity correlations between different taxonomic groups.
Numbers indicate Pearson correlation coefficients. Ellipse shape and colour represent the magnitude of correlations with p-values≤0.05.
Appendix 1—figure 10
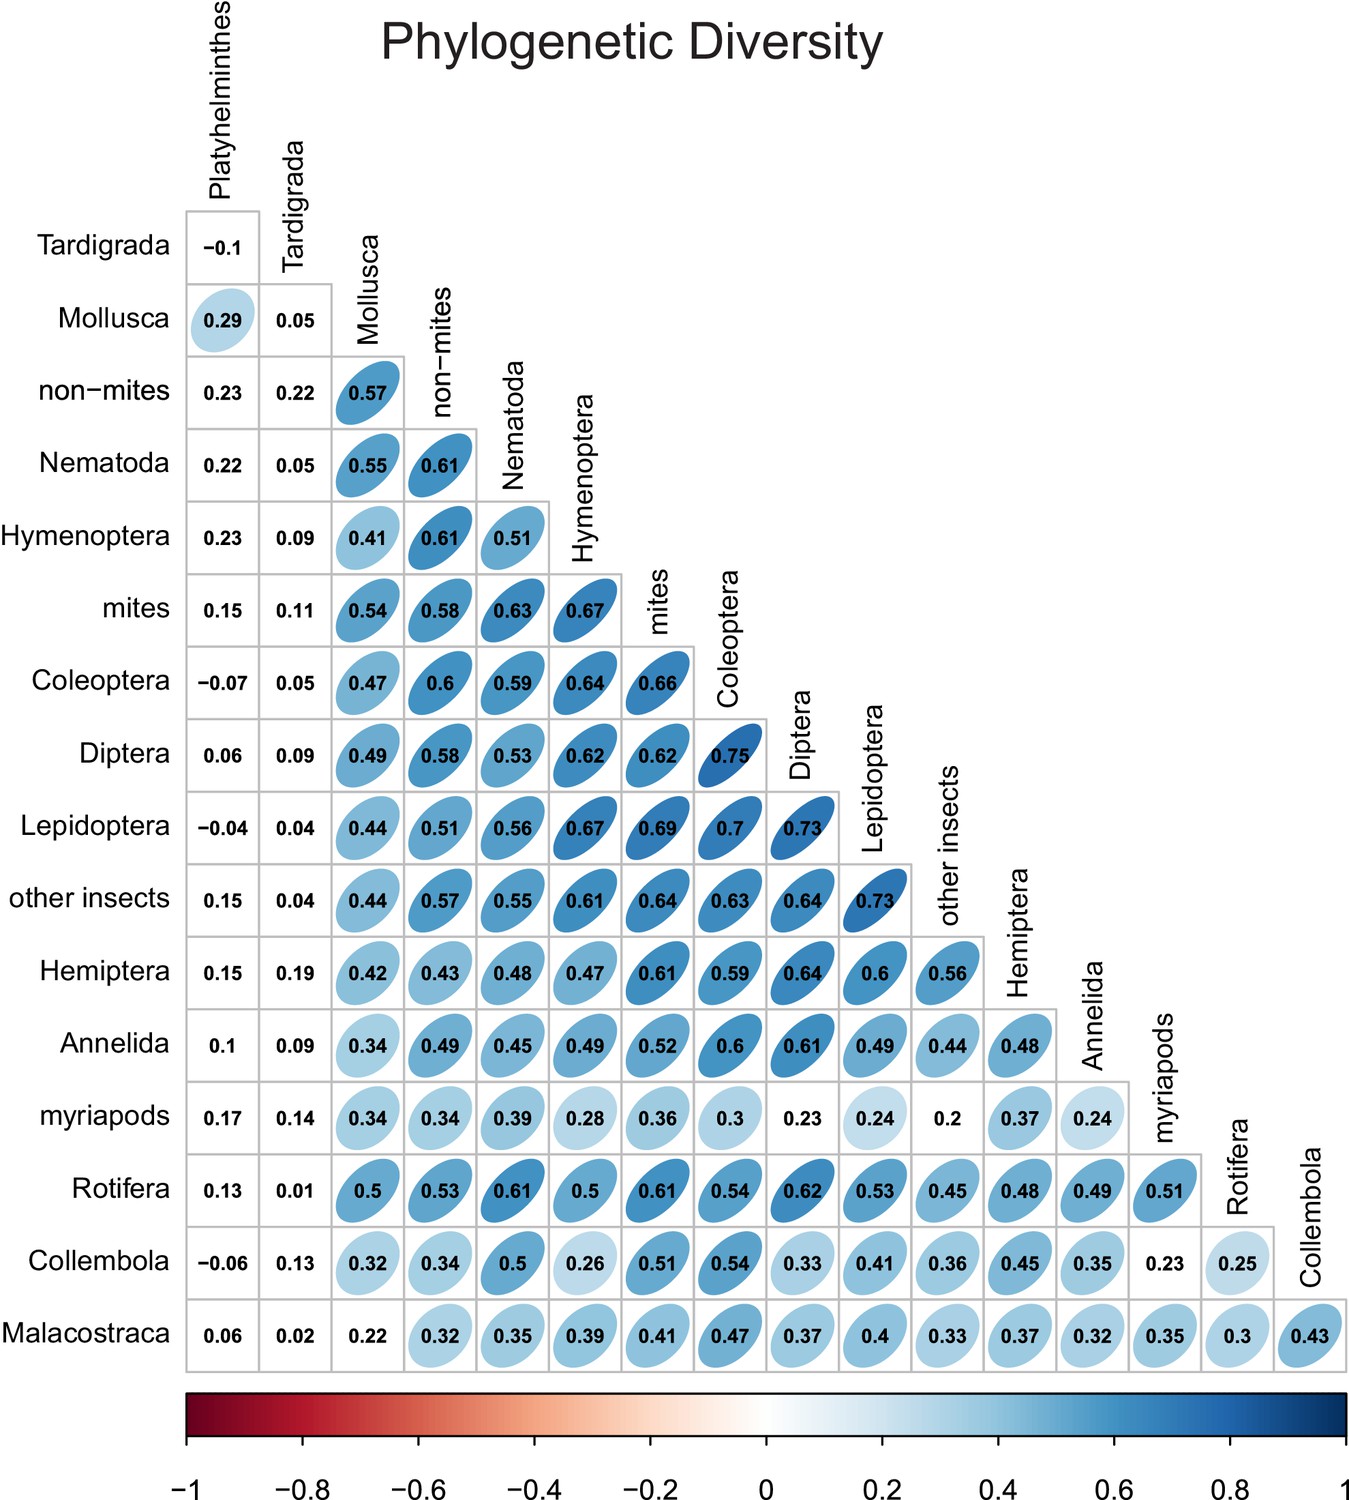
Phylogenetic diversity correlations between different taxonomic groups.
Numbers indicate Pearson correlation coefficients. Ellipse shape and colour represent the magnitude of correlations with p-values≤0.05.
Appendix 1—figure 11
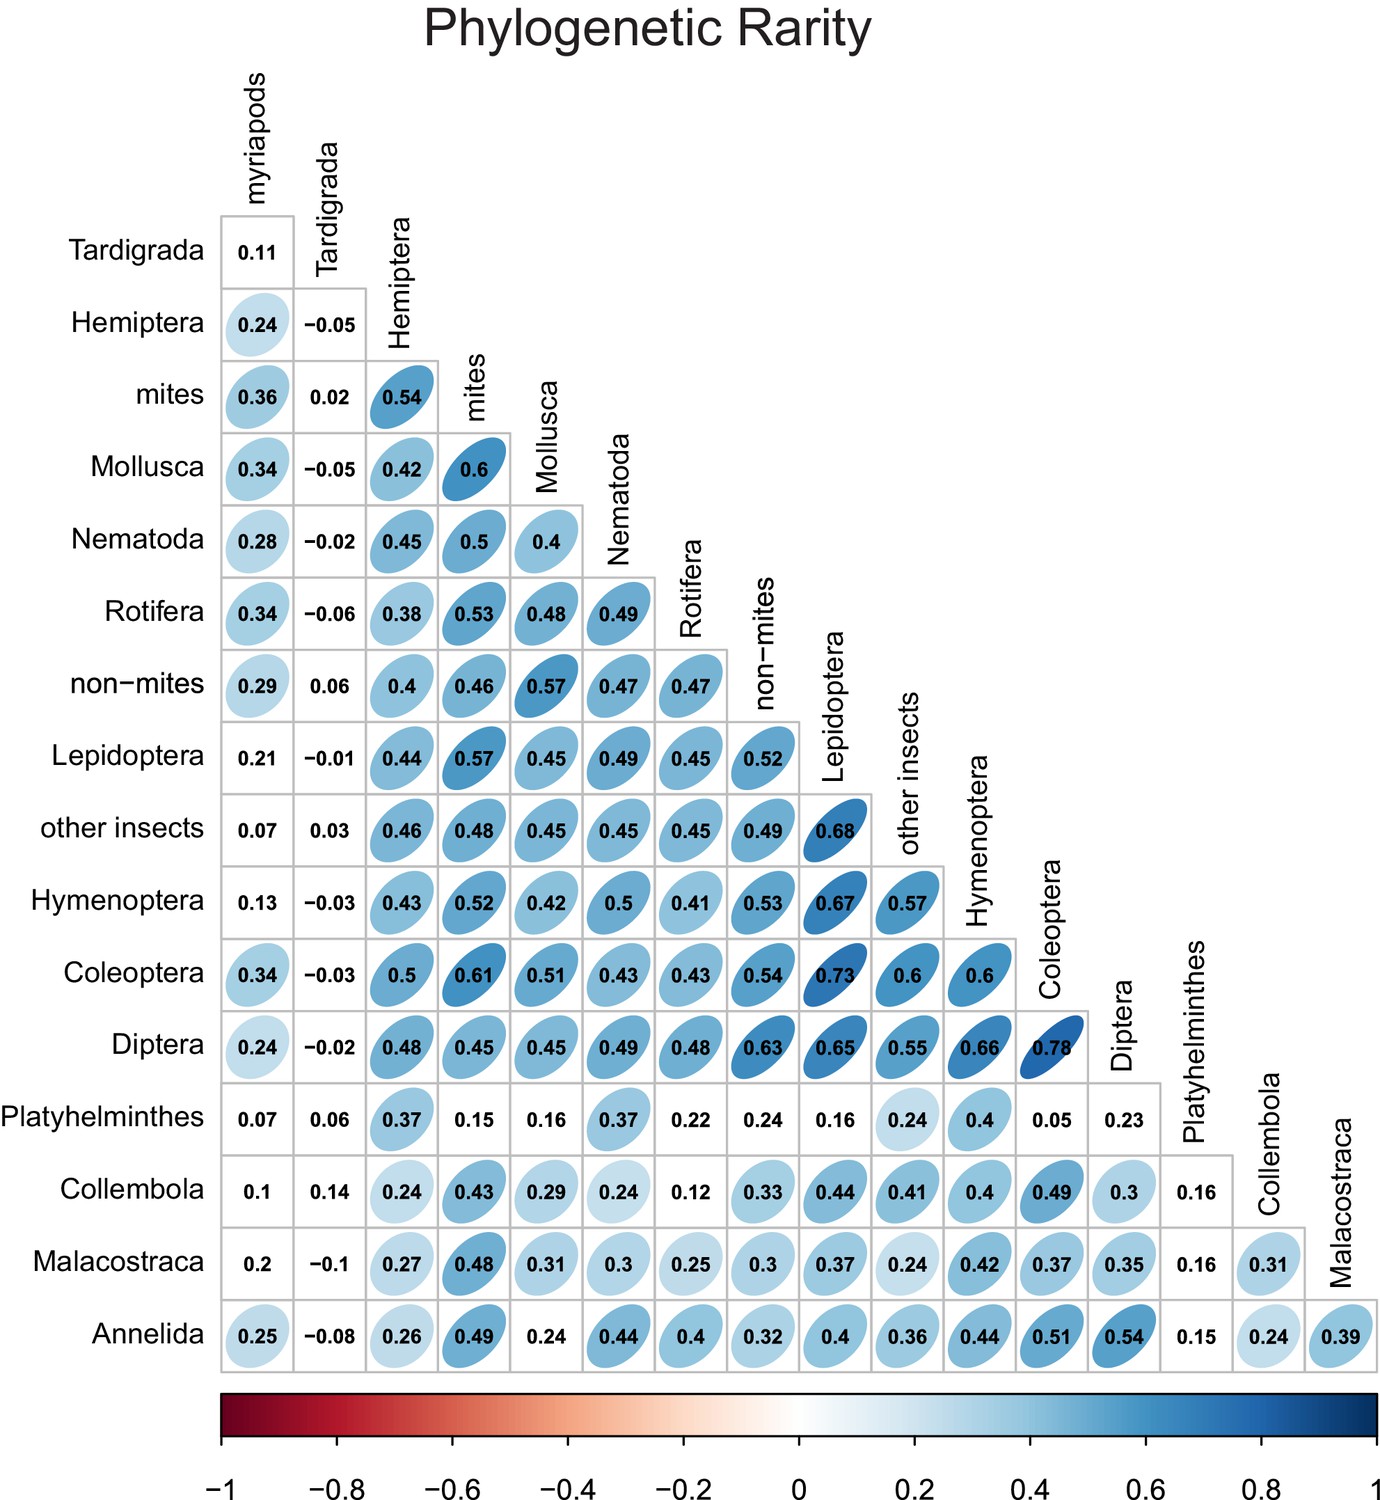
Phylogenetic rarity correlations between different taxonomic groups.
Numbers indicate Pearson correlation coefficients. Ellipse shape and colour represent the magnitude of correlations with p-values≤0.05.
Appendix 1—figure 12
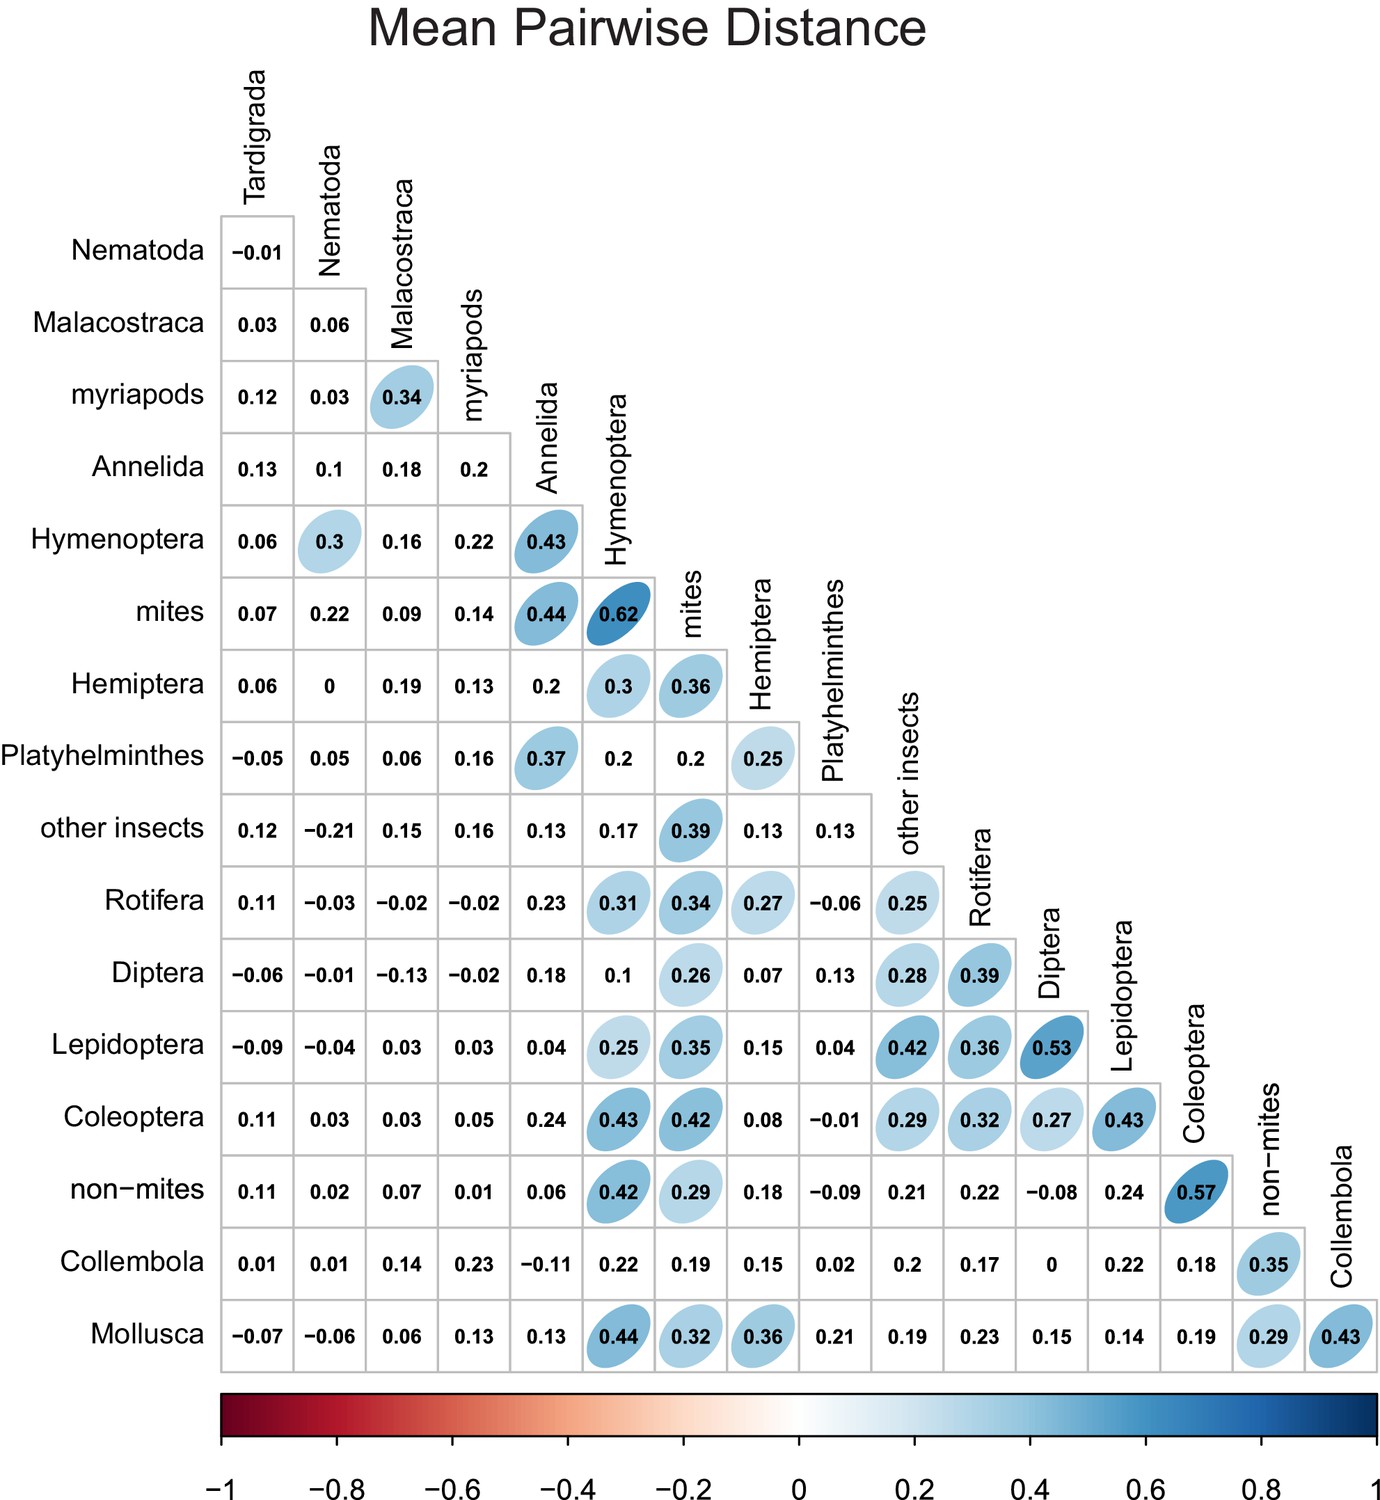
Mean pairwise distance correlations between different taxonomic groups.
Numbers indicate Pearson correlation coefficients. Ellipse shape and colour represent the magnitude of correlations with p-values≤0.05.
Tables
Key resources table
| Reagent type (species) or resource | Designation | Source or reference | Identifiers | Additional information |
|---|---|---|---|---|
| Sequence-based reagent | mICOIintF | DOI:10.1186/1742-9994-10-34 | GGWACWGGWTGAACWGTWTAYCCYCC | |
| Sequence-based reagent | HCO2198 | PMID:7881515 | TAAACTTCAGGGTGACCAAAAAATCA | |
| Commercial assay or kit | NucleoSpin Tissue kit | Macherey-Nagel | 740741.4 | |
| Software, algorithm | cutadapt | https://github.com/marcelm/cutadapt | v 1.11 | |
| Software, algorithm | USEARCH | https://www.drive5.com/usearch/ | v 9.0.2132_i86linux32 | |
| Software, algorithm | VSEARCH | https://github.com/torognes/vsearch | v 2.4.0 | |
| Software, algorithm | R | https://www.r-project.org/ | v 3.52 | |
| Software, algorithm | phylo.endemism | https://davidnipperess.blogspot.com/2012/07/phyloendemism-r-function-for.html |
Appendix 1—table 1
Results of ANOVA tests for significant derived land-use rank (DLUR) trends for overall soil invertebrate communities and each biodiversity metric.
| Metric | Term | Df | Sum Sq. | Mean Sq. | F stat. | R2 | P |
|---|---|---|---|---|---|---|---|
| Richness | DLUR | 1 | 33428.07 | 33428.07 | 8.18 | 0.11 | 0.006 |
| Residuals | 67 | 273678.56 | 4084.75 | 0.89 | |||
| Effective Species | DLUR | 1 | 1163.40 | 1163.40 | 4.66 | 0.07 | 0.034 |
| Residuals | 67 | 16728.67 | 249.68 | 0.93 | |||
| Rarity | DLUR | 1 | 25771.74 | 25771.74 | 31.94 | 0.32 | <0.001 |
| Residuals | 67 | 54061.04 | 806.88 | 0.68 | |||
| Phylogenetic Diversity | DLUR | 1 | 1234.54 | 1234.54 | 11.17 | 0.14 | 0.001 |
| Residuals | 67 | 7404.70 | 110.52 | 0.86 | |||
| Phylogenetic Rarity | DLUR | 1 | 311.22 | 311.22 | 31.71 | 0.32 | <0.001 |
| Residuals | 67 | 657.64 | 9.82 | 0.68 | |||
| Mean Pairwise Distance | DLUR | 1 | 0.00 | 0.00 | 0.99 | 0.01 | 0.324 |
| Residuals | 67 | 0.11 | 0.00 | 0.99 | |||
| Phylogenetic Diversity SES | DLUR | 1 | 25.63 | 25.63 | 5.62 | 0.08 | 0.021 |
| Residuals | 67 | 305.46 | 4.56 | 0.92 | |||
| Phylogenetic Rarity SES | DLUR | 1 | 549.79 | 549.79 | 48.95 | 0.42 | <0.001 |
| Residuals | 67 | 752.56 | 11.23 | 0.58 | |||
| Mean Pairwise Distance SES | DLUR | 1 | 11.16 | 11.16 | 3.28 | 0.05 | 0.075 |
| Residuals | 67 | 228.00 | 3.40 | 0.95 |
Appendix 1—table 2
Results of mixed-model ANOVA tests for derived land-use rank (DLUR), land-use category (LCAT), and taxonomic group differences and interactions for each biodiversity metric.
| Metric | Term | Df | Sum sq. | Mean sq. | F stat. | P |
|---|---|---|---|---|---|---|
| Richness | DLUR | 1 | 277.45 | 277.45 | 7.74 | 0.007 |
| LCAT | 3 | 205.35 | 68.45 | 1.91 | 0.137 | |
| Group | 16 | 15737.52 | 983.60 | 27.43 | <0.001 | |
| DLUR:Group | 16 | 1014.91 | 63.43 | 1.77 | 0.031 | |
| LCAT:Group | 48 | 2425.37 | 50.53 | 1.41 | 0.037 | |
| Effective Species | DLUR | 1 | 66.45 | 66.45 | 9.28 | 0.003 |
| LCAT | 3 | 36.93 | 12.31 | 1.72 | 0.173 | |
| Group | 16 | 3000.93 | 187.56 | 26.19 | <0.001 | |
| DLUR:Group | 16 | 155.71 | 9.73 | 1.36 | 0.155 | |
| LCAT:Group | 48 | 293.70 | 6.12 | 0.85 | 0.749 | |
| Rarity | DLUR | 1 | 222.86 | 222.86 | 24.71 | <0.001 |
| LCAT | 3 | 17.23 | 5.74 | 0.64 | 0.594 | |
| Group | 16 | 3082.62 | 192.66 | 21.36 | <0.001 | |
| DLUR:Group | 16 | 421.79 | 26.36 | 2.92 | <0.001 | |
| LCAT:Group | 48 | 318.82 | 6.64 | 0.74 | 0.908 | |
| Phylogenetic Diversity | DLUR | 1 | 12.97 | 12.97 | 12.83 | 0.001 |
| LCAT | 3 | 4.73 | 1.58 | 1.56 | 0.208 | |
| Group | 16 | 520.03 | 32.50 | 32.14 | <0.001 | |
| DLUR:Group | 16 | 62.75 | 3.92 | 3.88 | <0.001 | |
| LCAT:Group | 48 | 88.35 | 1.84 | 1.82 | <0.001 | |
| Phylogenetic Rarity | DLUR | 1 | 4.14 | 4.14 | 31.77 | <0.001 |
| LCAT | 3 | 0.28 | 0.09 | 0.72 | 0.543 | |
| Group | 16 | 38.74 | 2.42 | 18.56 | <0.001 | |
| DLUR:Group | 16 | 10.12 | 0.63 | 4.85 | <0.001 | |
| LCAT:Group | 48 | 6.94 | 0.14 | 1.11 | 0.288 | |
| Mean Pairwise Distance | DLUR | 1 | 0.21 | 0.21 | 2.87 | 0.096 |
| LCAT | 3 | 0.21 | 0.07 | 0.95 | 0.421 | |
| Group | 16 | 19.11 | 1.19 | 16.40 | <0.001 | |
| DLUR:Group | 16 | 2.93 | 0.18 | 2.51 | 0.001 | |
| LCAT:Group | 48 | 4.20 | 0.09 | 1.20 | 0.169 |
Appendix 1—table 3
Results of ANOVA tests for effects of spatial attributes (latitude and altitude) and land-use category on overall invertebrate community biodiversity metrics.
| Metric | Term | Df | Sum Sq. | Mean Sq. | F stat. | R2 | P |
|---|---|---|---|---|---|---|---|
| Richness | Latitude | 1 | 79.49 | 79.49 | 0.02 | 0.000 | 0.882 |
| Altitude | 1 | 72529.28 | 72529.28 | 20.19 | 0.236 | <0.001 | |
| Land use | 4 | 11761.72 | 2940.43 | 0.82 | 0.038 | 0.518 | |
| Residuals | 62 | 222736.15 | 3592.52 | 0.725 | |||
| Effective Species | Latitude | 1 | 283.47 | 283.47 | 1.19 | 0.016 | 0.280 |
| Altitude | 1 | 2241.17 | 2241.17 | 9.41 | 0.125 | 0.003 | |
| Land use | 4 | 597.76 | 149.44 | 0.63 | 0.033 | 0.645 | |
| Residuals | 62 | 14769.66 | 238.22 | 0.825 | |||
| Rarity | Latitude | 1 | 465.12 | 465.12 | 0.60 | 0.006 | 0.443 |
| Altitude | 1 | 17387.74 | 17387.74 | 22.33 | 0.218 | <0.001 | |
| Land use | 4 | 13699.46 | 3424.87 | 4.40 | 0.172 | 0.003 | |
| Residuals | 62 | 48280.46 | 778.72 | 0.605 | |||
| Phylogenetic Diversity | Latitude | 1 | 0.75 | 0.75 | 0.01 | 0.000 | 0.933 |
| Altitude | 1 | 1740.88 | 1740.88 | 16.78 | 0.202 | <0.001 | |
| Land use | 4 | 464.28 | 116.07 | 1.12 | 0.054 | 0.356 | |
| Residuals | 62 | 6433.33 | 103.76 | 0.745 | |||
| Phylogenetic Rarity | Latitude | 1 | 2.96 | 2.96 | 0.30 | 0.003 | 0.586 |
| Altitude | 1 | 164.59 | 164.59 | 16.68 | 0.170 | <0.001 | |
| Land use | 4 | 189.57 | 47.39 | 4.80 | 0.196 | 0.002 | |
| Residuals | 62 | 611.74 | 9.87 | 0.631 | |||
| Mean Pairwise Distance | Latitude | 1 | 0.00 | 0.00 | 0.39 | 0.006 | 0.536 |
| Altitude | 1 | 0.00 | 0.00 | 0.68 | 0.010 | 0.411 | |
| Land use | 4 | 0.01 | 0.00 | 1.41 | 0.082 | 0.241 | |
| Residuals | 62 | 0.10 | 0.00 | 0.902 |
Appendix 1—table 4
Results of ANOVA tests for effects of the first three components of a PCA on environmental covariates, plus land-use category, on overall invertebrate community biodiversity metrics.
A PCA was carried out on spatial (latitude and altitude) and soil chemistry variables (pH, C, N, C:N ratio, Olsen P, Total P, Ca, Mg, K, Na, cation exchange capacity, base saturation), of which the first three components explained 70.25% of variation.
| Metric | Term | Df | Sum Sq. | Mean Sq. | F stat. | R2 | P |
|---|---|---|---|---|---|---|---|
| Richness | PC1 | 1 | 12142.57 | 12142.57 | 3.25 | 0.040 | 0.076 |
| PC2 | 1 | 26135.36 | 26135.36 | 7.00 | 0.085 | 0.010 | |
| PC3 | 1 | 414.99 | 414.99 | 0.11 | 0.001 | 0.740 | |
| Land use | 4 | 40528.70 | 10132.18 | 2.71 | 0.132 | 0.038 | |
| Residuals | 61 | 227885.01 | 3735.82 | 0.742 | |||
| Effective Species | PC1 | 1 | 497.15 | 497.15 | 2.02 | 0.028 | 0.161 |
| PC2 | 1 | 618.84 | 618.84 | 2.51 | 0.035 | 0.118 | |
| PC3 | 1 | 11.19 | 11.19 | 0.05 | 0.001 | 0.832 | |
| Land use | 4 | 1725.81 | 431.45 | 1.75 | 0.096 | 0.151 | |
| Residuals | 61 | 15039.07 | 246.54 | 0.841 | |||
| Rarity | PC1 | 1 | 11905.88 | 11905.88 | 15.25 | 0.149 | <0.001 |
| PC2 | 1 | 7487.41 | 7487.41 | 9.59 | 0.094 | 0.003 | |
| PC3 | 1 | 233.36 | 233.36 | 0.30 | 0.003 | 0.587 | |
| Land use | 4 | 12569.11 | 3142.28 | 4.02 | 0.157 | 0.006 | |
| Residuals | 61 | 47637.01 | 780.93 | 0.597 | |||
| Phylogenetic Diversity | PC1 | 1 | 503.99 | 503.99 | 4.79 | 0.058 | 0.032 |
| PC2 | 1 | 812.16 | 812.16 | 7.72 | 0.094 | 0.007 | |
| PC3 | 1 | 10.98 | 10.98 | 0.10 | 0.001 | 0.748 | |
| Land use | 4 | 897.84 | 224.46 | 2.13 | 0.104 | 0.087 | |
| Residuals | 61 | 6414.27 | 105.15 | 0.742 | |||
| Phylogenetic Rarity | PC1 | 1 | 147.45 | 147.45 | 15.35 | 0.152 | <0.001 |
| PC2 | 1 | 98.38 | 98.38 | 10.24 | 0.102 | 0.002 | |
| PC3 | 1 | 10.34 | 10.34 | 1.08 | 0.011 | 0.304 | |
| Land use | 4 | 126.54 | 31.63 | 3.29 | 0.131 | 0.017 | |
| Residuals | 61 | 586.15 | 9.61 | 0.605 | |||
| Mean Pairwise Distance | PC1 | 1 | 0.002 | 0.002 | 1.432 | 0.021 | 0.236 |
| PC2 | 1 | 0.001 | 0.001 | 0.478 | 0.007 | 0.492 | |
| PC3 | 1 | 0.002 | 0.002 | 0.996 | 0.015 | 0.322 | |
| Land use | 4 | 0.006 | 0.001 | 0.863 | 0.051 | 0.491 | |
| Residuals | 61 | 0.105 | 0.002 | 0.906 |
Appendix 1—table 5
Results of ANOVA tests for significant derived land-use rank (DLUR) trends for each taxonomic group and biodiversity metric.
| Metric | Group | Term | Df | Sum Sq. | Mean Sq. | F stat. | R2 | P |
|---|---|---|---|---|---|---|---|---|
| Richness | Collembola | DLUR | 1 | 28.935 | 28.935 | 2.649 | 0.039 | 0.108 |
| Residuals | 65 | 710.110 | 10.925 | 0.961 | ||||
| Coleoptera | DLUR | 1 | 335.849 | 335.849 | 9.961 | 0.131 | 0.002 | |
| Residuals | 66 | 2225.210 | 33.715 | 0.869 | ||||
| Diptera | DLUR | 1 | 615.926 | 615.926 | 18.012 | 0.214 | <0.001 | |
| Residuals | 66 | 2256.839 | 34.195 | 0.786 | ||||
| Hymenoptera | DLUR | 1 | 293.041 | 293.041 | 19.024 | 0.229 | <0.001 | |
| Residuals | 64 | 985.823 | 15.403 | 0.771 | ||||
| Lepidoptera | DLUR | 1 | 476.785 | 476.785 | 19.328 | 0.227 | <0.001 | |
| Residuals | 66 | 1628.083 | 24.668 | 0.773 | ||||
| Hemiptera | DLUR | 1 | 26.788 | 26.788 | 2.920 | 0.044 | 0.092 | |
| Residuals | 64 | 587.166 | 9.174 | 0.956 | ||||
| other insects | DLUR | 1 | 74.531 | 74.531 | 8.968 | 0.123 | 0.004 | |
| Residuals | 64 | 531.909 | 8.311 | 0.877 | ||||
| non-mites | DLUR | 1 | 45.412 | 45.412 | 2.924 | 0.043 | 0.092 | |
| Residuals | 65 | 1009.454 | 15.530 | 0.957 | ||||
| mites | DLUR | 1 | 0.281 | 0.281 | 0.008 | 0.000 | 0.930 | |
| Residuals | 66 | 2359.719 | 35.753 | 1.000 | ||||
| Malacostraca | DLUR | 1 | 0.044 | 0.044 | 0.046 | 0.001 | 0.831 | |
| Residuals | 34 | 32.706 | 0.962 | 0.999 | ||||
| myriapods | DLUR | 1 | 1.518 | 1.518 | 0.555 | 0.017 | 0.462 | |
| Residuals | 32 | 87.453 | 2.733 | 0.983 | ||||
| Annelida | DLUR | 1 | 67.637 | 67.637 | 4.456 | 0.065 | 0.039 | |
| Residuals | 64 | 971.393 | 15.178 | 0.935 | ||||
| Mollusca | DLUR | 1 | 0.240 | 0.240 | 0.014 | 0.000 | 0.906 | |
| Residuals | 64 | 1082.245 | 16.910 | 1.000 | ||||
| Nematoda | DLUR | 1 | 110.491 | 110.491 | 0.559 | 0.008 | 0.457 | |
| Residuals | 67 | 13243.798 | 197.669 | 0.992 | ||||
| Platyhelminthes | DLUR | 1 | 0.175 | 0.175 | 0.195 | 0.004 | 0.661 | |
| Residuals | 49 | 43.982 | 0.898 | 0.996 | ||||
| Rotifera | DLUR | 1 | 201.555 | 201.555 | 0.635 | 0.010 | 0.428 | |
| Residuals | 66 | 20954.136 | 317.487 | 0.990 | ||||
| Tardigrada | DLUR | 1 | 0.177 | 0.177 | 0.469 | 0.015 | 0.499 | |
| Residuals | 30 | 11.323 | 0.377 | 0.985 | ||||
| Effective Species | Collembola | DLUR | 1 | 0.530 | 0.530 | 0.273 | 0.004 | 0.603 |
| Residuals | 65 | 126.200 | 1.942 | 0.996 | ||||
| Coleoptera | DLUR | 1 | 13.595 | 13.595 | 3.866 | 0.055 | 0.053 | |
| Residuals | 66 | 232.067 | 3.516 | 0.945 | ||||
| Diptera | DLUR | 1 | 44.602 | 44.602 | 10.967 | 0.142 | 0.002 | |
| Residuals | 66 | 268.411 | 4.067 | 0.858 | ||||
| Hymenoptera | DLUR | 1 | 21.826 | 21.826 | 4.614 | 0.067 | 0.036 | |
| Residuals | 64 | 302.768 | 4.731 | 0.933 | ||||
| Lepidoptera | DLUR | 1 | 62.719 | 62.719 | 12.384 | 0.158 | 0.001 | |
| Residuals | 66 | 334.257 | 5.064 | 0.842 | ||||
| Hemiptera | DLUR | 1 | 0.666 | 0.666 | 0.281 | 0.004 | 0.598 | |
| Residuals | 64 | 151.775 | 2.371 | 0.996 | ||||
| other insects | DLUR | 1 | 1.186 | 1.186 | 0.849 | 0.013 | 0.360 | |
| Residuals | 64 | 89.462 | 1.398 | 0.987 | ||||
| non-mites | DLUR | 1 | 6.539 | 6.539 | 1.997 | 0.030 | 0.162 | |
| Residuals | 65 | 212.805 | 3.274 | 0.970 | ||||
| mites | DLUR | 1 | 1.064 | 1.064 | 0.256 | 0.004 | 0.615 | |
| Residuals | 66 | 274.716 | 4.162 | 0.996 | ||||
| Malacostraca | DLUR | 1 | 0.007 | 0.007 | 0.036 | 0.001 | 0.852 | |
| Residuals | 34 | 6.754 | 0.199 | 0.999 | ||||
| myriapods | DLUR | 1 | 0.637 | 0.637 | 0.610 | 0.019 | 0.441 | |
| Residuals | 32 | 33.414 | 1.044 | 0.981 | ||||
| Annelida | DLUR | 1 | 15.530 | 15.530 | 9.802 | 0.133 | 0.003 | |
| Residuals | 64 | 101.400 | 1.584 | 0.867 | ||||
| Mollusca | DLUR | 1 | 4.329 | 4.329 | 1.021 | 0.016 | 0.316 | |
| Residuals | 64 | 271.445 | 4.241 | 0.984 | ||||
| Nematoda | DLUR | 1 | 16.682 | 16.682 | 0.571 | 0.008 | 0.452 | |
| Residuals | 67 | 1955.701 | 29.190 | 0.992 | ||||
| Platyhelminthes | DLUR | 1 | 0.094 | 0.094 | 0.340 | 0.007 | 0.563 | |
| Residuals | 49 | 13.622 | 0.278 | 0.993 | ||||
| Rotifera | DLUR | 1 | 131.612 | 131.612 | 2.615 | 0.038 | 0.111 | |
| Residuals | 66 | 3321.550 | 50.327 | 0.962 | ||||
| Tardigrada | DLUR | 1 | 0.174 | 0.174 | 0.630 | 0.021 | 0.434 | |
| Residuals | 30 | 8.291 | 0.276 | 0.979 | ||||
| Rarity | Collembola | DLUR | 1 | 2.891 | 2.891 | 1.331 | 0.020 | 0.253 |
| Residuals | 65 | 141.173 | 2.172 | 0.980 | ||||
| Coleoptera | DLUR | 1 | 263.306 | 263.306 | 25.786 | 0.281 | <0.001 | |
| Residuals | 66 | 673.930 | 10.211 | 0.719 | ||||
| Diptera | DLUR | 1 | 422.250 | 422.250 | 51.691 | 0.439 | <0.001 | |
| Residuals | 66 | 539.139 | 8.169 | 0.561 | ||||
| Hymenoptera | DLUR | 1 | 102.088 | 102.088 | 19.399 | 0.233 | <0.001 | |
| Residuals | 64 | 336.809 | 5.263 | 0.767 | ||||
| Lepidoptera | DLUR | 1 | 256.685 | 256.685 | 36.200 | 0.354 | <0.001 | |
| Residuals | 66 | 467.983 | 7.091 | 0.646 | ||||
| Hemiptera | DLUR | 1 | 16.816 | 16.816 | 7.048 | 0.099 | 0.010 | |
| Residuals | 64 | 152.695 | 2.386 | 0.901 | ||||
| other insects | DLUR | 1 | 41.828 | 41.828 | 14.903 | 0.189 | <0.001 | |
| Residuals | 64 | 179.631 | 2.807 | 0.811 | ||||
| non-mites | DLUR | 1 | 65.614 | 65.614 | 13.757 | 0.175 | <0.001 | |
| Residuals | 65 | 310.020 | 4.770 | 0.825 | ||||
| mites | DLUR | 1 | 37.895 | 37.895 | 5.675 | 0.079 | 0.020 | |
| Residuals | 66 | 440.698 | 6.677 | 0.921 | ||||
| Malacostraca | DLUR | 1 | 0.126 | 0.126 | 0.241 | 0.007 | 0.627 | |
| Residuals | 34 | 17.745 | 0.522 | 0.993 | ||||
| myriapods | DLUR | 1 | 4.426 | 4.426 | 3.511 | 0.099 | 0.070 | |
| Residuals | 32 | 40.347 | 1.261 | 0.901 | ||||
| Annelida | DLUR | 1 | 47.966 | 47.966 | 17.057 | 0.210 | <0.001 | |
| Residuals | 64 | 179.972 | 2.812 | 0.790 | ||||
| Mollusca | DLUR | 1 | 15.081 | 15.081 | 2.992 | 0.045 | 0.088 | |
| Residuals | 64 | 322.535 | 5.040 | 0.955 | ||||
| Nematoda | DLUR | 1 | 197.691 | 197.691 | 6.008 | 0.082 | 0.017 | |
| Residuals | 67 | 2204.664 | 32.905 | 0.918 | ||||
| Platyhelminthes | DLUR | 1 | 0.333 | 0.333 | 0.854 | 0.017 | 0.360 | |
| Residuals | 49 | 19.112 | 0.390 | 0.983 | ||||
| Rotifera | DLUR | 1 | 157.017 | 157.017 | 2.033 | 0.030 | 0.159 | |
| Residuals | 66 | 5097.292 | 77.232 | 0.970 | ||||
| Tardigrada | DLUR | 1 | 0.304 | 0.304 | 1.197 | 0.038 | 0.283 | |
| Residuals | 30 | 7.613 | 0.254 | 0.962 | ||||
| Phylogenetic Diversity | Collembola | DLUR | 1 | 0.711 | 0.711 | 1.505 | 0.023 | 0.224 |
| Residuals | 65 | 30.718 | 0.473 | 0.977 | ||||
| Coleoptera | DLUR | 1 | 21.952 | 21.952 | 9.688 | 0.128 | 0.003 | |
| Residuals | 66 | 149.544 | 2.266 | 0.872 | ||||
| Diptera | DLUR | 1 | 40.106 | 40.106 | 19.384 | 0.227 | <0.001 | |
| Residuals | 66 | 136.557 | 2.069 | 0.773 | ||||
| Hymenoptera | DLUR | 1 | 21.848 | 21.848 | 12.731 | 0.166 | 0.001 | |
| Residuals | 64 | 109.830 | 1.716 | 0.834 | ||||
| Lepidoptera | DLUR | 1 | 42.880 | 42.880 | 20.442 | 0.236 | <0.001 | |
| Residuals | 66 | 138.446 | 2.098 | 0.764 | ||||
| Hemiptera | DLUR | 1 | 5.773 | 5.773 | 3.883 | 0.057 | 0.053 | |
| Residuals | 64 | 95.147 | 1.487 | 0.943 | ||||
| other insects | DLUR | 1 | 18.456 | 18.456 | 13.631 | 0.176 | <0.001 | |
| Residuals | 64 | 86.652 | 1.354 | 0.824 | ||||
| non-mites | DLUR | 1 | 13.612 | 13.612 | 7.064 | 0.098 | 0.010 | |
| Residuals | 65 | 125.259 | 1.927 | 0.902 | ||||
| mites | DLUR | 1 | 7.975 | 7.975 | 2.926 | 0.042 | 0.092 | |
| Residuals | 66 | 179.924 | 2.726 | 0.958 | ||||
| Malacostraca | DLUR | 1 | 0.468 | 0.468 | 0.755 | 0.022 | 0.391 | |
| Residuals | 34 | 21.069 | 0.620 | 0.978 | ||||
| myriapods | DLUR | 1 | 0.002 | 0.002 | 0.005 | 0.000 | 0.944 | |
| Residuals | 32 | 15.613 | 0.488 | 1.000 | ||||
| Annelida | DLUR | 1 | 10.571 | 10.571 | 13.578 | 0.175 | <0.001 | |
| Residuals | 64 | 49.825 | 0.779 | 0.825 | ||||
| Mollusca | DLUR | 1 | 1.072 | 1.072 | 0.379 | 0.006 | 0.540 | |
| Residuals | 64 | 181.156 | 2.831 | 0.994 | ||||
| Nematoda | DLUR | 1 | 0.002 | 0.002 | 0.000 | 0.000 | 0.985 | |
| Residuals | 67 | 305.660 | 4.562 | 1.000 | ||||
| Platyhelminthes | DLUR | 1 | 1.314 | 1.314 | 2.057 | 0.040 | 0.158 | |
| Residuals | 49 | 31.305 | 0.639 | 0.960 | ||||
| Rotifera | DLUR | 1 | 5.444 | 5.444 | 2.665 | 0.039 | 0.107 | |
| Residuals | 66 | 134.809 | 2.043 | 0.961 | ||||
| Tardigrada | DLUR | 1 | 0.174 | 0.174 | 1.594 | 0.050 | 0.217 | |
| Residuals | 30 | 3.279 | 0.109 | 0.950 | ||||
| Phylogenetic Rarity | Collembola | DLUR | 1 | 0.165 | 0.165 | 4.070 | 0.059 | 0.048 |
| Residuals | 65 | 2.640 | 0.041 | 0.941 | ||||
| Coleoptera | DLUR | 1 | 8.151 | 8.151 | 26.035 | 0.283 | <0.001 | |
| Residuals | 66 | 20.663 | 0.313 | 0.717 | ||||
| Diptera | DLUR | 1 | 10.221 | 10.221 | 40.013 | 0.377 | <0.001 | |
| Residuals | 66 | 16.859 | 0.255 | 0.623 | ||||
| Hymenoptera | DLUR | 1 | 3.536 | 3.536 | 19.319 | 0.232 | <0.001 | |
| Residuals | 64 | 11.713 | 0.183 | 0.768 | ||||
| Lepidoptera | DLUR | 1 | 6.931 | 6.931 | 36.877 | 0.358 | <0.001 | |
| Residuals | 66 | 12.405 | 0.188 | 0.642 | ||||
| Hemiptera | DLUR | 1 | 0.467 | 0.467 | 4.095 | 0.060 | 0.047 | |
| Residuals | 64 | 7.306 | 0.114 | 0.940 | ||||
| other insects | DLUR | 1 | 2.752 | 2.752 | 15.755 | 0.198 | <0.001 | |
| Residuals | 64 | 11.180 | 0.175 | 0.802 | ||||
| non-mites | DLUR | 1 | 4.073 | 4.073 | 16.159 | 0.199 | <0.001 | |
| Residuals | 65 | 16.384 | 0.252 | 0.801 | ||||
| mites | DLUR | 1 | 2.303 | 2.303 | 11.052 | 0.143 | 0.001 | |
| Residuals | 66 | 13.752 | 0.208 | 0.857 | ||||
| Malacostraca | DLUR | 1 | 0.021 | 0.021 | 0.314 | 0.009 | 0.579 | |
| Residuals | 34 | 2.236 | 0.066 | 0.991 | ||||
| myriapods | DLUR | 1 | 0.200 | 0.200 | 4.708 | 0.128 | 0.038 | |
| Residuals | 32 | 1.359 | 0.042 | 0.872 | ||||
| Annelida | DLUR | 1 | 2.024 | 2.024 | 25.966 | 0.289 | <0.001 | |
| Residuals | 64 | 4.989 | 0.078 | 0.711 | ||||
| Mollusca | DLUR | 1 | 1.418 | 1.418 | 3.570 | 0.053 | 0.063 | |
| Residuals | 64 | 25.424 | 0.397 | 0.947 | ||||
| Nematoda | DLUR | 1 | 1.574 | 1.574 | 4.943 | 0.069 | 0.030 | |
| Residuals | 67 | 21.328 | 0.318 | 0.931 | ||||
| Platyhelminthes | DLUR | 1 | 0.000 | 0.000 | 0.002 | 0.000 | 0.966 | |
| Residuals | 49 | 2.873 | 0.059 | 1.000 | ||||
| Rotifera | DLUR | 1 | 0.701 | 0.701 | 3.020 | 0.044 | 0.087 | |
| Residuals | 66 | 15.321 | 0.232 | 0.956 | ||||
| Tardigrada | DLUR | 1 | 0.095 | 0.095 | 3.543 | 0.106 | 0.070 | |
| Residuals | 30 | 0.801 | 0.027 | 0.894 | ||||
| Mean Pairwise Distance | Collembola | DLUR | 1 | 0.028 | 0.028 | 1.193 | 0.018 | 0.279 |
| Residuals | 65 | 1.502 | 0.023 | 0.982 | ||||
| Coleoptera | DLUR | 1 | 0.002 | 0.002 | 0.097 | 0.001 | 0.757 | |
| Residuals | 66 | 1.338 | 0.020 | 0.999 | ||||
| Diptera | DLUR | 1 | 0.005 | 0.005 | 0.127 | 0.002 | 0.722 | |
| Residuals | 66 | 2.375 | 0.036 | 0.998 | ||||
| Hymenoptera | DLUR | 1 | 0.421 | 0.421 | 7.001 | 0.099 | 0.010 | |
| Residuals | 64 | 3.850 | 0.060 | 0.901 | ||||
| Lepidoptera | DLUR | 1 | 0.002 | 0.002 | 0.064 | 0.001 | 0.801 | |
| Residuals | 66 | 2.325 | 0.035 | 0.999 | ||||
| Hemiptera | DLUR | 1 | 0.113 | 0.113 | 1.211 | 0.019 | 0.275 | |
| Residuals | 64 | 5.968 | 0.093 | 0.981 | ||||
| other insects | DLUR | 1 | 0.039 | 0.039 | 0.631 | 0.010 | 0.430 | |
| Residuals | 64 | 3.986 | 0.062 | 0.990 | ||||
| non-mites | DLUR | 1 | 0.211 | 0.211 | 2.825 | 0.042 | 0.098 | |
| Residuals | 65 | 4.847 | 0.075 | 0.958 | ||||
| Mites | DLUR | 1 | 0.467 | 0.467 | 13.885 | 0.174 | <0.001 | |
| Residuals | 66 | 2.222 | 0.034 | 0.826 | ||||
| Malacostraca | DLUR | 1 | 0.689 | 0.689 | 1.957 | 0.054 | 0.171 | |
| Residuals | 34 | 11.968 | 0.352 | 0.946 | ||||
| myriapods | DLUR | 1 | 0.137 | 0.137 | 0.598 | 0.018 | 0.445 | |
| Residuals | 32 | 7.318 | 0.229 | 0.982 | ||||
| Annelida | DLUR | 1 | 0.436 | 0.436 | 7.805 | 0.109 | 0.007 | |
| Residuals | 64 | 3.574 | 0.056 | 0.891 | ||||
| Mollusca | DLUR | 1 | 0.228 | 0.228 | 2.577 | 0.039 | 0.113 | |
| Residuals | 64 | 5.651 | 0.088 | 0.961 | ||||
| Nematoda | DLUR | 1 | 0.001 | 0.001 | 0.168 | 0.003 | 0.683 | |
| Residuals | 67 | 0.551 | 0.008 | 0.997 | ||||
| Platyhelminthes | DLUR | 1 | 0.540 | 0.540 | 1.528 | 0.030 | 0.222 | |
| Residuals | 49 | 17.313 | 0.353 | 0.970 | ||||
| Rotifera | DLUR | 1 | 0.007 | 0.007 | 14.178 | 0.177 | <0.001 | |
| Residuals | 66 | 0.033 | 0.001 | 0.823 | ||||
| Tardigrada | DLUR | 1 | 0.134 | 0.134 | 1.377 | 0.044 | 0.250 | |
| Residuals | 30 | 2.910 | 0.097 | 0.956 |
Additional files
Download links
A two-part list of links to download the article, or parts of the article, in various formats.
Downloads (link to download the article as PDF)
Open citations (links to open the citations from this article in various online reference manager services)
Cite this article (links to download the citations from this article in formats compatible with various reference manager tools)
Rarity is a more reliable indicator of land-use impacts on soil invertebrate communities than other diversity metrics
eLife 9:e52787.
https://doi.org/10.7554/eLife.52787


