The Natural History of Model Organisms: The house sparrow in the service of basic and applied biology
- Global and Planetary Health, University of South Florida, United States
- University of Illinois at Urbana-Champaign, United States
Figures
Figure 1
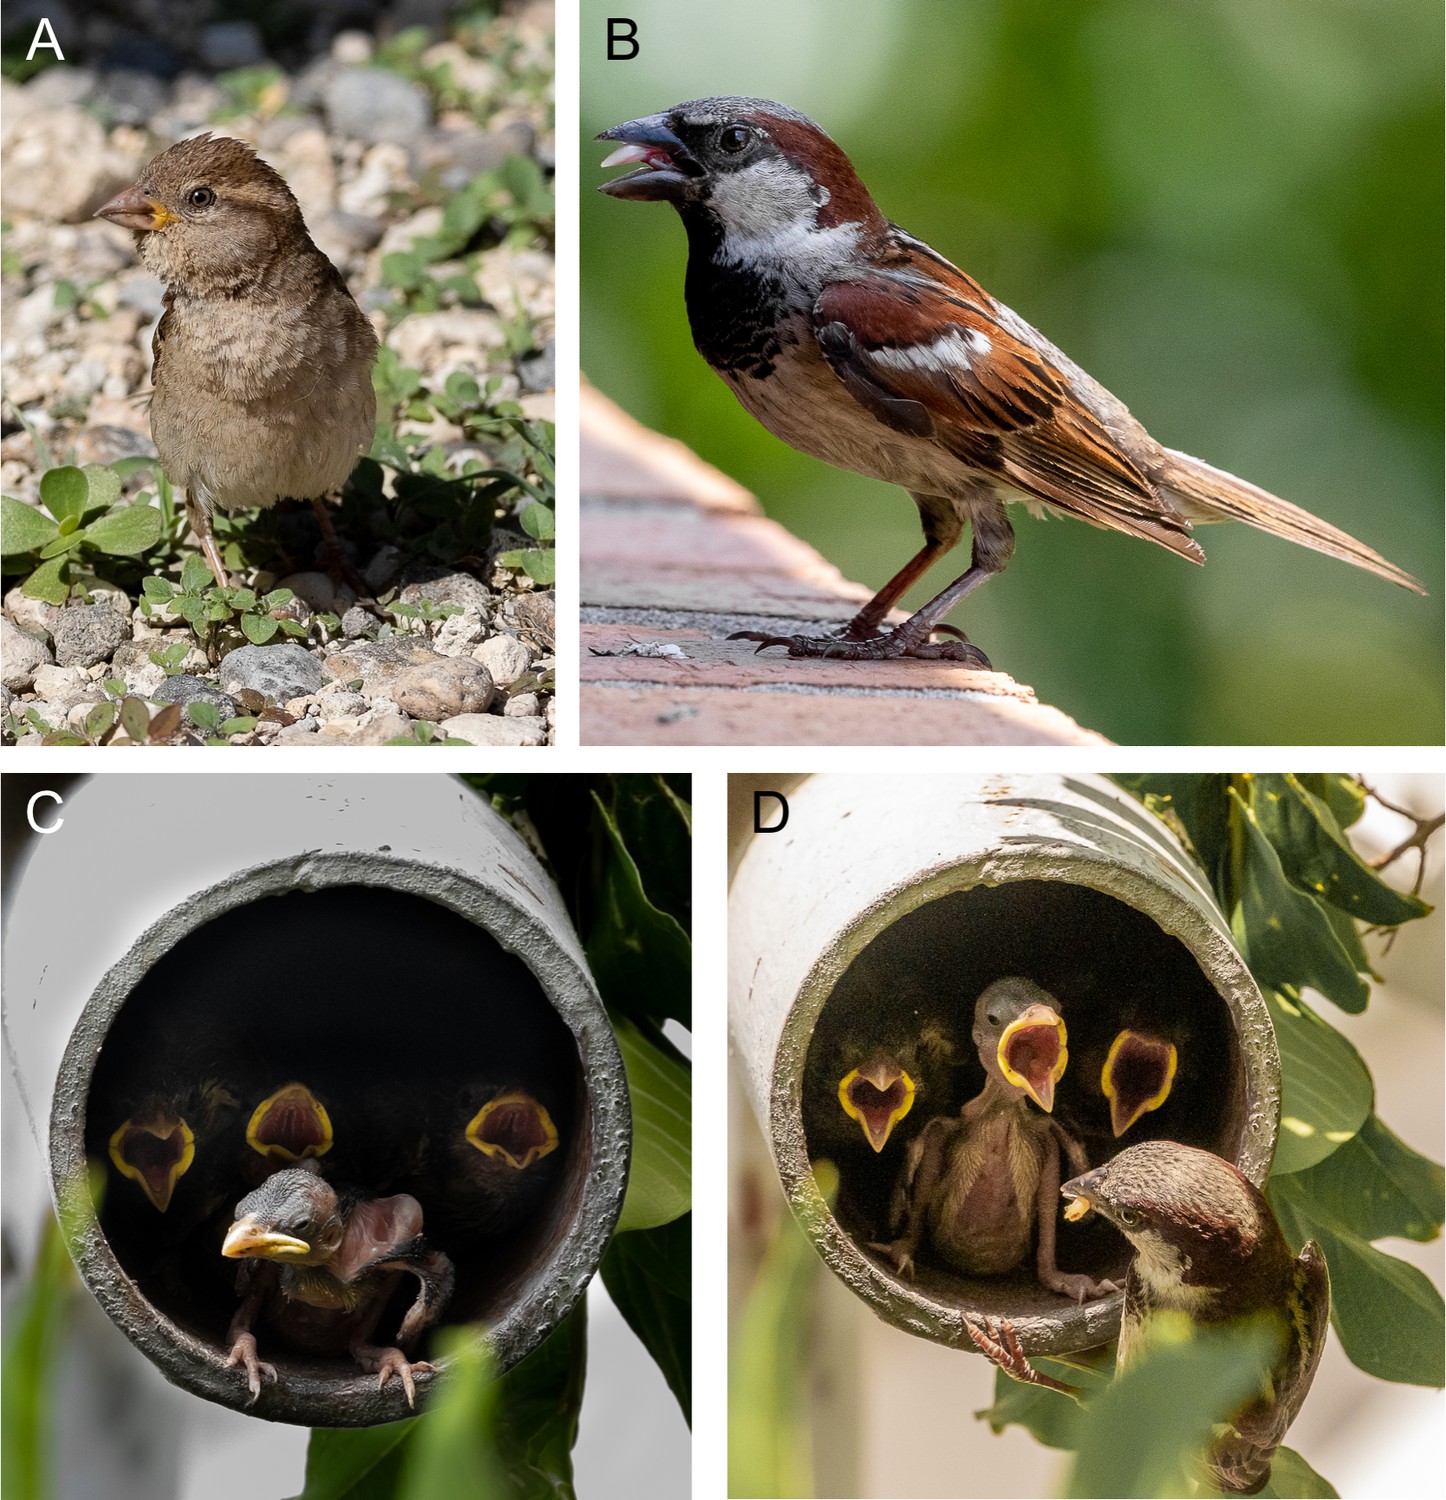
Adult and nestling house sparrows.
(A) Female house sparrow. (B) Male house sparrow. (C) Nestling house sparrows. (D) Male house sparrow provisioning nestlings. Image Credits: All images taken by Janneke Case in Tampa, Florida, United States, in 2019.
Videos
Animation 1
House sparrow distribution from 1800 to 2019.
Image Credit: Haley E Hanson, Noreen S Mathews, and Jaime E Zolik. For sources used, please refer to https://doi.org/10.6084/m9.figshare.11915955.v1.
Tables
Table 1
Global house sparrow introduction or translocation events by region.
Introduction and translocation events include both purposeful and inadvertent release of any number of birds from all subspecies, successful or unsuccessful. We list a range instead of a single number because of discrepancies among published reports. For sources used, please refer to https://doi.org/10.6084/m9.figshare.11915955.v1.
| Region | Number of introductions or translocations |
|---|---|
| Africa | 24–43 |
| Asia | 9–11 |
| Oceania | 54–60 |
| Europe | 4+ |
| North America | 135–136 |
| South America | 32–35+ |
Table 2
House sparrows available in museum collections.
Listed are the five largest house sparrow museum collections, the number of specimens present in each and the time of specimen sampling. Data was compiled from all collections present in the VertNet database (Constable et al., 2010). For search terms and the full table, please refer to https://doi.org/10.6084/m9.figshare.11915955.v1.
| Collection | Number of specimens |
|---|---|
| University of Kansas Biodiversity Institute (KU) | 12,830 |
| Royal Ontario Museum (ROM) | 7,654 |
| Field Museum of Natural History (FMNH) | 1,974 |
| Museum of Vertebrate Zoology, UC Berkeley (MVZ) | 1,888 |
| American Museum of Natural History (AMNH) | 1,776 |
| Specimens collected before 1900 | 1,597 |
| Specimens collected between 1900–1950 | 7,460 |
| Specimens collected after 1950 | 29,401 |
Download links
A two-part list of links to download the article, or parts of the article, in various formats.
Downloads (link to download the article as PDF)
Open citations (links to open the citations from this article in various online reference manager services)
Cite this article (links to download the citations from this article in formats compatible with various reference manager tools)
The Natural History of Model Organisms: The house sparrow in the service of basic and applied biology
eLife 9:e52803.
https://doi.org/10.7554/eLife.52803


