Climate change and intensive land use reduce soil animal biomass via dissimilar pathways
- Department of Community Ecology, Helmholtz-Centre for Environmental Research-UFZ, Germany
- German Centre for Integrative Biodiversity Research (iDiv), Halle-Jena-Leipzig, Germany
- Institute for Biology, Leipzig University, Germany
Figures
Figure 1
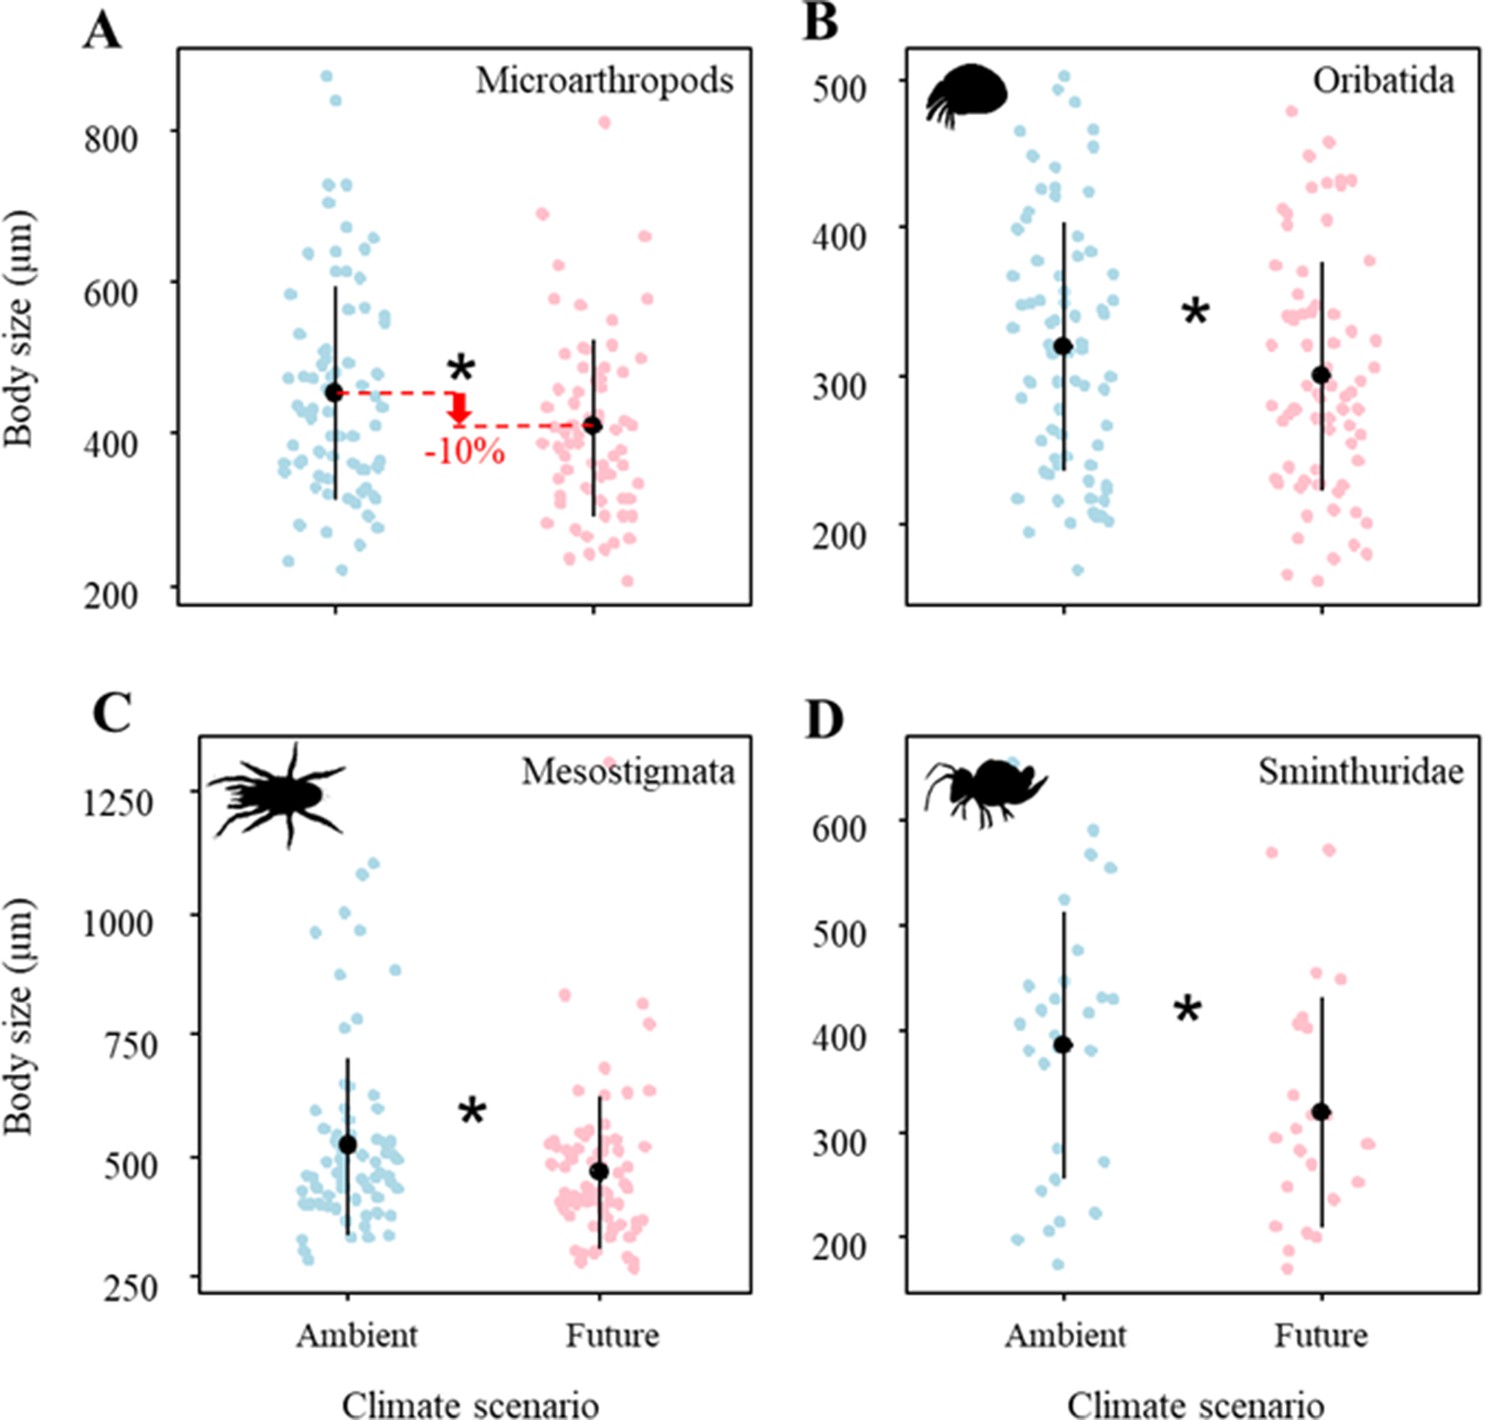
Effects of climate on the body size of (A) Microarthropods, (B) Oribatida, (C) Mesostigmata, and (D) Sminthuridae.
The predicted mean ± SD of body size for the ambient climate scenario (with all raw data as blue points), and future climate scenario (with all raw data as red points). * denotes significant (P < 0.05) differences between climate scenarios based on post-hoc Tukey’s HSD tests.
Figure 2
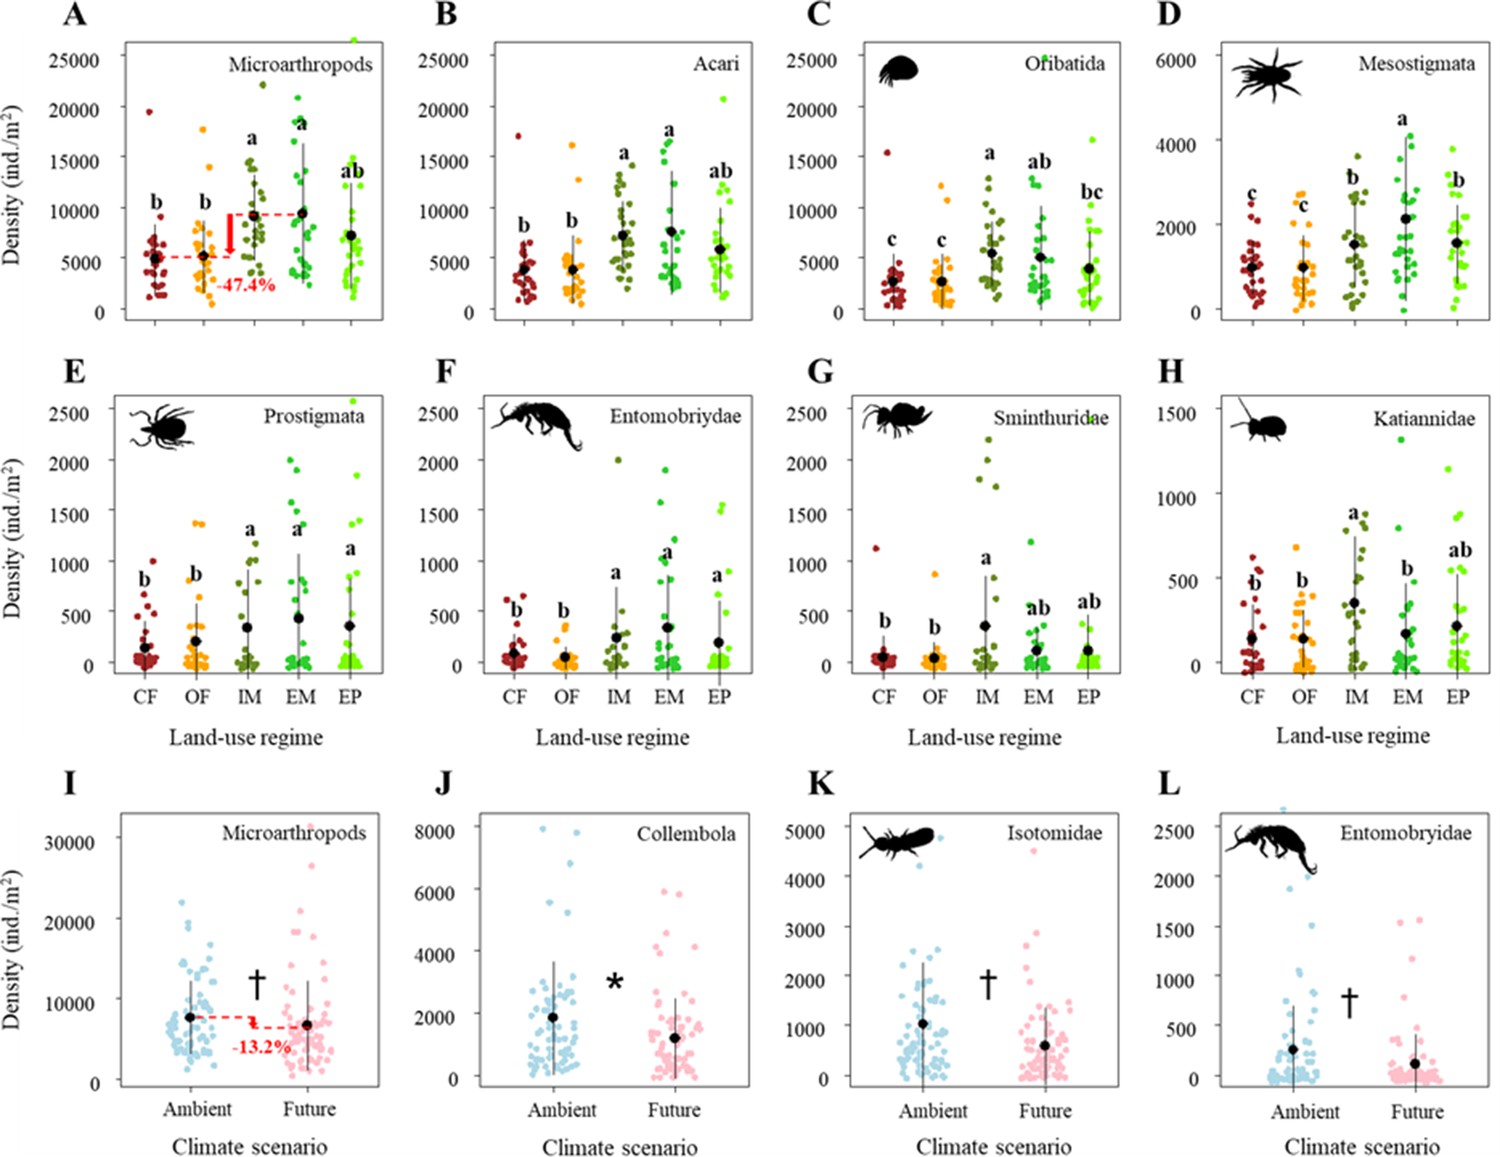
Effects of land use on the density of (A) Microarthropods, (B) Acari, (C) Oribatida, (D) Mesostigmata, (E) Prostigmata, (F) Entomobryidae, (G) Sminthuridae, and (H) Katiannidae.
The predicted mean ± SD of density for the conventional farming (CF, with all raw data as brown points), organic farming (OF, with all raw data as orange points), and intensively-used meadow (IM, with all raw data as olive drab points), extensively-used meadow (EM, with all raw data as lime green points), and extensively-used pasture (EP, with all raw data as lawn green points). Different lowercase letters denote significant (P < 0.05) differences among land-use regimes based on post-hoc Tukey’s HSD tests. Effects of climate on the density of (I) Microarthropods, (J) Collembola, (K) Isotomidae, and (L) Entomobryidae. The predicted mean ± SD of body size for the ambient climate scenario (with all raw data as blue points), and future climate scenario (with all raw data as red points). * and † denote significant (P < 0.05) and marginal (P < 0.10) differences between climate scenarios based on post-hoc Tukey’s HSD tests, respectively.
Figure 3
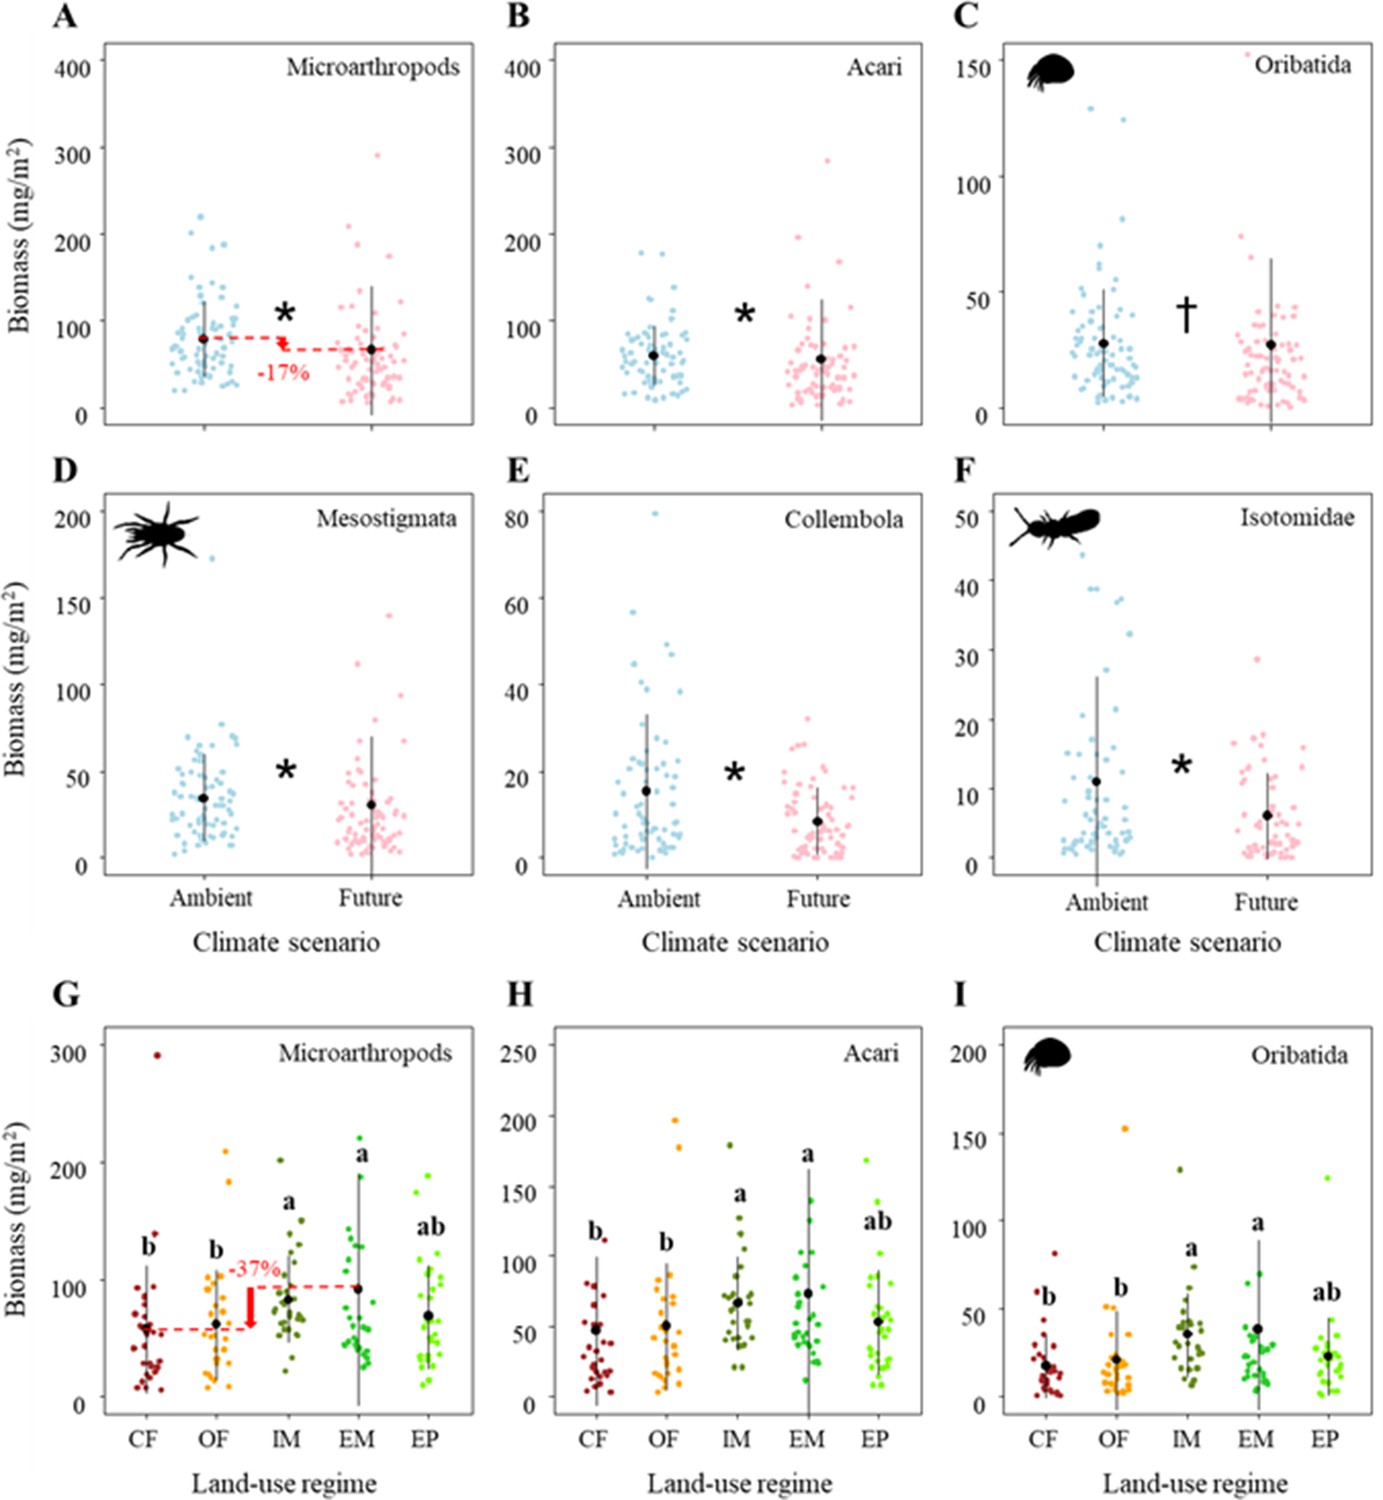
Effects of climate on the biomass of (A) Microarthropods, (B) Acari, (C) Oribatida, (D) Mesostigmata, (E) Collembola, and (F) Isotomidae.
The predicted mean ± SD of body size for the ambient climate scenario (with all raw data as blue points), and future climate scenario (with all raw data as red points). * and † denote significant (P < 0.05) and marginal (P < 0.10) differences between climate scenarios based on post-hoc Tukey’s HSD tests, respectively. Effects of land use on the biomass of (G) Microarthropods, (H) Acari, and (I) Oribatida. The predicted mean ± SD of density for the conventional farming (CF, with all raw data as brown points), organic farming (OF, with all raw data as orange points), and intensively-used meadow (IM, with all raw data as olive drab points), extensively-used meadow (EM, with all raw data as lime green points), and extensively-used pasture (EP, with all raw data as lawn green points). Different lowercase letters denote significant (P < 0.05) differences among land-use regimes based on post-hoc Tukey’s HSD tests.
Figure 4
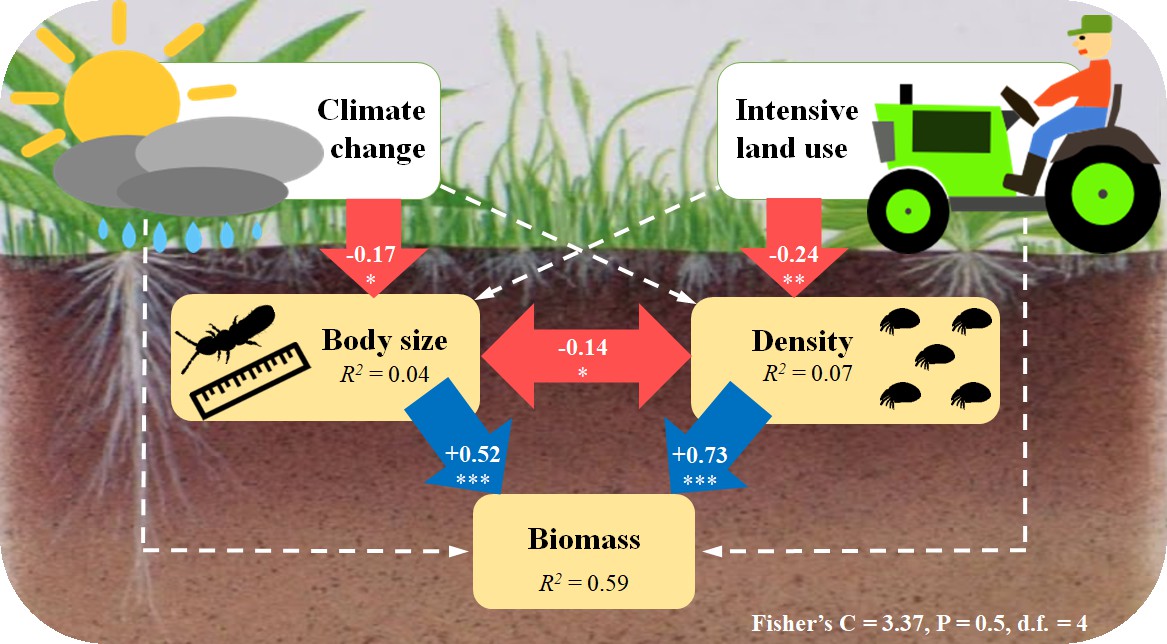
Structural equation model (SEM) showing the pathways through which climate change and intensive land use influence soil microarthropod biomass.
The final model (AIC = 33.37) is the best-fitting model, with Fisher’s C = 3.37; P = 0.5; d.f. = 4. Numbers in the arrows are standardized path coefficients. The blue (positive) and red (negative) one-way arrows indicate significant effects with * = P < 0.05, ** = P < 0.01, *** = P < 0.001. The dashed arrows indicate non-significant effects (P > 0.05) that are still remaining in this model. The double-headed red arrow indicates a significant correlation, with * = P < 0.05. The variance explained (R2) is shown in each panel.
Figure 5

Global Change Experimental Facility (GCEF).
(A) Aerial image of the experimental set-up of the GCEF in Bad Lauchstädt, Germany. Climate treatments as the main plot factor with two levels: (B) Ambient climate vs. (C) future climate.
© 2013 Helmholtz Centre for Environmental Research - UFZ. Figure 5 is provided by Helmholtz Centre for Environmental Research - UFZ. It is not covered by the CC-BY 4.0 licence and further reproduction of this figure would need permission from the copyright holder.
Tables
Table 1
Results (F-values) from generalized linear mixed models testing the effects of climate, land use, season and their interactions on (A) body size, (B) density and (C) biomass of soil microarthropods, Acari (including its order, i.e., Orib_: Oribatida; Meso_: Mesostigmata; Pros_: Prostigmata), and Collembola (including its family, i.e., Isot_: Isotomidae; Ento_: Entomobryidae; Smin_: Sminthuridae; Kati_: Katiannidae; Hypo_: Hypogastruridae; Onyc_: Onychiuridae).
Significant effects are indicated in bold font, with †=P < 0.1, *=P < 0.05, **=P < 0.01, ***=P < 0.001.
| Independent variable | Df | Micro- arthropod | Acari | Orib_ | Meso_ | Pros_ | Collem- bola | Isot_ | Ento_ | Smin_ | Kati_ | Hypo_ | Onyc_ | |
|---|---|---|---|---|---|---|---|---|---|---|---|---|---|---|
| (A) Body size | Climate (C) | 1,8 | 7.42* | 2.52 | 5.52* | 5.21* | 0.28 | 2.26 | 3.24 | 1.52 | 4.81* | 0.42 | 1.89 | 0.16 |
| Land use (L) | 4,32 | 1.34 | 1.32 | 0.65 | 2.13 | 0.52 | 0.49 | 1.21 | 1.79 | 0.44 | 0.65 | 3.55 | 0.47 | |
| C × L | 4,32 | 0.65 | 2.09 | 1.85 | 1.11 | 0.96 | 0.62 | 1.66 | 1.45 | 1.6 | 2.48 | 16.76 | 0.41 | |
| Season (D) | 2,16 | 63.87*** | 52.13*** | 83.35*** | 1.15 | 0.42 | 4.74** | 13.69*** | 1.2 | 7.55** | 3.25 | 0.11 | 4.87* | |
| C × D | 2,16 | 0.54 | 0.27 | 1.31 | 1.92 | - | 4 | 3.9 | 0.13 | 0.18 | 0.15 | 6.59 | 0.19 | |
| L × D | 8,64 | 2.44 | 0.8 | 1.81 | 1.3 | 0.18 | 2.22 | 1.5 | 3.33** | 0.86 | 1.97 | 2 | 0.91 | |
| C × L × D | 8,64 | 0.37 | 0.81 | 0.95 | 0.76 | - | 1.1 | 1.36 | 0 | 2.1 | 2.49 | - | 0.37 | |
| (B) Density | Climate (C) | 1,8 | 4.78† | 1.85 | 0.48 | 0.02 | 1.93 | 6.02* | 5.03† | 5.03† | 0.01 | 0 | 0.12 | 1.44 |
| Land use (L) | 4,32 | 9.47*** | 10.32*** | 5.86** | 5.49** | 3.76* | 0.74 | 0.81 | 3.68* | 4.07** | 3.4* | 1.45 | 0.37 | |
| C × L | 4,32 | 1.1 | 1.13 | 1.1 | 0.51 | 0.31 | 1.05 | 0.17 | 0.88 | 0.35 | 0.68 | 0.24 | 0.36 | |
| Season (D) | 2,16 | 9.45** | 13.28*** | 14.44*** | 6.04* | 97.61*** | 2.99 | 9.51** | 22.96 | 14.85*** | 5.88* | 4.4* | 8.63** | |
| C × D | 2,16 | 0.22 | 0.64 | 0.93 | 0.36 | 3.1 | 0.07 | 3.35 | 2.14 | 0.57 | 0.97 | 0.25 | 0.31 | |
| L × D | 8,64 | 2.02 | 1.05 | 1.53 | 0.86 | 3.24** | 3.71** | 1.89 | 2.37* | 4.3*** | 2.67* | 2.02 | 1.84 | |
| C × L × D | 8,64 | 0.37 | 0.56 | 0.59 | 0.77 | 0.81 | 0.45 | 0.71 | 1.35 | 0.67 | 1.39 | 0.78 | 0.84 | |
| (C) Biomass | Climate (C) | 1,8 | 8.69* | 7.15* | 4.04† | 6.76* | 1.67 | 8.86* | 7.89* | 0.18 | 0.23 | 0.1 | 1.77 | 0.04 |
| Land use (L) | 4,32 | 4.73** | 4.24** | 4.91** | 1.94 | 0.84 | 1.55 | 0.51 | 0.55 | 0.47 | 0.5 | 0.78 | 0.65 | |
| C × L | 4,32 | 1.33 | 1.49 | 1.32 | 0.65 | 0.33 | 0.61 | 0.43 | 1.06 | 0.25 | 0.38 | 3.43 | 0.46 | |
| Season (D) | 2,16 | 3.57 | 7.27** | 5.49* | 6.82** | 4.04 | 13.7*** | 13.58*** | 0.34 | 0.53 | 1.57 | 1.31 | 5.85* | |
| C × D | 2,16 | 0.9 | 1.34 | 0.28 | 2.05 | - | 3.18 | 3.65 | 0.14 | - | 0.31 | 6.37 | 0.64 | |
| L × D | 8,64 | 2.62 | 1.74 | 1.93 | 1.67 | 0.52 | 3.54** | 1.9 | 2.08 | - | 0.33 | 25.78*** | 1.17 | |
| C × L × D | 8,64 | 0.61 | 0.85 | 0.43 | 1.33 | - | 1.29 | 1 | 1.44 | - | 0.59 | - | 0.51 |
-
Table 1—source data 1
Density dataset of microarthropods.
- https://cdn.elifesciences.org/articles/54749/elife-54749-table1-data1-v2.csv
-
Table 1—source data 2
Density dataset of microarthropods.
- https://cdn.elifesciences.org/articles/54749/elife-54749-table1-data2-v2.csv
-
Table 1—source data 3
Biomass dataset of microarthropods.
- https://cdn.elifesciences.org/articles/54749/elife-54749-table1-data3-v2.csv
Additional files
-
Supplementary file 1
Results from generalized linear mixed models with linear contrasts testing the effects of land-use management intensity within land-use types (croplands vs. grasslands), croplands (conventional farming vs. organic farming), grasslands (meadows vs. pastures), and meadows (intensive meadows vs. extensive meadows), respectively, on (A) density of microarthropods, Acari, Oribatida (Orib_), Mesostigmata (Meso_), Prostigmata (Pros_), Entomobryidae (Ento_), Katiannidae (Kati_), Sminthuridae (Smin_), and (B) biomass of microarthropods, Acari, Oribatida (Orib_).
F-values are given and the significant effects are in bold font, with †= P < 0.1, * = P < 0.05, ** = P < 0.01, *** = P < 0.001. The predicted mean ± SD are given and different lowercase letters denote significant (P < 0.05) differences between land-use management intensities.
- https://cdn.elifesciences.org/articles/54749/elife-54749-supp1-v2.doc
-
Supplementary file 2
Results from generalized linear mixed models with linear contrasts testing the effects of season (autumn vs. spring) on (A) body size, (B) density, and (C) biomass of microarthropods, Acari, and Collembola.
F-values are given and the significant effects are in bold font, with ** = P < 0.01, *** = P < 0.001. The predicted mean ± SD are given and different lowercase letters denote significant (P < 0.05) differences between the two seasons.
- https://cdn.elifesciences.org/articles/54749/elife-54749-supp2-v2.docx
-
Supplementary file 3
Descriptions of five land-use regimes.
- https://cdn.elifesciences.org/articles/54749/elife-54749-supp3-v2.docx
-
Transparent reporting form
- https://cdn.elifesciences.org/articles/54749/elife-54749-transrepform-v2.docx
Download links
A two-part list of links to download the article, or parts of the article, in various formats.
Downloads (link to download the article as PDF)
Open citations (links to open the citations from this article in various online reference manager services)
Cite this article (links to download the citations from this article in formats compatible with various reference manager tools)
Climate change and intensive land use reduce soil animal biomass via dissimilar pathways
eLife 9:e54749.
https://doi.org/10.7554/eLife.54749


