Magnetic alignment enhances homing efficiency of hunting dogs
- Department of Game Management and Wildlife Biology, Faculty of Forestry and Wood Sciences, Czech University of Life Sciences, Czech Republic
- Biology Department, Barry University, United States
- Department of Ethology, Institute of Animal Science, Czech Republic
- Department of Ethology and Companion Animal Science, Faculty of Agrobiology, Food and Natural Resources, Czech University of Life Sciences, Czech Republic
- Department of Zoology and Fisheries, Faculty of Agrobiology, Food and Natural Resources, Czech University of Life Sciences, Czech Republic
- Department of Biological Sciences, Virginia Tech, United States
Figures
Figure 1
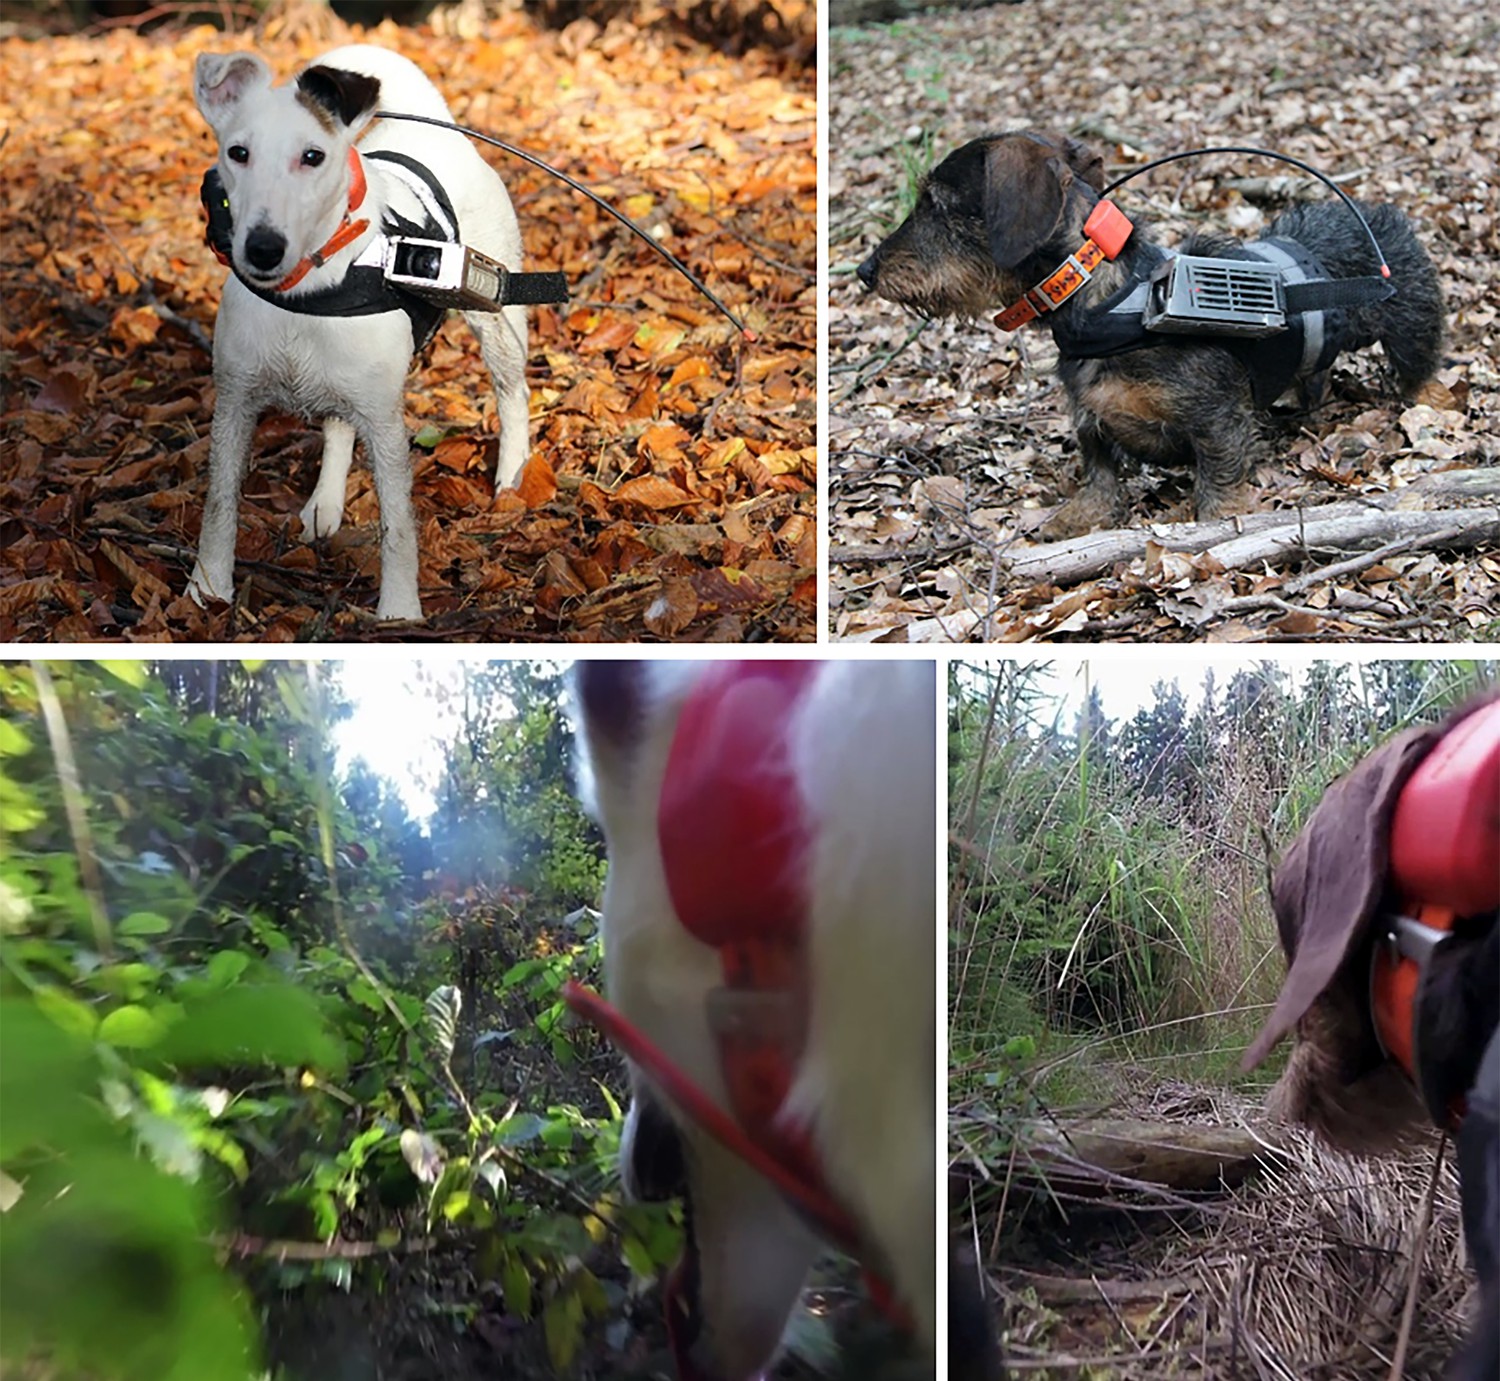
Still shots of a fox terrier (left column) and a miniature dachshund (right column) used in this study showing the tracking equipment and habitat.
Above: The GPS transmitter and antenna are fixed to a collar and fitted around the animal’s neck (note that for safety and comfort of the animal, the collar is free to rotate). The black fabric harness is secured around the torso and chest and is used to attach the protective camera case containing the camera and battery. Below: A typical field of view captured by the video camera that includes the dog’s head/neck, and provides a detailed view of the surrounding terrain. An on-board microphone (not visible) is used to record audio.
Figure 2
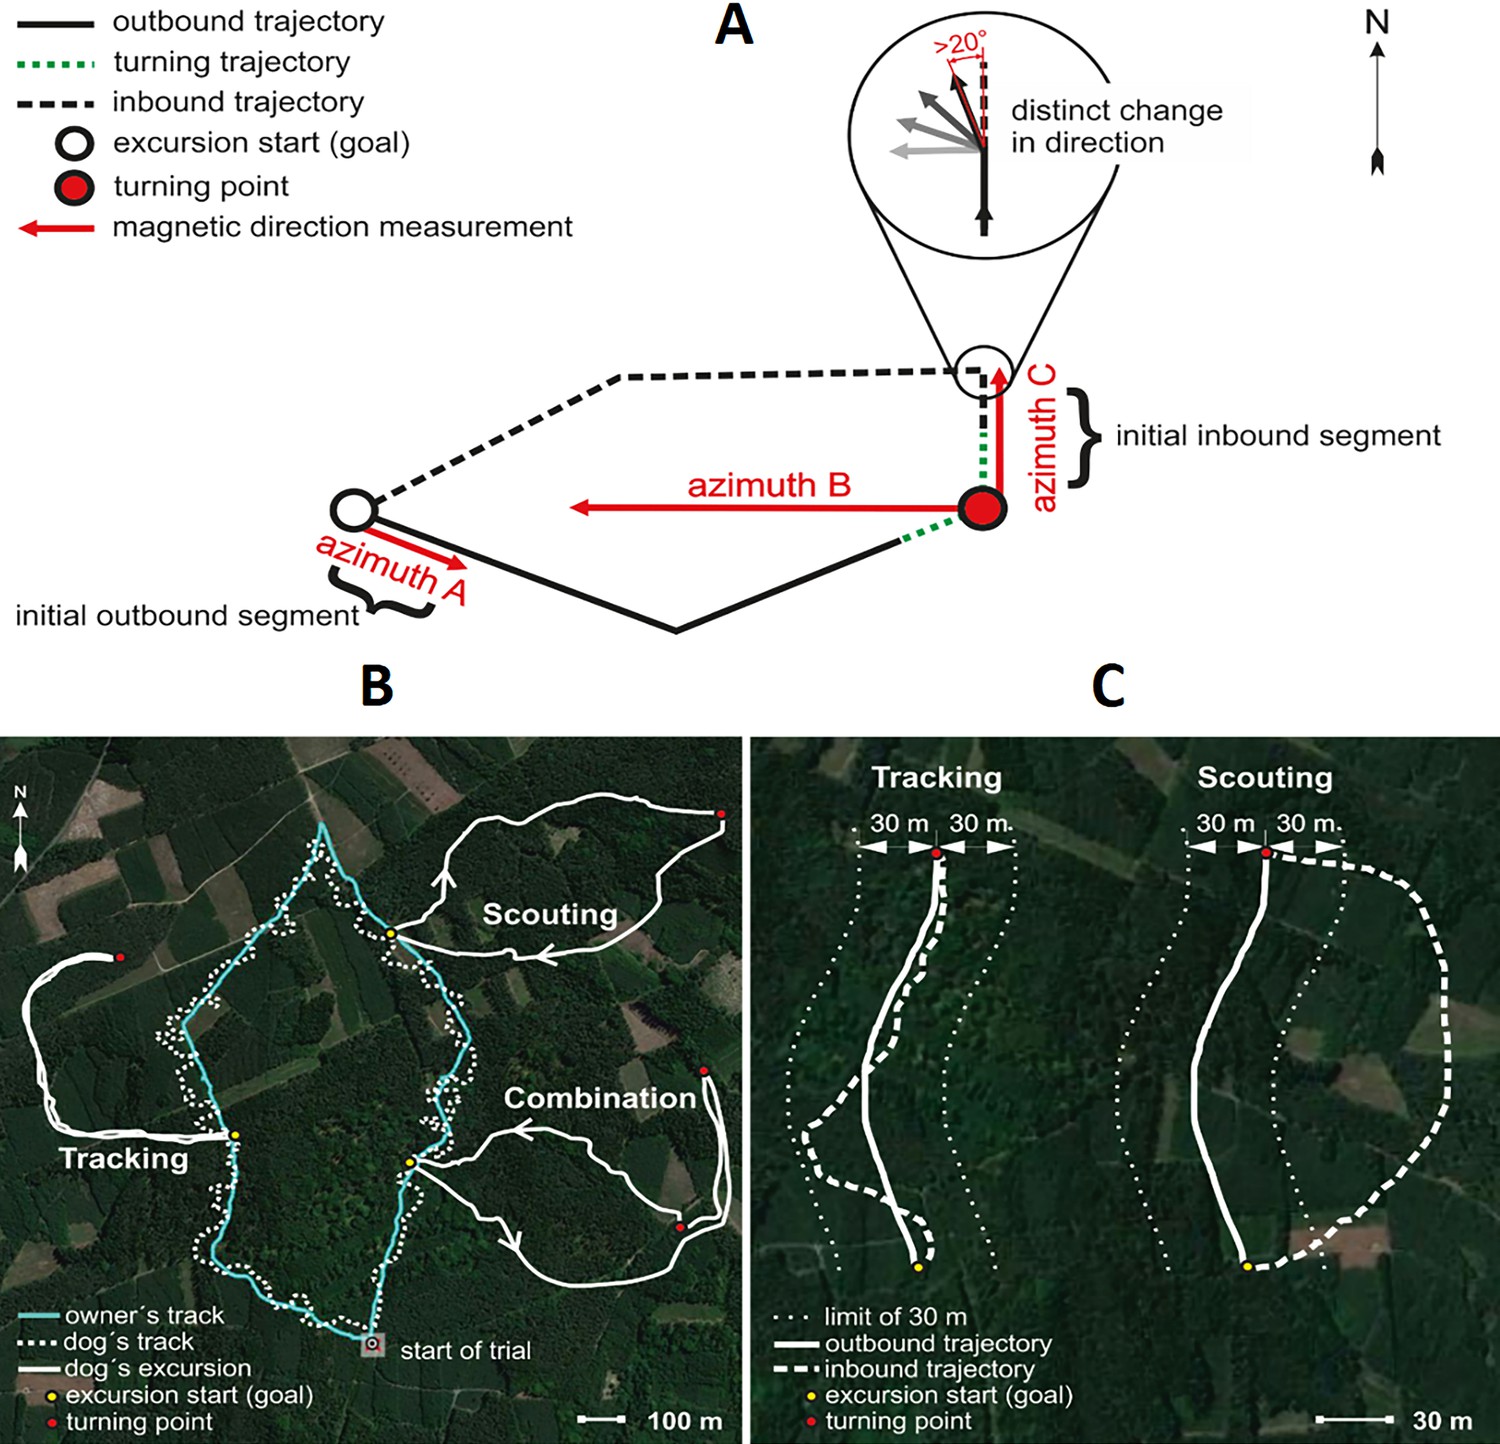
Spatial features and return strategies derived from GPS data used in analyses.
(A) Schematic illustration of total excursion track. Excursion start marks location of owner when the dog is more than 100 m away, indicating that the dog is pursuing a game animal. Excursion start also marks the approximate location where the owner remains hidden until the dog returns. Turning point represents the location where the dog initiated its return to the owner. Azimuth A represents the magnetic direction of the initial outbound segment, calculated between the excursion start and the GPS point recorded 5 s after the excursion start. Azimuth B represents the magnetic direction of the owner relative to the dog at the turning point. Azimuth C represents the magnetic direction of the initial inbound segment, the ‘compass run’, calculated by measuring the direction between the turning point and the point where the dog exhibits a distinct (>20°) deflection in track direction (magnified inset). See Materials and methods for additional details. (B) GPS tracks showing examples of Tracking and Scouting strategies or combination of strategies. Solid white tracks show excursions. The turquoise line shows the owner’s track and the white dotted line shows the dog’s track during non-excursion portions of the trial. (C) Examples of Tracking and Scouting return strategies: Tracking: inbound return track falls within a ± 30 m corridor limit (shown by small white dots flanking each side of the track) of the outbound track. Scouting: the inbound return track is separated from the outbound trajectory by at least 30 m.
Figure 3
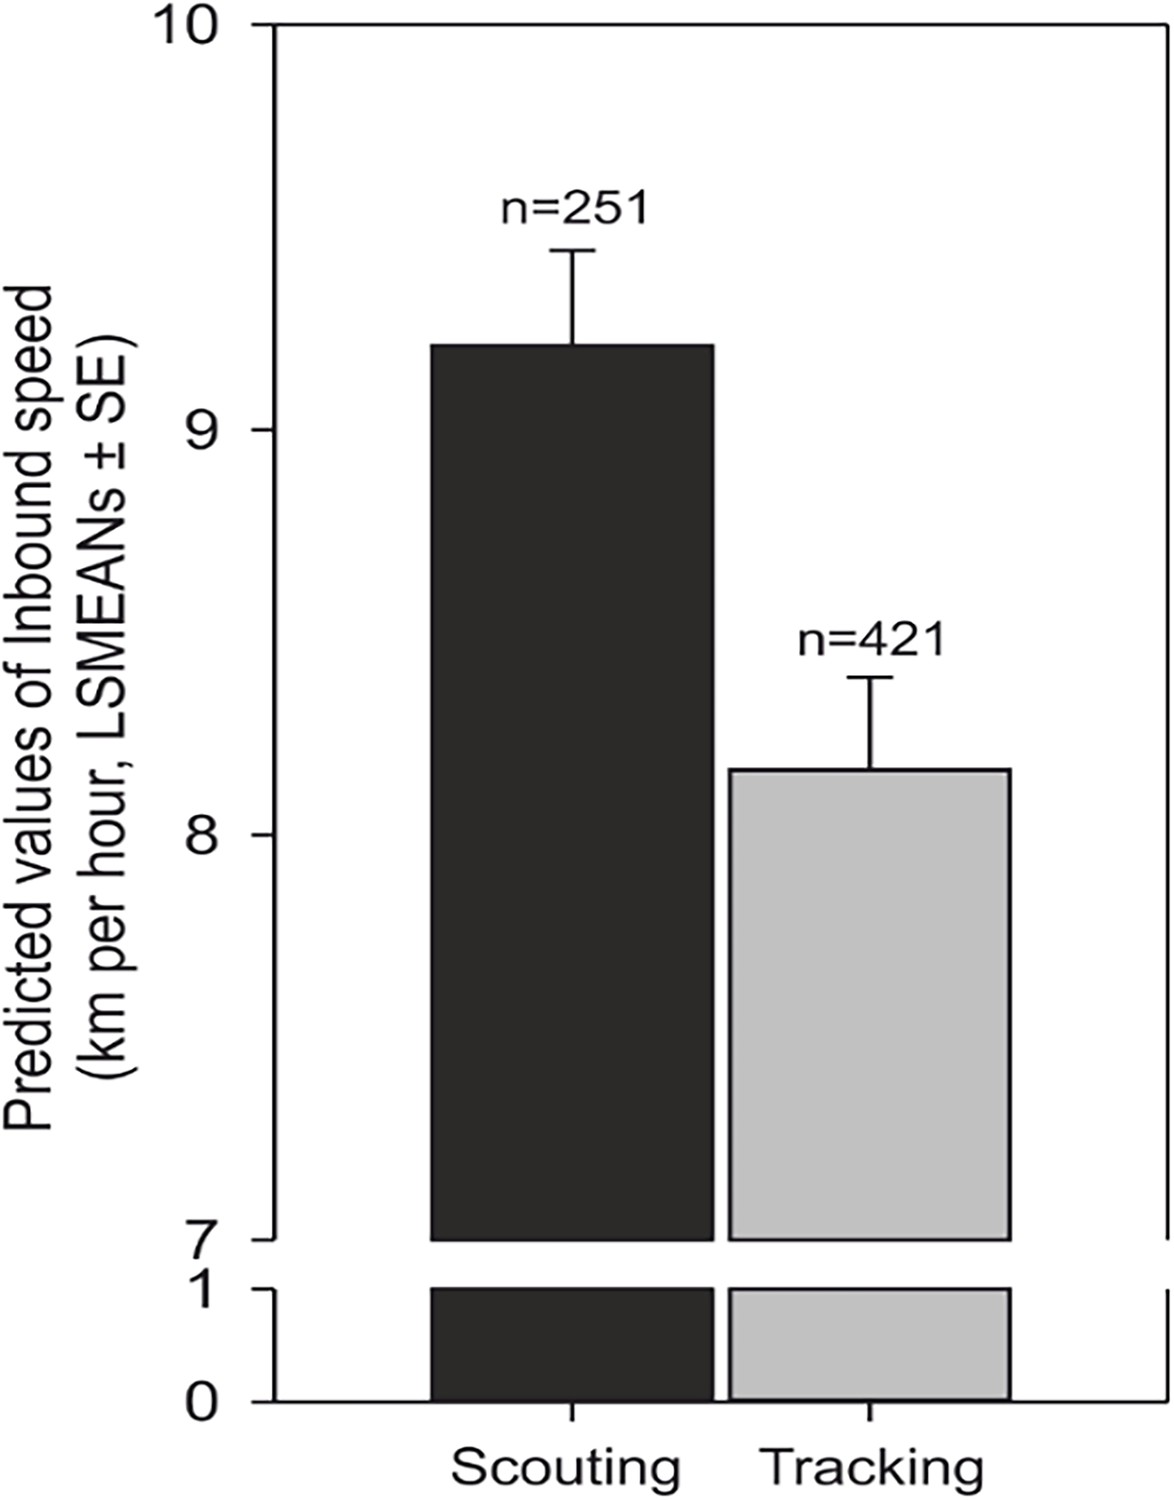
Average speed increases in scouting compared to tracking.
Predicted values of inbound speed (km/hour, LSMEANs ± SE) according to return strategy and independent of the direction of the compass run (azimuth C).
Figure 4
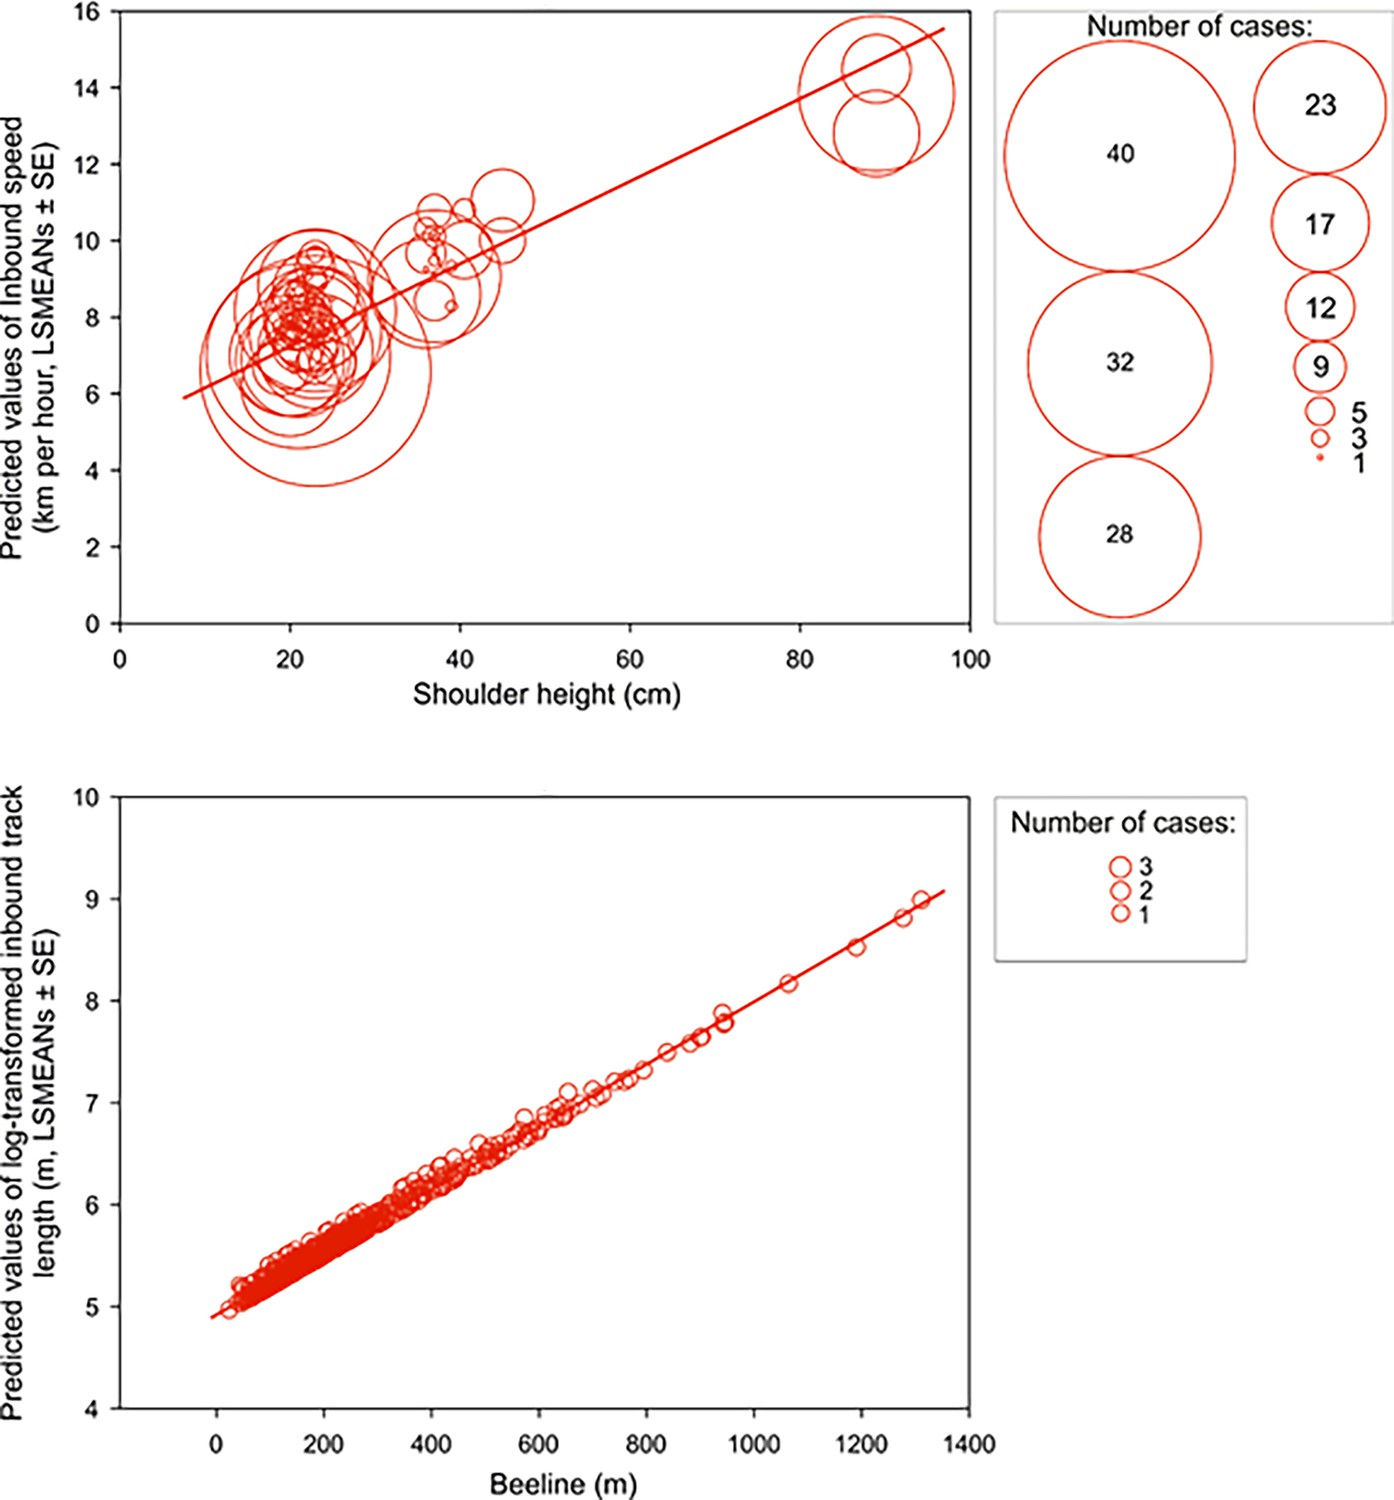
Inbound speed and track length positively correlate with shoulder height and beeline excursion distance, respectively.
Upper row: A bubble-plot of predicted values of inbound speed (km per hour, LSMEANs ± SE) plotted relative to shoulder height (cm). The center of each bubble represents the predictive value and bubble size represents the number of cases for that value. Size class scale is shown on the right. Bottom row: A bubble-plot of predicted values of log-transformed total inbound track length (m, LSMEANs ± SE) as a function of direct (‘beeline’) distance between the turning point and the owner. The center of each bubble indicates the predictive value and bubble size is equivalent to the number of cases, as shown in the box on the right.
Figure 5
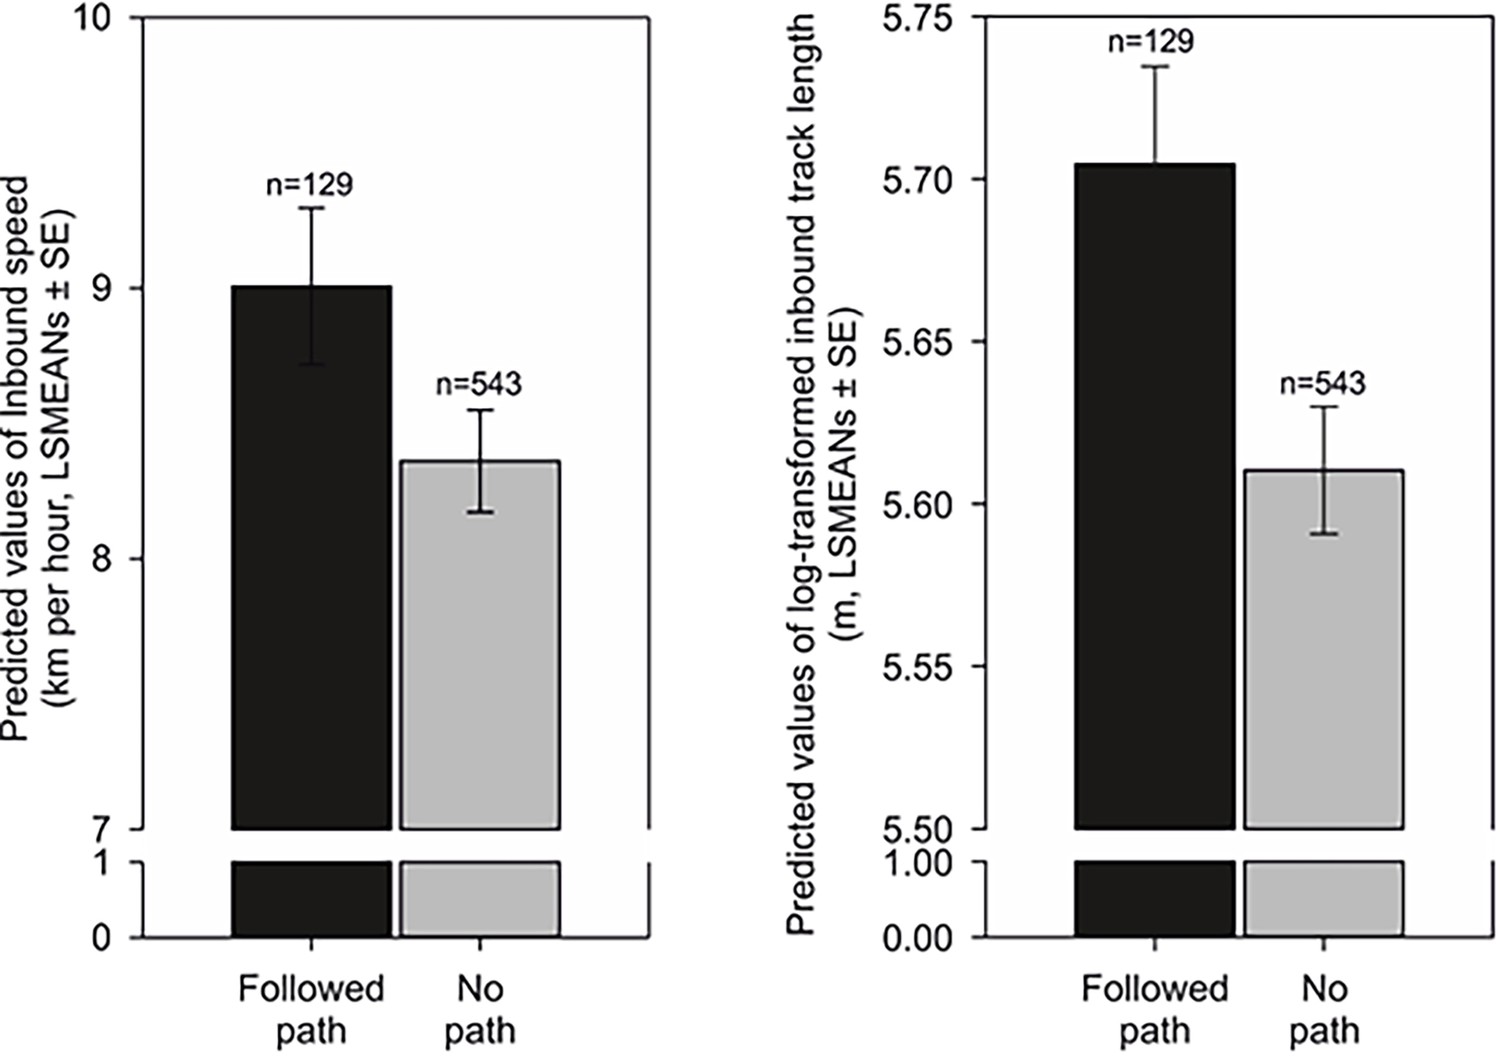
Inbound speed (length) and inbound track length (right) influenced by forest paths during the homing return.
Left: Predicted values of inbound speed (km per hour, LSMEANs ± SE) grouped according to whether a portion of the inbound trajectory followed a forest path (‘Followed path’), or if the return was completed without the use of a forest path (‘No path’). Right: Predicted values of log-transformed total inbound track length (m, LSMEANs ± SE) between returns when at least a portion of the inbound track followed a forest path compared to returns when no forest paths were used.
Figure 6
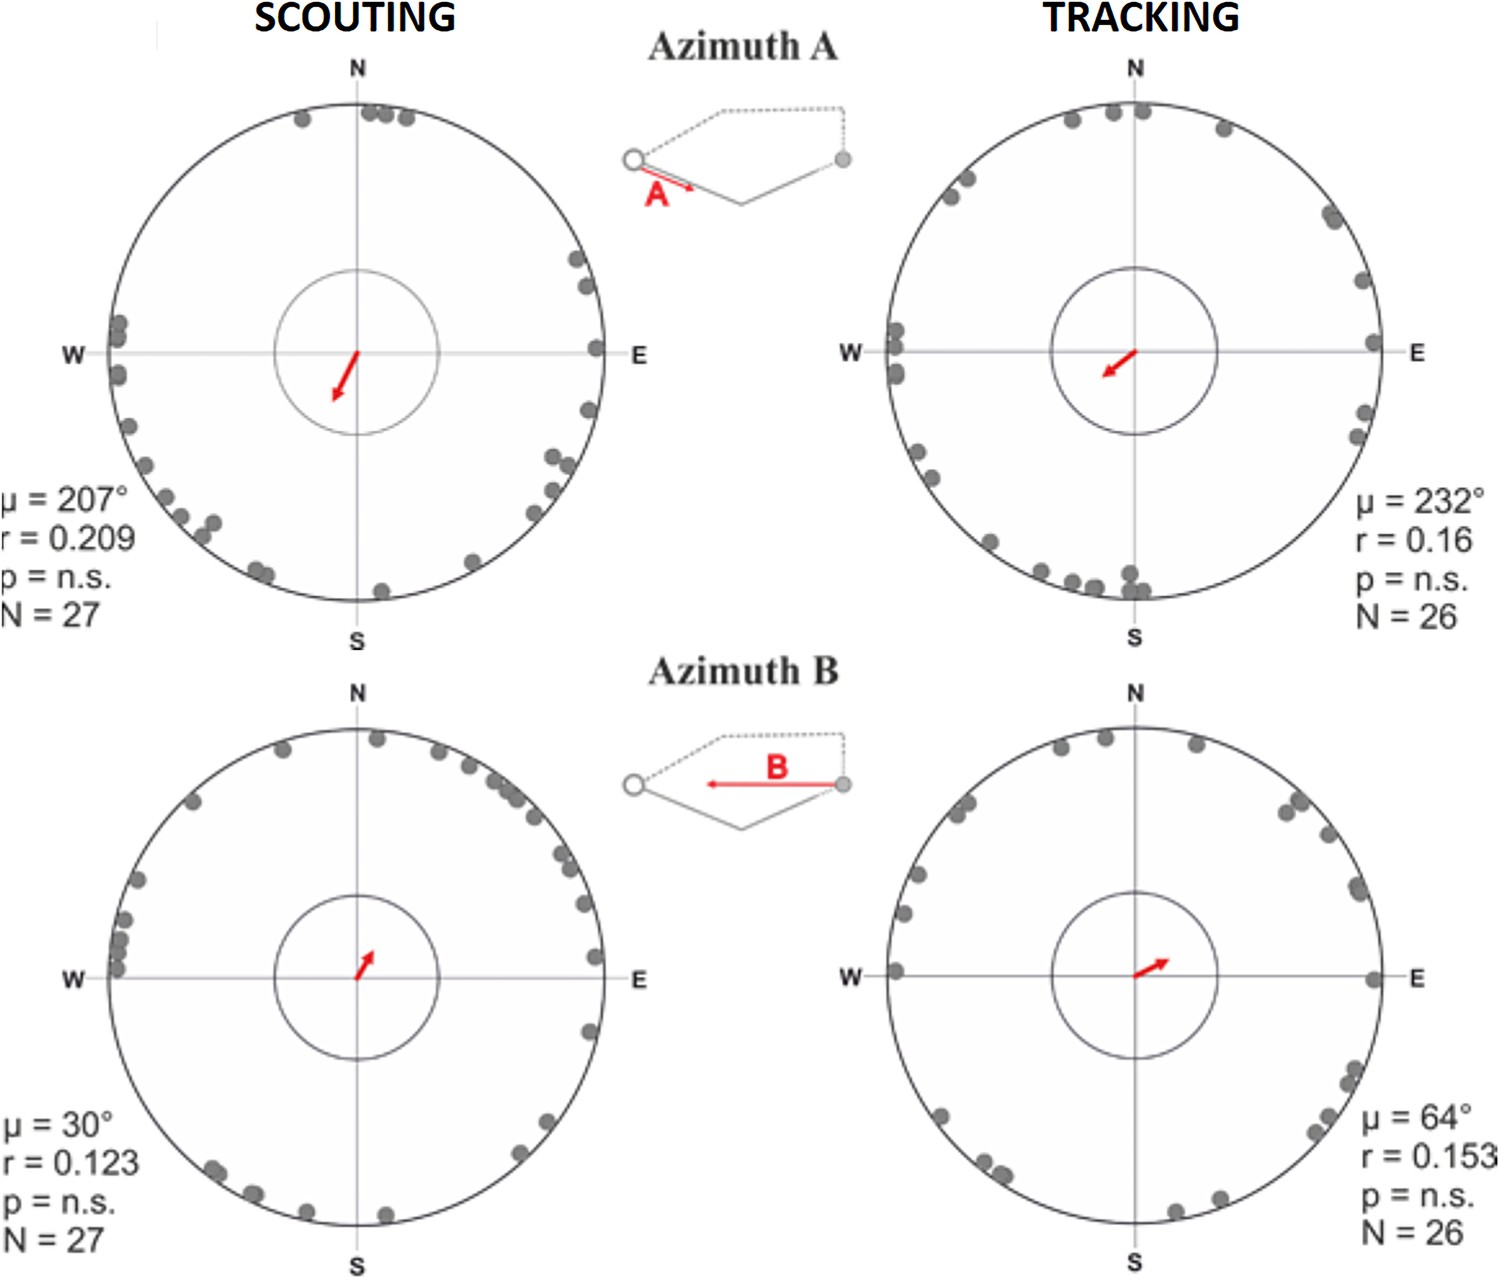
Circular distributions for azimuth A and azimuth B means grouped by return strategy.
Circular distributions of magnetic orientation of the direction of the turning point relative to the excursion start/owner (azimuth B) and the initial outbound segment (azimuth A) for scouting (left column) and tracking (right column). The small schematics centered between each plot show the vector corresponding to the data in each distribution. The red arrow indicates the angular vector (µ) calculated over all angular means. The length of the mean vector (r) corresponds to the degree of clustering in the distribution on a scale of 0.0–1.0, where the circular plot radius = 1.0. The inner circle marks the 0.05 level of significance limit computed using the Rayleigh test.
Figure 7
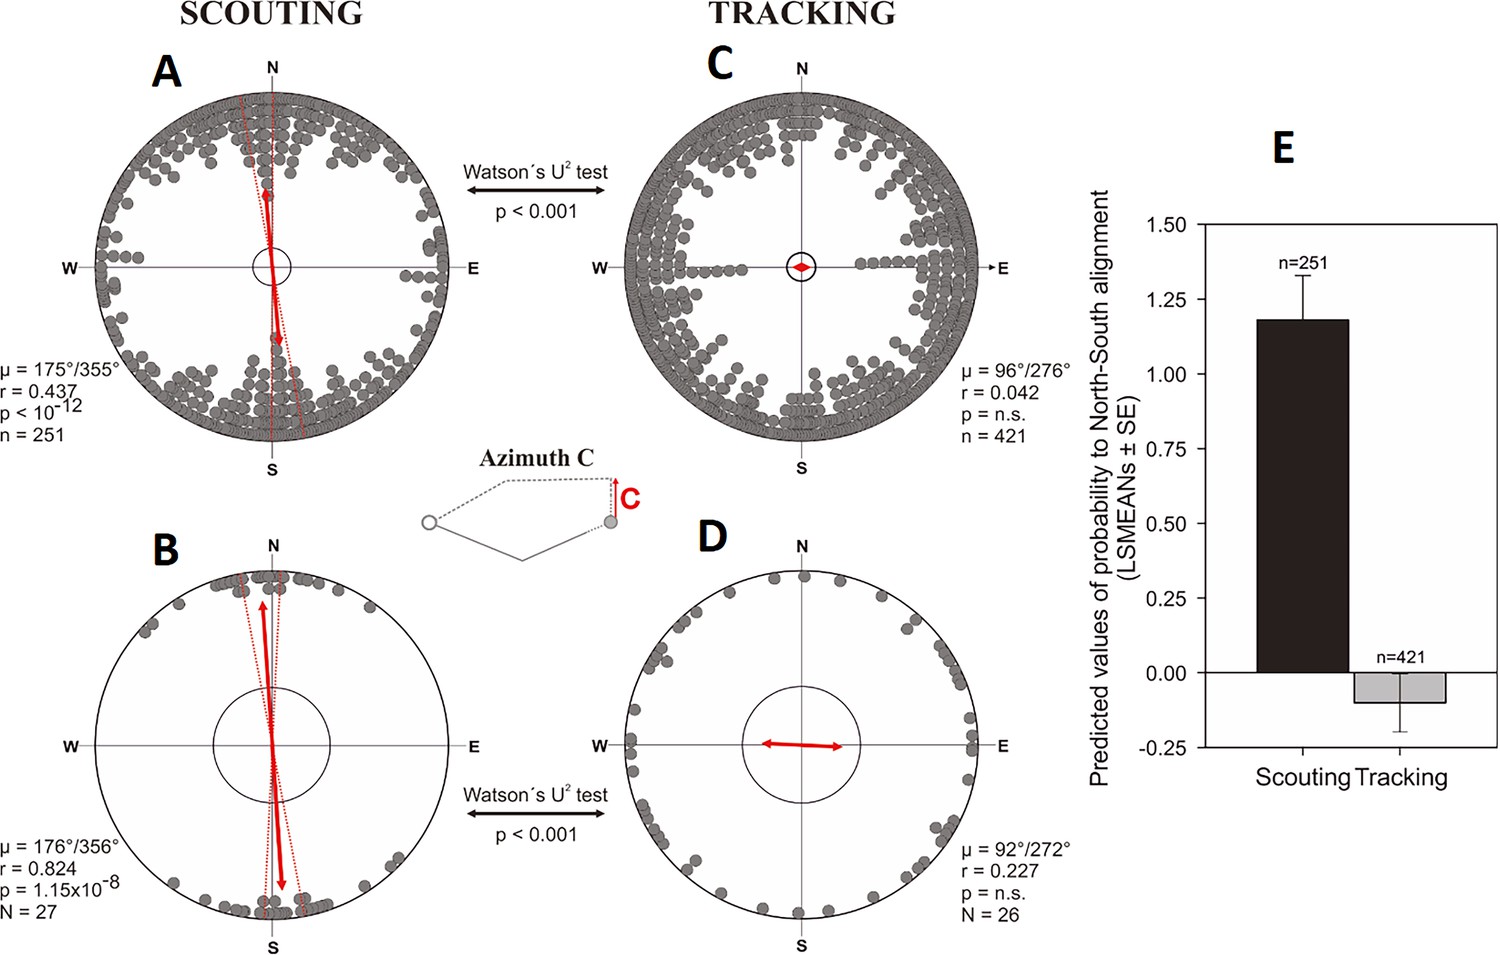
Alignment responses during the initial inbound return (= ‘compass run’) in free-roaming dogs.
(A–D) Circular distributions showing geomagnetic alignment responses during the initial inbound segment (azimuth C, ‘compass run’), when distributions are partitioned into Scouting (A, B) and Tracking (C, D) return strategies. Grey bearings plotted on the periphery of the distributions represent the axial orientation of compass runs for each excursion (A, C), each bearing treated as an independent data point, or (B, D) the axial orientation of compass runs when the mean orientation was first calculated for each dog. All data are plotted relative to magnetic north, indicated at the top of each plot, and the red double-headed arrow indicates the mean axial vector (µ) for each distribution. The length of the mean vector (r) corresponds to the degree of clustering around the mean and ranges from 0.0 to 1.0, with the radius of each plot = 1.0. Dashed red lines represent the 95% confidence intervals and the inner grey circle marks the p=0.05 level of significance limit computed using the Rayleigh test. Results from Watson’s U2 tests are shown between distributions, revealing significant differences in the compass run orientation between tracking a scouting return strategies. The small schematic centered between the plots shows azimuth C and the axial direction of the red vector corresponds to the orientation data plotted in each distribution. (E) Predicted values of the probability that dogs will exhibit a compass run along the ~north south geomagnetic axis (±45°) during the initial inbound segment (LSMEANs ± SE) according to return strategy.
Figure 8
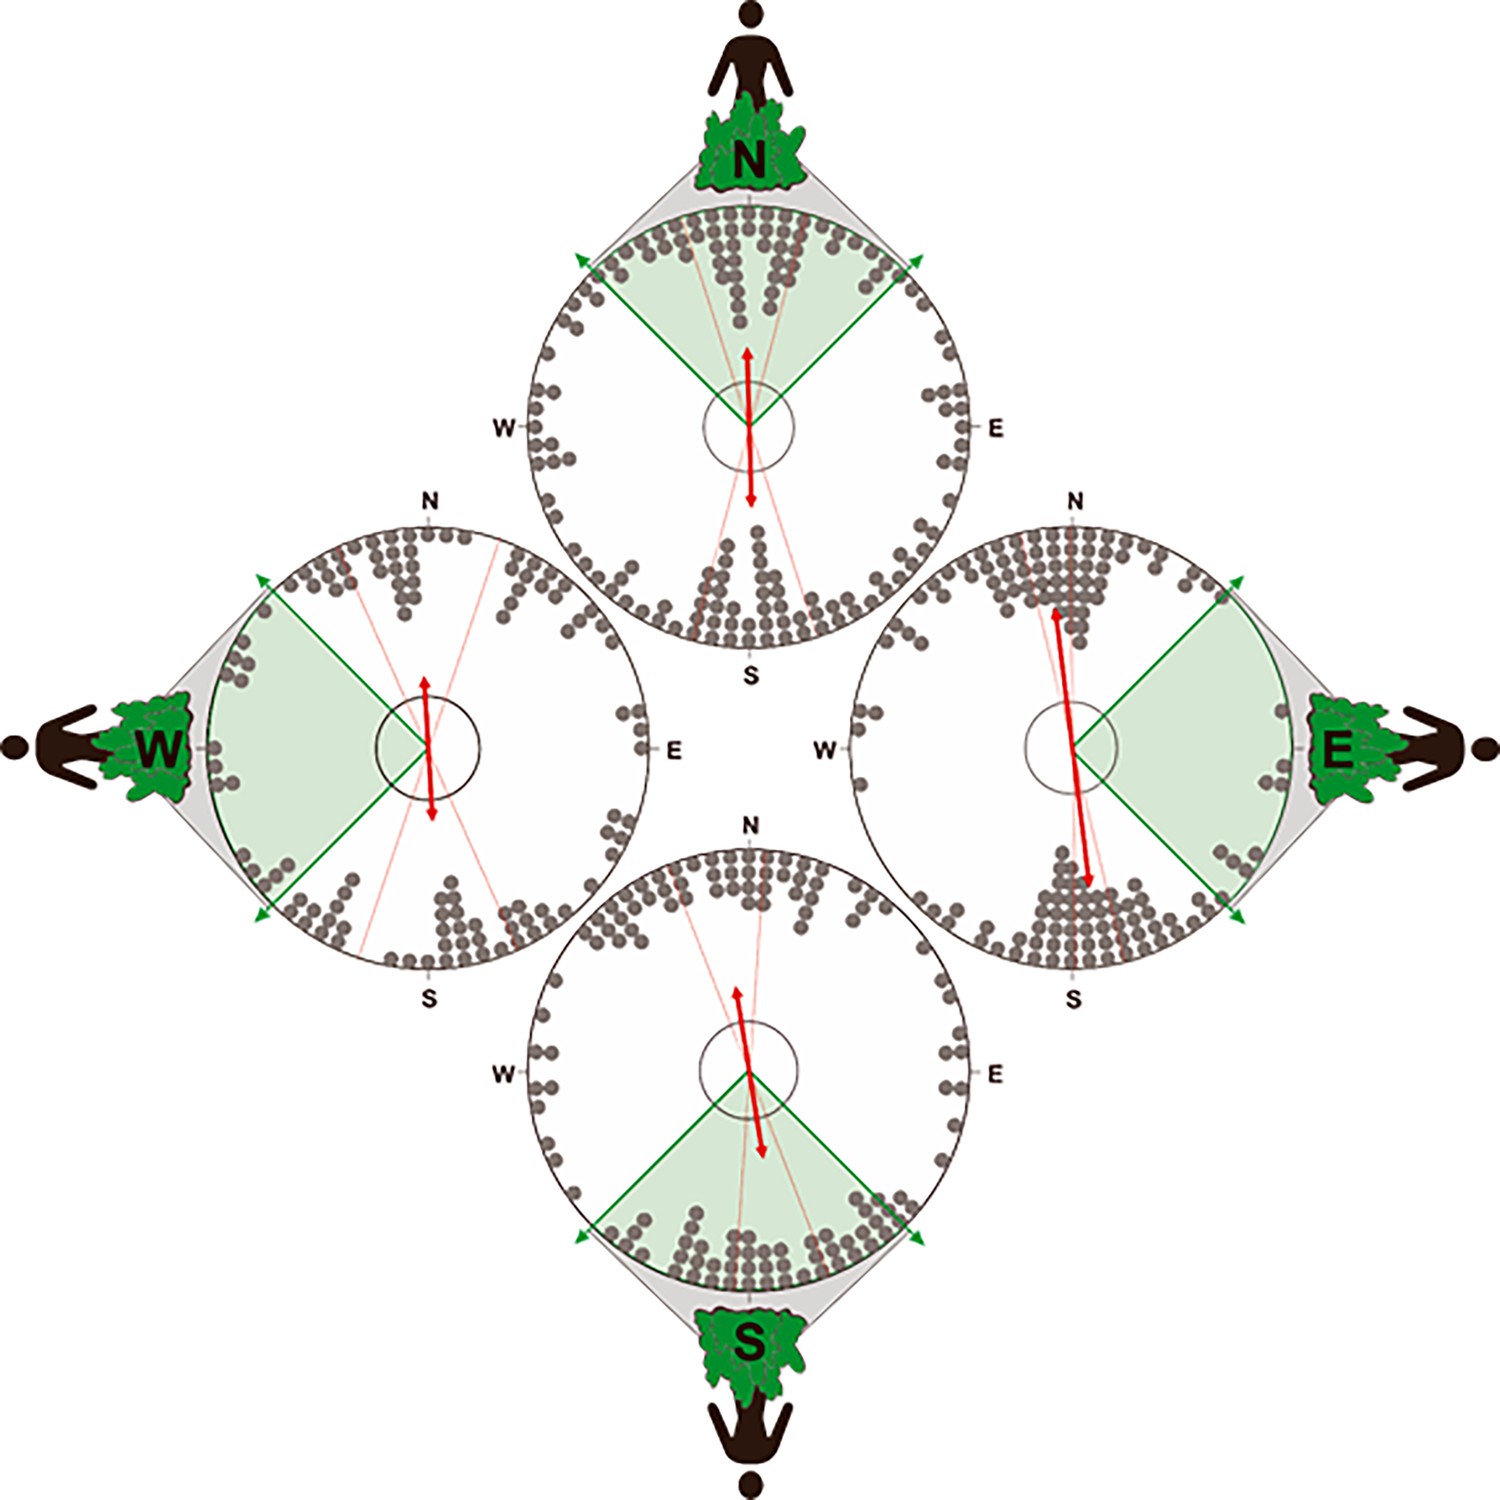
Orientation of the compass run plotted relative to the position of owner.
To test for an influence of the owner on the orientation of the compass run (azimuth C) during scouting, the data was partitioned into four distributions corresponding to when the owner was located at one of the four cardinal compass directions (±45°) relative to the turning point. Therefore, the distributions above show the orientation of azimuth C when the owner is positioned at magnetic ~north (316°−45°),~east (46°−135°),~south (136°−225°), or ~west (226°−315°) relative to the turning point (i.e. relative to the start of the compass run). If the N-S orientation of the compass run is a direct response to the owner (i.e. olfactory or visual piloting towards the owner), then in situations when the owner is located along the ~east west axis relative to the turning point, the orientation of the compass run should also align along the ~east-west axis. Alternatively, if the compass run is independent of the owner, then there should be no statistical difference in the orientation of azimuth C when the owner is position in different magnetic directions. Each distribution plots the axial bearings recorded from each excursion. The position of the owner relative to azimuth C is shown on the outside of each distribution and the shaded section of each plot bounded with green arrows shows the range of possible positions of the owner in each distribution (45° range centered on each cardinal compass direction). All other symbols are identical to those in Figure 6. Note that the axial bearings have been rounded to the nearest 5° only to facilitate the graphical representation of the responses and all statistics were calculated using data values measured to 1° resolution.
Figure 9
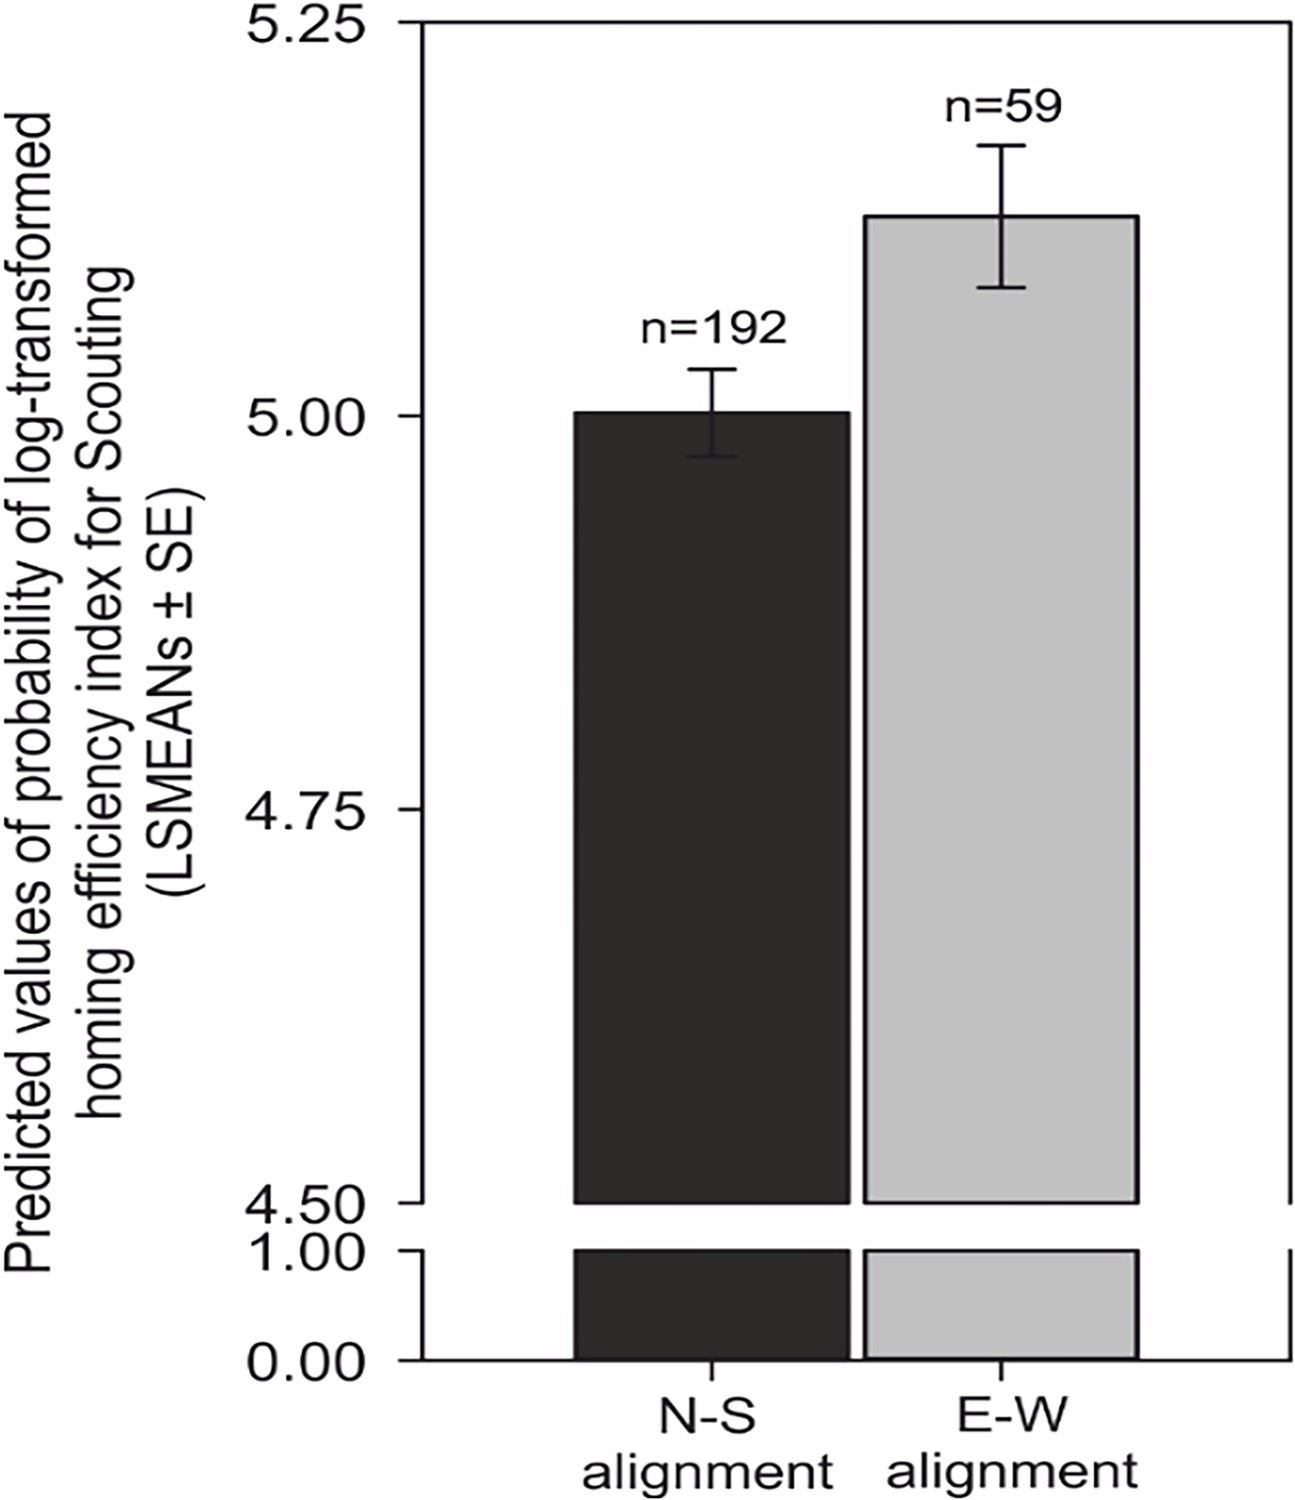
Compass run improves homing performance during scouting.
Comparison of predicted values of the probability of log-transformed homing efficiency index (LSMEANs ± SE) between dogs exhibiting a compass run oriented along the ~north south (±45°) compared to orientation along the east-west (±45°) axis during scouting return strategies. The efficiency of homing is expressed as the ratio (%) between the length of the dog’s inbound trajectory and the direct (beeline) distance between the turning point and the excursion start/owner. Titles and legends to supplementary videos.
Videos
Video 1
Example of all three phases of an excursion.
Labels of the left side of the video indicate the segment of the excursion. The video begins with the excursion start (i.e. the beginning of the outbound trajectory) when the dog becomes separated by >100 m from the owner, at which point the owner remains stationary in the forest. Shortly after, the dog detects and follows the olfactory track of a wild game animal, indicated by barking behaviour. After the outbound trajectory, the dog begins the turning trajectory phase of the excursion (see Materials and methods) and the turning point is shown when the dog briefly pauses. This location marks the beginning of the compass run (=alignment run, azimuth C, initial inbound segment). Lastly, the inbound trajectory is shown representing the phase when the dog is homing back to the location of the excursion start/owner.
Video 2
Example video showing the compass run behaviour during a scouting strategy return.
The GPS track is shown on the right half of the video with the red ‘bulls-eye’ tracker synced with the video shown on the left. The bulls-eye tracker moves across the track corresponding to the position of the dog in the video. The checkerboard square represents the location where the video ends, but does not represent any relevant features/landmarks used for analyses. Compass and GPS measurements are shown on the left and are synced to the video and bulls-eye tracker. Yellow labels appear superimposed on the right side of the screen to indicate relevant features of the excursion. Before reaching the turning point, the dog is travelling in a ~ west northwest direction. As shown, the compass run (=alignment run, azimuth C) starts at the turning point and the dog begins its initial inbound segment in the ~north direction. The compass run is terminated at 0:22 when the dog changes magnetic direction by >20° (see Materials and methods) and the inbound trajectory continues as the dog navigates back to the owner (not shown).
Additional files
-
Source data 1
Basic raw data used in calculations.
- https://cdn.elifesciences.org/articles/55080/elife-55080-data1-v1.xlsx
-
Supplementary file 1
Information on subjects studied, parameters included in the analyses, and results of circular statistics.
(A) Table 1 Information about dogs used in the study. Owner = initials of owner accompanying dog during walks, Age = age or age-range during the study period, NOUT = number of outbound trajectories, NIN = total number of inbound trajectories, NT = number of inbound returns using a tracking strategy, NS = number of returns using a scouting strategy. (B) Table 2 Factors in the final GLMMs for the dependent variables (in bold). a) probability for N-S alignment (±45°) during the initial inbound segment (i.e. ‘compass run’); b) probability for scouting strategy; c) efficiency of return; d) speed of inbound trajectory; e) inbound track length. (C) Table 3 Effects used in General Linear Mixed Models. (D) Table 4 Length parameters during different phases of the excursion (data from combined strategies are excluded). (E) Table 5 Circular analyses of individual (‘raw’) and grouped means for azimuth A, B and C during scouting and tracking strategies, and when a scouting strategy was used as the second return strategy (tracking used as a second return strategy not shown). Means were calculated by averaging directional headings for each dog, then calculating a grand mean from all individuals. Raw data were calculated by treating each azimuth as an independent bearing. Note that due to the bimodal preference found within individual dogs for azimuth C, these bearings were treated as axial data. See Figures 6–8. (F) Table 6 Axial analyses of azimuth C (=orientation of the compass run) partitioned into four groups to test for an influence of the owner on the orientation of the compass run during scouting strategy returns. Each analysis corresponds to the orientation of the compass run when the owner was located in one of four cardinal compass directions (±45°) relative to the turning point. Therefore, owner positions relative to the turning point are: owner = magnetic ~ north (316°−45°),~east (46°−135°),~south (136°−225°), or ~west (226°−315°). All data are treated as independent bearings. (See Figure 8).
- https://cdn.elifesciences.org/articles/55080/elife-55080-supp1-v1.docx
-
Transparent reporting form
- https://cdn.elifesciences.org/articles/55080/elife-55080-transrepform-v1.pdf
Download links
A two-part list of links to download the article, or parts of the article, in various formats.
Downloads (link to download the article as PDF)
Open citations (links to open the citations from this article in various online reference manager services)
Cite this article (links to download the citations from this article in formats compatible with various reference manager tools)
Magnetic alignment enhances homing efficiency of hunting dogs
eLife 9:e55080.
https://doi.org/10.7554/eLife.55080


